Original Article
Iron status of the Taiwanese elderly: the prevalence of
iron deficiency and elevated iron stores
Jui-Line Wang PhD
1,2and Ning-Sing Shaw PhD
21 Department of Food and Nutrition, Hung-Kuang University, Taichung, Taiwan
2 Institute of Microbiology and Biochemical Sciences, National Taiwan University, Taipei, Taiwan
Iron status, prevalence of iron deficiency and elevated iron stores, and the effect of gastrointestinal ulceration on iron status in free-living Taiwanese elderly persons were all assessed in a nationally representative, cross-sectional nutrition survey ─ the Elderly NAHSIT. The survey included blood measurements of iron indices. Data were collected from 1202 elderly men and 1152 elderly women aged 65 years and older. Multiple iron measures, including serum ferritin (SF), transferrin saturation (Tsat), and hemoglobin were used to evaluate the prevalence of iron deficient erythropoiesis (ID) and iron deficiency anemia (IDA). Despite no routine practice of iron fortification in Taiwan, elderly subjects had a low prevalence of ID and IDA. The prevalence of ID was 2.3% in men and 1.4% in women. The prevalence of IDA was 2.5% in men and 2.0% in women. In contrast, 15.7% of men and 9.8% of women had elevated iron stores as diagnosed by SF >300 µg/L. Subjects with a history of gastrointestinal ulceration had significantly lower serum ferritin than those without ulcers, but the prevalence of anemia, ID and IDA was unaffected. In conclusion, elderly people in Taiwan are an iron-replete population with a high prevalence of elevated iron stores and a low prevalence of iron deficiency.
Key Words: iron status, iron deficiency, iron overload, serum ferritin, transferrin saturation, gastrointestinal ulcer, Elderly Nutrition and Health Survey in Taiwan (1999-2000)
Introduction
Increasing life expectancy is a worldwide phenomenon and has led to a progressive increase in the proportion of elderly people within the population. This ageing of society will ultimately lead to a rise in a number of age-related health conditions including an increased risk of nutritional deficiency, disease and disability.
Although iron stores appear to increase with advancing age,1-3 signs of iron deficiency and/or low body iron stores still occur in the elderly in developed countries.4-6 Both iron deficiency and iron excess may impair health. Iron deficiency is a common cause of anemia,7 and has many negative effects on immune function, motor and mental development, temperature regulation, energy metabolism, and work performance.8 On the other hand, moderately elevated iron stores can also be of concern because of their possible association with several chronic diseases, such as heart disease, cancer, and diabetes.8,9
Little is known about the iron nutriture of elderly Taiwanese, the fastest-growing segment of our population. The few reports there have been previously were based on non-representative, convenience samples or had a small sample size.10-12 The objectives of this study were to assess the iron status, to estimate the prevalence of iron deficiency and elevated iron stores, and to evaluate the effect of gastrointestinal ulceration on iron status in the Taiwanese elderly, based on a nationally representative, cross-sectional sample of non-institutionalized elderly in Taiwan.13
Materials and Methods
Subjects
The Elderly Nutrition and Health Survey in Taiwan (1999-2000) (Elderly NAHSIT) was a government-sponsored sur-vey, which included a 24-hour dietary recall, food fre-quency questionnaire, and a health status and education status assessment by questionnaire and household inter-view. The complex sampling scheme used in this survey is reported in detail in another paper in this issue.13 Eligible subjects were adult citizens aged 65 years and above who had completed a physical examination and assessment of iron status. A total of 2354 subjects, including 1202 males and 1152 females, were included in this study. Legal, ethical, and social principles have been taken into sideration in the grant reviewing process. Informed con-sent was obtained from all participants.
Measurement of iron status indices
Fasting venous blood samples from subjects were collected in vacuum tubes. Heparinized whole blood was used for on-site measurement of hemoglobin. Serum samples were
Correspondence address:. Ning-Sing Shaw, Ph. D., Institute of Microbiology and Biochemical Sciences, National Taiwan University No. 1, Sec. 4, Roosevelt Rd. Taipei, Taiwan
Tel: 886 2 33665900; Fax: 886 2 33665900 Email: [email protected]
279 J-L Wang and N-S Shaw
frozen and shipped to the laboratory for biochemical assessments after sample collection was completed. The indicators of iron status measured were hemoglobin, serum iron (SI), total iron binding capacity (TIBC), and serum ferritin (SF). Transferrin saturation (Tsat) was calculated as a percentage of SI to TIBC. Hemoglobin was measured colorimetrically by the cyanomethemo-globin method (Merckotest, Merck) using a portable filter photometer (Flash) calibrated with hemoglobin cyanide standard solution (Merck). SF was measured with an en-zyme immunoassay using heterogeneous sandwich mag-netic separation (Bayer Immuno I, Bayer Co., USA) on the Technicon Immuno 1 System. SI and TIBC were measured by colorimetric assay (Olympus System Rea-gent) using an Olympus Autoanalyzer. For all the hema-tological measurements, both intra- and inter-assay pre-cision were controlled at CV <10% using commercial quality controls and blind duplicate samples.
Cut-off values for abnormal iron indices were set at Tsat <15% and SF <12µg/L.1,4,8 Criteria for anemia were based on the WHO cut-off values of hemoglobin <120g/L for females and <130 g/L for males.14 Elevated iron stores were defined as SF >300 µg/L.3,4,15
Statistical analysis
Measurements were expressed as mean ± standard error. All variables were weighted to reflect the population dis-tribution in Taiwan. The T-test was applied to compare the mean values between genders or subgroups. The asso-ciation between SF and other iron indices was evaluated by Pearson correlation analysis and logistic regression analysis. Differences in prevalence by gender and sub-groups were examined with the chi-square test. The desig-nated level of statistical significance was P <0.05. Sta-tistical analyses were performed using SAS version 8.216 and SUDAAN version 9.0.17
Results
Iron status measurements
The mean values for SI, TIBC, Tsat, and SF by age and gender are listed in Table 1 along with the reference ranges obtained from NHANES.18 The mean or median concentration of all iron measurements for both men and women fell within the reference range. Elderly men had a significantly higher SI, Tsat and SF than elderly women. SI, Tsat and SF decreased with age in both men and women; TIBC decreased with age only in women.
Prevalence estimates of high iron stores
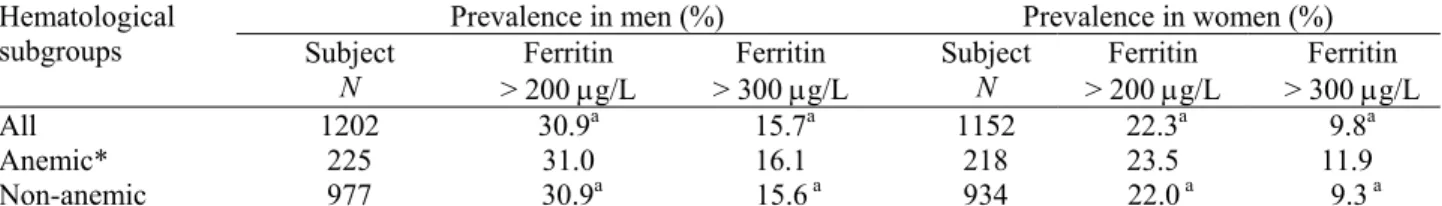
The prevalence of SF >300 µg/L was 15.7% in men and 9.8% in women. The prevalence of high iron stores, however, increased to 30.9% in men and 22.3% in women when the SF cutoff was set at >200 µg/L (Table 2). For both men and women, the percentage of high iron stores did not differ between the anemic and the non-anemic subgroups. There were a significantly greater proportion of men than women in the high SF ranges.
Prevalence estimates of iron depletion and iron deficiency anemia
A significant negative correlation existed between SF and TIBC (r = -0.10, P <0.0001), while a positive correlation
existed between SF and hemoglobin (r = 0.13, P <0.0001), SI (r = 0.25, P <0.0001), and Tsat (r = 0.31, P <0.0001). Low SF was associated with higher risk of elevated TIBC and depressed Tsat. At SF levels of 30–49 µg/L, the odds ratios for TIBC >300µg/dL and Tsat <15% were 2.27 and 4.28, respectively. At SF<30 µg/L, the odds ratios in-creased to 4.31 and 47.7, respectively (Table 3).
The prevalence and hematological characteristics of depleted iron stores, low iron stores, iron deficient ery-thropoiesis (ID) and iron deficiency anemia (IDA) are listed in Table 4. Depleted iron stores are defined as a SF <12 µg/L and the prevalence was 2.6% in men and 1.9% in women. Low iron stores are represented by SF<30 µg/L and the prevalence was 9.0% in men and 6.6% in women. ID is defined as a SF <12µg/L without anemia, or a SF between 12 and 30µg/L accompanied by another abnormal iron measurement (Tsat<15% or anemia). IDA is defined as anemia with SF <12 µg/L or anemia with SF <30 µg/L plus Tsat <15 %. According to these criteria, the prevalence of ID was 2.3% in elderly men and 1.4% in elderly women, and the prevalence of IDA was 2.5% in men and 2.0% in women.
Effect of gastrointestinal ulceration on iron status Iron status indices between subjects with or without gastrointestinal ulcers (GI ulcer) are compared in Table 5. For subgroups with and without GI ulcer, the median SF values were 109 and 141µg/L, respectively, for elderly men, and 77 and 118µg/L, respectively, for elderly wo-men. The median SF was significantly lower in the ulcer subgroup than in the no-ulcer subgroup for both genders. The odds ratio for association between having an ulcer and SF <50µg/L was 1.99 (CI = 1.20-3.30, P = 0.0092) based on logistic regression. However, other iron indices were unaffected by the presence or absence of GI ulcera-tion. The prevalence of anemia, ID and IDA showed no relationship with GI ulceration.
Discussion
This is the first study looking at the iron status of a large sample of free-living elderly Taiwanese and reports pre-valence estimates of both iron deficiency and elevated iron stores. We first determined a SF concentration that would maximize the detection of iron deficiency in the elderly, and then applied these criteria to the assessment of iron status.
Cutoff values for serum ferritin
Serum ferritin is not only indicative of mobilisable body iron stores that are affected by age and gender-related changes, but is also an acute-phase protein that is in-creased in anemia of chronic disease.8 SF decreases du-ring the early stages of iron deficiency as iron stores are depleted, and values <12-20 µg/L are commonly used to diagnose uncomplicated iron deficiency.1-4
Due to the confounding effect of chronic disease, higher cut-off values such as 37,19 45,20 60,21 7522 and 90 µg/L23 have been proposed for the aged with inflamma-tory disease, based on response to iron supplementation or examination of stainable iron in bone marrow aspirates. It is well established that iron deficiency causes elevated TIBC and depressed Tsat, while iron overload suppresses
Table 1. Mean values of iron status measurements in Taiwanese elderly by age and gender
Age
(yr) Subject N Serum Fe (µg/dL) (µg/dL) TIBC saturation (%) Transferrin Ferritin (µg/L)Median Men All 1202 108 ± 2a 277 ± 3 38.9 ± 0.5a 138 a 65-69 449 113 ± 2a 276 ± 4 40.8 ± 0.7a 158 a 70-74 417 109 ± 3a 284 ± 4 38.5 ± 0.7*a 133* 75-79 219 103 ± 3*a 273 ± 5 37.4 ± 1.0*a 110* ≥80 117 100 ± 5*a 268 ± 7 37.3 ± 1.2*a 115* P trend 0.0032 0.1181 0.0052 0.0059 Women All 1152 91 ± 1 272 ± 3 33.6 ± 0.6 115 65-69 471 95 ± 2 276 ± 4 34.2 ± 0.9 119 70-74 351 94 ± 2 276 ± 5 34.4 ± 0.8 118 75-79 211 87 ± 3 269 ± 4 32.5 ± 0.9 119 ≥80 119 84 ± 3* 261 ± 4* 32.3 ± 1.2 86* P trend 0.0011 0.0006 0.0417 0.0144 Normal range† 40-160 227-400 16-55 10-300
Values are mean ± SE except for ferritin which is expressed as a median value calculated with SAS. An * indicates significant difference when compared to the age group 65-69; superscript “a” indicates significant difference between genders; P for trend was analyzed with age groups and ferritin values were log-transformed before analysis; the cut-off for significance was P < 0.05; TIBC = Total Iron Binding Capacity. †Normal ranges are values from the Nutrition Evaluation Laboratory at the Jean Mayer US Department of Agriculture Human Nutrition Research Center on Aging at Tufts University.3
Table 2. Prevalence of high serum ferritin values in the Taiwanese elderly
Prevalence in men (%) Prevalence in women (%) Hematological
subgroups Subject
N > 200 µg/L Ferritin > 300 µg/L Ferritin Subject N > 200 µg/L Ferritin > 300 µg/L Ferritin
All 1202 30.9a 15.7a 1152 22.3a 9.8a
Anemic* 225 31.0 16.1 218 23.5 11.9
Non-anemic 977 30.9a 15.6 a 934 22.0 a 9.3 a
* Hemoglobin <130 g/L for men and < 120 g/L for women; superscript “a” indicates significant difference between genders (P < 0.05); there was no difference between anemic and non-anemic subgroups by gender.
Table 3. Risk of low serum ferritin on elevated total iron binding capacity and reduced transferrin saturation in
Taiwanese Elderly
Grouping by ferritin concentration (µg/L) Variable/Iron indices <30 30-49 50-99 100-199 200+ Subjects N (%) (7.52) 177 (8.84) 208 (23.28) 548 (32.65) 766 (27.82) 655 TIBC (µg/dL) 305 ± 5 284 ± 4 275 ± 3 273 ± 3 265 ± 4 TIBC >300 µg/dL Odds ratio (95% CI) 4.31* (2.58-7.19) (1.50-3.42) 2.27* (0.98-1.95) 1.38 (0.76-1.50) 1.07 1.00 Transferrin Saturation (%) 25.4 ± 1.2 31.0 ± 0.8 35.0 ± 0.7 37.1 ± 0.6 41.9 ± 0.6 Tsat < 15% Odds ratio (95% CI) 47.7* (13.9-153) 4.28* (1.18-15.6) 1.33 (0.45-3.95) 2.04 (0.78-5.31) 1.00
* Values are mean ± SE, logistic regression analysis adjusted by gender, age and area strata, significant at P < 0.05. TIBC = Total Iron Binding Capacity, CI = confidence intervals, Tsat= Transferrin Saturation.
281 J-L Wang and N-S Shaw
TIBC and raises Tsat.8,24 In this study, we considered SF <30 µg/L as a reasonable cut-off because of the negative correlation between SF and TIBC as well as a sharp rise in the odds ratio for TIBC >300µg/dL and Tsat <15%. The association between SF at 30-49 µg/L and the risk of elevated TIBC and reduced Tsat was also significant but was a weaker association and therefore, we did not adopt SF <50 µg/L as the cut-off value. However, a value in this range does not fully exclude the possibility of ID. Iron deficiency
Many surveys have consistently found a low prevalence of ID and IDA in the elderly. The prevalence of ID was 4% in men and 7% in women aged 70 years and older in the United States NHANES III data, and that of IDA was 2% in both men and women.4,25 For Danish men and women aged 80 yrs and older, the prevalence of IDA was 0.84%, and ID was 2% in men and 5% in women.26 For Singaporean men and women aged 50-60 yrs, the pro-portion with ID was 0.4% and 2.6%, respectively.27 In the Netherlands, the prevalence of ID was 11% in men and 5% in women aged 50-69 yrs, and IDA was less than 5% for both men and women in this age group.28 The dis-parity in low iron status typically seen between younger men and women is markedly absent in the elderly. We also found that ID and IDA are uncommon among the elderly in Taiwan.
Better iron nutriture and elimination of iron deficiency in industrialized countries has been largely attributed to the increase of dietary iron intake via fortification of staples.29-31 Taiwan has not practiced a food fortification policy; however, the iron status of the elderly in Taiwan is comparable to that in Western countries.
High iron stores
Moderately elevated iron stores may be associated with several chronic diseases, such as coronary heart disease,32-34 cancer35 and diabetes.36,37 As concern about high storage iron has only occurred in recent times, prevalence data in elderly populations involve mostly Western or Caucasian populations. This study is probably the first to report high iron stores in an Asian elderly population. Table 6 com-pares the mean SF levels between this study and other surveys. Our data for the Taiwanese elderly are in agreement with results from Korea and some Western countries.3,5,6,25,26,38,39 Overall, the well-known gender-related difference in ferritin level (higher in men) persists but with less disparity in old age. An age-related decline in the advanced older age groups was found in three listed surveys including ours.
The reference range for SF is commonly considered to be 15-300 µg/L,15 suggesting >300 µg/L as indicative of abnormally high iron stores for both genders.3 Nearly 14% of elderly men and 6% of elderly women in Den-mark,9,26,38,39 and 12.9% of the elderly in the United States had elevated iron stores.3 The prevalence of 15.7 % in elderly men and 9.8 % in elderly women in Taiwan is as high as that in other industrialized countries.
In industrialized nations, elevated iron stores have been attributed to food fortification, increased use of iron supplements and dietary changes.31,37,38 The Western diet has shifted to contain more highly bioavailable iron and fewer foods that inhibit iron absorption.25 These explana-tions may not be applicable to this study because intake of iron supplements and red meat are generally much lower in Taiwan. In contrast, our study provides supporting evi-dence that increased iron stores can occur in the absence of iron fortification. The impact of chronic disease may also play a role and needs to be explored.
Effect of GI ulceration
Iron deficiency is a result of an imbalance between iron loss and absorption. In industrialized counties, where the prevalence of IDA is low, IDA is considered almost syno-nymous with blood loss.40 In premenopausal women, blood loss is generally attributed to heavy menstrual flow. On the other hand, blood loss is generally due to occult bleeding from the GI tract in men and postmenopausal women. It has been noted that the incidence of gastric and duodenal ulcers and their bleeding complications is increasing in elderly populations worldwide.41,42 Mucosal blood loss may range from discrete bleeding from gastric erosions to massive bleeding from peptic ulcers. Discrete gastrointestinal bleeding will gradually diminish body iron stores, causing a decrease in SF. However, as long as iron reserves are not completely exhausted, hemo-globin levels remain within the normal range. In this study, we found that subjects with a history of GI ulcer-ation had a measurable decline in SF, indicating de-creased iron stores. We also found that the mean daily iron intake was not different between the subgroups with and without ulcers (13.0 and 13.1 mg in men with and without ulcers, respectively, P = 0.85; 12.9 and 11.0mg in women with and without ulcers, respectively, P = 0.12). Therefore, in an iron-replete population such as the elderly, GI bleeding is a likely factor behind changes in iron status. Lower SF may have health implications. In two prospective studies, low SF have been associated with an increased risk of developing gastric cancer later in life.43,44 Serious gastro-intestinal pathology was found in elderly patients with SF <50 µg/L.45 We also demon-strated an increased risk of SF <50 µg/L in subjects with a history of ulcers.
Conclusion
Using the Elderly NAHSIT data, we proposed a cut-off value of SF <30µg/L for defining iron depletion in the elderly. The combined prevalence of ID and IDA in the Taiwanese elderly was 4.8% in men and 3.4% in women. The proportion of elevated iron stores reached 10% in women and 16% in men. The iron status of the elderly in Taiwan is comparable to that in industrialized countries that have practiced iron fortification. Gastrointestinal ul-ceration is a likely explanation for reduced body iron stores in the elderly.
Table 4. Prevalence and characteristics of iron deficiency (ID) and iron deficiency anemia (IDA) by gender and age in the Taiwanese elderly
Male Female Gender/
Iron indices Ferritin
< 12 µg/L < 30 µg/LFerritin deficient Iron erythropoiesis
Iron deficiency
anemia
Ferritin
< 12 µg/L < 30 µg/LFerritin deficient Iron erythropoiesis Iron deficiency anemia4 (N = 32) (N = 100) (N = 25) (N = 31) (N = 22) (N = 77) (N = 15) (N = 27) Prevalence (%) 2.6 9.0 2.3 2.5 1.9 6.6 1.4 2.0 Hemoglobin (g/L) 112 ± 6 126 ± 3 122 ± 3 100 ± 6 98 ± 5 117 ± 3 110 ± 3 95 ± 4 TIBC (µg/dL) 315 ± 13 302 ± 5 299 ± 7 312 ± 13 316 ± 0.6 310 ± 8 320 ± 11 315 ± 17 Serum Fe (µg/dL) 40 ± 6 81 ± 5 81 ± 8 33 ± 4 40 ± 7 71 ± 6 79 ± 12 36 ± 6 Median Ferritin (µg/L) 8.9 17.0 17 9.1 7.5 19.1 20 9.7 Transferrin saturation (%) 12.7 ± 1.8 27.0 ± 1.6 26.9 ± 2.3 10.5 ± 1.3 12.2 ± 2.0 23.0 ± 1.8 25.3 ± 4.1 11.4 ± 1.8
* Criteria for anemia were hemoglobin < 130 g/L for males and <120 g/L for females; criteria for iron deficient erythropoiesis were ferritin < 12 µg/L without anemia, or ferritin between 12 - 30 µg/L accompanied by another abnormal iron measurement (transferrin saturation < 15% or anemia); criteria for iron deficiency anemia were: anemia with ferritin < 12 µg/L, or anemia with both transferrin saturation < 15% and ferritin < 30 µg/L. TIBC = Total Iron Binding Capacity
Table 5. Effect of gastrointestinal ulceration on iron status by gender in the Taiwanese elderly*
Male Female
Iron status indices GI ulcer
(N = 113) No GI ulcer (N = 1089) P value GI ulcer (N = 67) No GI ulcer (N = 1058) P value
Anemia (%) 17.5 19.7 0.5285 17.0 18.9 0.7777 ID (%) 3.0 2.2 0.6391 2.8 1.3 0.6174 IDA (%) 2.7 2.5 0.9440 0.7 2.1 0.0513 Hemoglobin (g/L) 141 ± 2 141 ± 1 0.8641 128 ± 1 129 ± 1 0.3601 Ferritin, median (µg/L) 109 141 0.0451 77 118 <0.0001 TIBC (µg/dL) 274 ± 6 277 ± 3 0.5886 277 ± 7 272 ± 3 0.4754 Serum Fe (µg/dL) 106 ± 4 108 ± 2 0.6731 90 ± 7 91 ± 1 0.8271 Transferrin saturation (%) 38.8 ± 1.4 38.9 ± 0.5 0.9363 32.9 ± 3.0 33.7 ± 0.5 0.7894
* Values are mean ± SE except for ferritin which is expressed as a median and log- transformed before trend analysis,significant at P < 0.05. ID = iron deficient erythropoiesis, IDA = iron deficiency anemia.
283 J-L Wang and N-S Shaw
Acknowledgement
This study was supported by a grant (DOH90-TD-1073) from the Department of Health in Taiwan. The authors thank Dr. Tsan-Zon Liu, Department of Medical Biotechnology and Laboratory Science, Chang Gung University, Tao-Yuan, and staff of the Laboratory Medicine Department, Yuan’s General Hospital, Kaohsiung, for their excellent technical assistance in hematological analyses. Appreciation also goes to Dr. Wen-Harn Pan, Director of the research project "Nutrition and Health Survey in Taiwan (NAHSIT)" for collection of the blood specimens. The views expressed herein are solely those of the authors.
References
1. Cook JD, Finch CA, Smith NJ. Evaluation of the iron status of a population. Blood 1976; 48:449-455.
2. Cook JD, Skikne BS, Lynch SR, Reusser ME. Estimates of iron sufficiency in the US population. Blood 1986; 68:726-731.
3. Fleming DJ, Jacques PF, Tucker KL, Massaro JM, D'Agostino RB Sr, Wilson PW, Wood RJ. Iron status of the free-living, elderly Framingham Heart Study cohort: an iron-replete population with a high prevalence of elevated iron stores. Am J Clin Nutr 2001; 73:638-646.
4. Looker AC, Dallman PR, Carroll MD, Gunter EW, Johnson CL. Prevalence of iron deficiency in the United States. JAMA 1997; 277:973-976.
5. Doyle W, Crawley H, Robert H, Bates CJ. Iron deficiency in older people: interactions between food and nutrient intakes with biochemical measures of iron; further analysis of the National Diet and Nutrition Survey of people aged 65 years and over. Eur J Clin Nutr 1999; 53:552-559.
6. Choi CW, Lee J, Park KH, Yoon SY, Choi IK, Oh SC, Seo JH, Kim BS, Shin SW, Kim YH, Kim JS. Prevalence and characteristics of anemia in the elderly: cross-sectional study of three urban Korean population samples. Am J Hematol 2004; 77:26-30.
7. Yip R, Dallman PR. The roles of inflammation and iron deficiency as causes of anemia. Am J Clin Nutr 1988; 48:1295-1300.
8. Johnson MA, Fischer JG, Bowman BA, Gunter EW. Iron nutriture in elderly individuals. FASEB J 1994; 8:609-621.
9. Milman N, Kirchhoff M. Relationship between serum ferritin and risk factors for ischaemic heart disease in 2235 Danes age 30-60 years. J Intern Med 1999; 245:423-433. 10. Huang Y, Wong Y, Wueng S, Cheng C, Su K. Nutrient
intakes and iron status of elderly men and women. Nutr Res 2001; 21:967-981.
11. Huang YC, Wueng SL, Ou CC, Cheng CH, Su KH. Nutritional status of functionally dependent and nonfunctionally dependent elderly in Taiwan. J Am Coll Nutr 2001; 20:135-142.
12. Shaw NS, Yeh WT, Pan WH. Prevalence of iron deficiency in the general population in Taiwan. Nutr Sci J 1999; 24:119-138.
13. Pan WH,Hung YT, Shaw NS, Lin W, Lee SD, Chiu CF, Lin MC, Chen SY, Hong CM, Huang TY, Chang HY, Tu SH, Chang YH, Yeh WT, Su SC. Elderly Nutrition and Health Survey in Taiwan (1999–2000): research design, methodology and content. Asia Pac J Clin Nutr 2005; 14 (3): 203-210.
14. FAO/WHO. Nutritional anemias. WHO Technical Report Series No. 405, WHO, Geneva. 1968.
15. Worwood M. Laboratory determination of iron status. In: Brock, JH, Halliday, JW, Pippard, MJ, Powell, LW, eds. Iron Metabolism in Health and Disease. London: W.B. Saunders, 1994: 449–476.
16. SAS Institute Inc. SAS/STAT User's Guide, Version 6, 4th ed., vol. 2. SAS Institute, Cary, NC, 1990.
17. Shah BV, Barnwell BG, Bieler GS. SUDAAN user's manual. Release 7.5.Research Triangle Park, North Carolina: Research Triangle Institute, 1997.
18. Expert Scientific Working Group. Summary of a report on assessment of the iron nutritional status of the United States population. Am J Clin Nutr. 1985; 42:1318-1830.
19. Lee JH, Hahn JS, Lee SM, Kim JH, Ko YW. Iron related indices in iron deficiency anemia of geriatric Korean patients. Yonsei Med J 1996; 37:104-111.
20. Guyatt GH, Patterson C, Ali M, Singer J, Levine M, Turppie I, Meyer R. Diagnosis of iron-deficiency anemia in the elderly. Am J Med 1990; 88: 205-209.
21. Hansen TM, Hansen NE. Serum ferritin as indicator of iron responsive anemia in patients with rheumatoid arthritis. Ann Rheum Dis 1986; 45:596-602.
22. Holyoake TL, Stott DJ, McKay PJ, Hendry A, MacDonald JB, Lucie NP. Use of plasma ferritin concentration to diagnose iron deficiency in elderly patients. J Clin Pathol 1993; 46:857-860.
23. Ahluwalia N, Lammi-Keefe CJ, Bendel RB, Morse EE, Beard JL, Haley NR. Iron deficiency and anemia of chro-nic disease in elderly women: a discriminant-analysis approach for differentiation. Am J Clin Nutr 1995; 61:590-596.
24. Cook JD, Finch CA. Assessing iron status of a population. Am J Clin Nutr 1979; 32: 2115-2119.
25. Institute of Medicine. Dietary Reference Intakes of Vitamin A, Vitamin K, Arsenic, Boron, Chromium, Copper, Iodine, Iron, Manganese, Molybdenum, Nickel, Silicon, Vanadium, and Zinc, pp. 290-393 and 684-685 Washington DC: National Academy Press, 2002.
26. Milman N, Pedersen AN, Ovesen L, Schroll M. Iron status in 358 apparently healthy 80-year-old Danish men and women: relation to food composition and dietary and supplemental iron intake. Ann of Hematol 2004; 83:423-429.
27. Hughes K. Serum ferritin and iron status in the general population of Singapore, 1993-1995. Ann Acad Med Singapore 1998; 27:507-511.
Table 6. A comparison of serum ferritin values by sex in
the elderly from different countries
Country Age group Serum ferritin, median* (µg/L)
Years Men Women
Taiwan (Elderly NAHSIT) ≥ 65 ≥ 80 138 115 115 86 Korea*6 60-95 92.3 ± 2.3 65.7 ± 2.0 Denmark26,38,39 ≥ 70 ≥ 80 148 98 95 68 United States, NHANES III25 51-70 ≥ 71 161 91 136 96 United States, Framingham Heart Study3 67-96 120 79
Mainland Great Britain, National Diet and
Nutrition Survey*5 65-74 ≥ 75 120 124 85.7 92.9
* Values from the Korean study are geometric means and SD, and in the UK study are means.
28. Brussaard JH, Brants HA, Bouman M, Lowik MR. Iron intake and iron status among adults in the Netherlands. Eur J Clin Nutr 1997; 51suppl 3:S51-S58.
29. Ramakrishnan U, Yip R. Experiences and challenges in industrialized countries: control of iron deficiency in industrialized countries. J Nutr 2002; 132 suppl 4: S820-S824.
30. Berner LA, Clydesdale FM, Douglass JS. Fortification contributed greatly to vitamin and mineral intakes in the United States, 1989–1991. J Nutr 2001; 131:2177-2183. 31. Heath AL, Fairweather-Tait SJ. Clinical implications of
changes in the modern diet: iron intake, absorption and status. Best Pract Res Clin Haematol 2002; 15:225-241. 32. Salonen JT, Nyyssonen K, Korpela H, Tuomilehto J,
Seppanen R, Salonen R. High stored iron levels are associated with excess risk of myocardial infarction in eastern Finnish men. Circulation 1992; 86: 803-811. 33. Tuomainen TP, Punnonen K, Nyyssonen K, Salonen JT.
Association between body iron stores and the risk of acute myocardial infarction in men. Circulation 1998; 97:1461-1466.
34. Klipstein-Grobusch K, Koster JF, Grobbee DE, Lindemans J, Boeing H, Hofman A, Witteman JC. Serum ferritin and risk of myocardial infarction in the elderly: the Rotterdam Study. Am J Clin Nutr 1999; 69:1231-1236.
35. Stevens RG, Jones DY, Micozzi MS, Taylor PR. Body iron stores and the risk of cancer. N Engl J Med 1988; 319: 1047-1052.
36. Salonen JT, Tuomainen TP, Nyyssonen K, Lakka HM, Punnonen K. Relation between iron stores and non-insulin dependent diabetes in men: case-control study. Br Med J 1998; 317: 727-730.
37. Tuomainen TP, Nyyssonen K, Salonen R, Tervahauta A, Korpela H, Lakka T, Kaplan GA, Salonen JT. Body iron stores are associated with serum insulin and blood glucose concentrations. Population study in 1,013 eastern Finnish men. Diabetes Care 1997; 20: 426-428.
38. Milman N, Byg KE, Ovesen L, Kirchhoff M, Jurgensen KS. Iron status in Danish women, 1984-1994: a cohort comparison of changes in iron stores and the prevalence of iron deficiency and iron overload. Eur J Haematol 2003; 71:51-61.
39. Milman N, Ovesen L, Byg K, Graudal N. Iron status in Danes updated 1994. I: Prevalence of iron deficiency and iron overload in 1332 men aged 40-70 years. Influence of blood donation, alcohol intake, and iron supplementation. Ann Hematol 1999; 78: 393-400.
40. Annibale B, Capurso G, Delle Fave G. The stomach and iron deficiency anaemia: a forgotten link. Dig Liver Dis 2003; 35: 288-295.
41. Pilotto A. Aging and upper gastrointestinal disorders. Best Prac Res Clin Gastroenterology 2004; 18:73-81.
42. Milman N, Rosenstock S, Andersen L, Jorgensen T, Bonnevie O. Serum ferritin, hemoglobin, and Helicobacter pylori infection: a seroepidemiologic survey comprising 2794 Danish adults. Gastroenterology 1998; 115:268-274. 43 Nomura A, Chyou PH, Stemmermann GN. Association of
serum ferritin levels with the risk of stomach cancer. Cancer Epidemiol Biomarkers Prev 1992;1:547-550. 44 Akiba S, Neriishi K, Blot WJ, Kabuto M, Stevens RG,
Kato H, Land CE. Serum ferritin and stomach cancer risk among a Japanese population. Cancer 1991; 67:1707-1712. 45 Lee JG, Sahagun G, Oehlke MA, Lieberman DA. Serious
gastrointestinal pathology found in patients with serum ferritin values < or = 50 ng/ml. Am J Gastroenterol 1998; 93:772-776.