Daily Stroke Admissions in Kaohsiung, Taiwan
Shang-Shyue Tsai, PhD; William B. Goggins, ScD; Hui-Fen Chiu, PhD; Chun-Yuh Yang, PhD, MPH
Background and Purpose—Many studies have reported increases in daily cardiovascular mortality and hospitaladmissions associated with increases in levels of air pollutants. However, little is known about the relationship between hospital admissions for stroke and air pollution. This study was undertaken to determine whether there is an association between air pollution and hospital admissions for stroke in Kaohsiung, Taiwan.
Methods—Data on a total of 23 179 stroke admissions were obtained for the period 1997 through 2000. The relative risk of hospital admissions was estimated with a case-crossover approach.
Results—In the single-pollutant models, on warm days (ⱖ20°C), significant positive associations were found between levels of PM10, NO2, SO2, CO, and O3and both primary intracerebral hemorrhage and ischemic stroke admissions. On cool days (⬍20°C), only CO levels and ischemic stroke admissions were significantly associated. For the 2-pollutant models, PM10and NO2remained consistently and significantly associated with admissions for both types of stroke on warm days. We observed estimated relative risks of 1.54 (95% confidence interval [95%], 1.31 to 1.81) and 1.56 (95% CI, 1.32 to 1.84) for primary intracerebral hemorrhage for each interquartile range increase in PM10and NO2. The values for ischemic stroke were 1.46 (95% CI, 1.32 to 1.61) and 1.55 (95% CI, 1.40 to 1.71), respectively. The effects of CO, SO2, and O3were mostly nonsignificant when either NO2or PM10was controlled for.
Conclusions—This study provides an association between exposure to air pollution and hospital admissions for stroke.
(Stroke. 2003;34:2612-2616.)
Key Words: air pollution 䡲 crossover studies 䡲 patient admissions 䡲 stroke
I
n the last decade, many studies have applied time-series methods to look for associations between air pollution and daily mortality.1,2 However, most studies have been con-ducted in North American and European cities, with only a few done in Asia.3– 6Most studies have reported associations between air pollution and daily deaths resulting from either respiratory or cardiovascular mortality.7,8If air pollution is responsible for the observed increased mortality, one would expect to see it affect hospitalization rates. However, less attention has been focused on hospital-ization compared with mortality during the past decade. Although mortality studies are still useful in cities with air pollution problems, studies on hospital admissions have become more important as the levels of air pollutants have decreased.9There is increasing interest in the use of hospital admission data in studies of short-term effects of air pollu-tion. A number of studies have reported associations between air pollution and hospital admissions for respiratory9 –17and cardiovascular ailments.9,12,16 –21
Relatively few studies have examined the association between air pollution and stroke mortality. Two studies conducted in Seoul, Korea, have shown that commonly
measured pollutants (O3, SO2, NO2, CO, PM10) are all significantly associated with stroke mortality.22,23In a study conducted in the Netherlands,24 gaseous air pollutants (O3, CO, SO2) were found to be significantly associated with stroke mortality. In Hong Kong, however, none of 4 pollut-ants (SO2, NO2, O3, PM10) studied were found to be signifi-cantly associated with stroke mortality.6
Several studies have also found associations between air pollution and stroke admissions. Significant associations were found between stroke admissions and PM1012,21 and NO2.21However, several studies have also reported a lack of association between air pollution and stroke admission.16,20,25 Taken overall, existing studies lack consistency as to the presence of effects or, where effects have been observed, the type of pollutant most responsible.
This study was undertaken to investigate the relationship between stroke admissions and the concentrations of air pollutants in Kaohsiung, Taiwan, over the 4-year period of 1997 through 2000.
Materials and Methods
Kaohsiung is situated on the southwest coast of Taiwan. It is Taiwan’s biggest commercial harbor and second largest city, with a
Received February 27, 2003; final revision received July 4, 2003; accepted July 11, 2003.
From the Institute of Medicine (S.-S.T., H.-F.C.) and Institute of Public Health (C.-Y.Y.), Kaohsiung Medical University, Kaohsiung, Taiwan, and Department of Mathematics, Hong Kong Baptist University, Kowloon Tong, Hong Kong (W.B.G.).
Correspondence to Chun-Yuh Yang, PhD, MPH, Institute of Public Health, Kaohsiung Medical University, 100 Shih-Chuan 1st Rd, Kaohsiung, Taiwan 80708. E-mail [email protected]
© 2003 American Heart Association, Inc.
Stroke is available at http://www.strokeaha.org DOI: 10.1161/01.STR.0000095564.33543.64
population of⬇1.46 million. It is the chief center of Taiwan’s heavy industry, including China Steel Corp, China Shipbuilding Corp, and the petrochemical industry.
The National Health Insurance Program, which provides compul-sory universal health insurance, was implemented in Taiwan on March 1, 1995, and covers most of the population (coverage was 96.16% in 2000).26Computerized records of daily clinic visits or
hospital admissions are available for each contracted medical insti-tution. All medical institutions must submit standard claim docu-ments for medical expenses on a computerized form that includes the dates of admission and discharge, identification number, sex, birth-day, and diagnostic code of each admission from the International
Classification of Diseases, 9th revision (ICD-9). We abstracted data
on the number of daily admissions for cases in which the principal diagnosis was cerebrovascular diseases (ICD-9 codes 430 to 438) from the medical insurance file. For this report, stroke subtypes were categorized as subarachnoid hemorrhagic stroke (SHS; ICD-9 code 430), primary intracerebral hemorrhage (PIH; ICD-9 codes 431 to 432), ischemic stroke (IS; ICD-9 codes 433 to 435), and others (ICD-9 codes 436 to 438). Information regarding how the stroke subtypes were categorized was not available. However, the classifi-cation of stroke types appears to be sufficiently accurate for use in epidemiological studies because CT and/or MRI are performed in almost all stroke patients.27,28
Six air-quality monitoring stations were established in Kaohsiung by the Environmental Protection Administration. The monitoring stations are fully automated and provide readings of SO2, PM10, NO2,
CO, and O3. For each day, air pollution data were extracted for all of
the monitoring stations and averaged. When data were missing for a particular monitoring station on a given day, the values from the remaining monitors were used to compute the average. Daily information on mean temperature and mean humidity was provided by the Central Weather Bureau from a station located on the coastline of Kaohsiung Harbor.
Data were analyzed with the case-crossover technique.29,30 This
design is an alternative to time-series regression models for studying the short-term effects of air pollution.31 In general, the
case-crossover design and the time-series approach have produced almost identical results.32,33
The number of stroke admissions varied significantly according to the day of the week (data not shown). This day-of-the-week effect was controlled for by comparing air pollution levels on the dates of hospital admissions with air pollution levels 1 week before and 1 week after the date of admission.34 Results of previous studies
indicated that the increased mortality or hospital admissions were associated with high air pollution levels on the same day or the previous 2 days.35 Longer lag times have rarely been described.
Thus, we used the cumulative lag up to 2 previous days. The associations between hospital admissions and levels of air pollutants
were estimated by use of odds ratios (ORs) and their 95% confidence intervals (CIs), which were produced through conditional logistic regression with weights equal to the number of admissions on that day. SAS software was used for statistical analysis. Exposure to air pollutants and meteorologic variables were entered into the models as continuous variables. ORs were calculated for the interquartile range (IQR; between the 25th and 75th percentiles) of each pollutant as observed during the study period.
Results
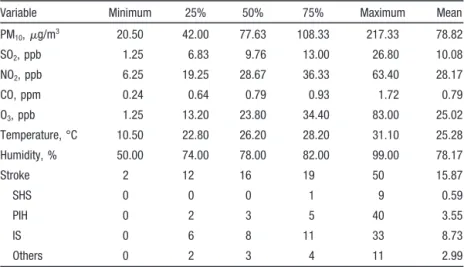
There were a total of 23 179 stroke admissions (864 for SHS, 5193 for PIH, 12 758 for IS, and 4364 for others) for the 63 hospitals in Kaohsiung. The distribution of air pollutants, meteorologic variables, and daily number of stroke admis-sions are shown in Table 1. There were an average of 16 stroke admissions. The current level of pollutants was quite low compared with Taiwan’s current standard.36
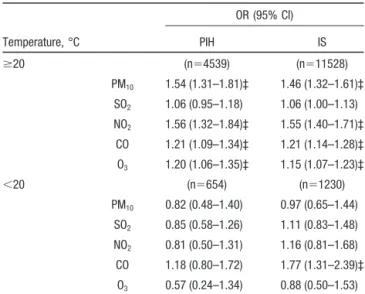
The associations between various air pollutants and stroke admissions are shown in Table 2. For the single-pollutant models, both PIH and IS admissions were significantly associated with all pollutants except SO2 on warm days. However, for cool days, only IS admissions and CO levels were significantly associated. We observed estimated ORs of 1.54 (95% CI, 1.31 to 1.81) and 1.56 (95% CI, 1.32 to 1.84) for PIH for each IQR increase in PM10 and NO2. The estimated ORs for IS were 1.46 (95% CI, 1.32 to 1.61) and 1.55 (95% CI, 1.40 to 1.71), respectively. The patterns are similar when we analyzed the data combining IS and PIH (data not shown).
Two-pollutant models were examined to obtain insight into which individual pollutants might influence stroke admis-sions independently of the effects of others. These analyses were confined to warm days. Again, SO2was not significant. We draw attention to those analyses in which the effect of a particular pollutant remained significant after each of the other 4 pollutants was included in the model. PM10and NO2 were all significant in combination with each of the other 4 pollutants. CO remained significant after the inclusion of SO2 or O3. O3remained significant after SO2or CO was included in the model (Table 3).
TABLE 1. Distribution of Daily Hospital Admission Counts, Weather, and Air Pollution Variables
Variable Minimum 25% 50% 75% Maximum Mean
PM10,g/m3 20.50 42.00 77.63 108.33 217.33 78.82 SO2, ppb 1.25 6.83 9.76 13.00 26.80 10.08 NO2, ppb 6.25 19.25 28.67 36.33 63.40 28.17 CO, ppm 0.24 0.64 0.79 0.93 1.72 0.79 O3, ppb 1.25 13.20 23.80 34.40 83.00 25.02 Temperature, °C 10.50 22.80 26.20 28.20 31.10 25.28 Humidity, % 50.00 74.00 78.00 82.00 99.00 78.17 Stroke 2 12 16 19 50 15.87 SHS 0 0 0 1 9 0.59 PIH 0 2 3 5 40 3.55 IS 0 6 8 11 33 8.73 Others 0 2 3 4 11 2.99
Discussion
This is one of the few investigations of daily stroke admis-sions reported so far and is one of the few studies on short-term effects of air pollution on mortality or hospital admissions performed in Asia. This study has shown for the first time an association between concentrations of PM10and NO2and IS and PIH admissions on warm days. The associ-ations were generally stronger for PIH admissions than for IS admissions. The reasons for stronger associations in PIH admissions are not clear, but it is notable that the range of daily stroke admissions for PIH is greater than that for IS.
The case-crossover study design offers the ability to control confounders by design rather than by modeling. This design is an adaptation of the case-control study in which each case serves as his or her own referent. Therefore, time-invariant subject-specific variables such as sex and age do not act as confounders. Also, by choosing 1 week before and 1 week after the date of stroke admission as the controls, this approach could avoid possible confounding resulting from the effects of day of the week, seasonability, or long-term trends.32–34We do not think that our findings can be attributed to the approach used because this approach is now accepted for studying the short-term effects of air pollution.32,33,37–39
For a factor to confound the relationship between air pollution and stroke admissions, it has to be correlated with both of those variables. It is unlikely that smoking and other indoor pollutants confound the present associations because day-to-day variations in indoor emissions, including smok-ing, are not correlated with outdoor air pollution.
Seasonal interactions between daily mortality or hospital admissions and air pollutants have often been reported, and various explanations have been postulated.16In the present study, we found that on cool days only IS admissions and CO levels were significantly associated. Because multiple signif-icance tests were performed, the likelihood of this finding being the result of chance is considerable. The absence of an association on cool days could be related to the relatively mild winters in Kaohsiung, where the mean monthly temper-atures from December to February ranged from 18.8°C to 22.1°C and the mean daily temperature rarely drops below 15°C. Also, there may not have been enough power to detect associations resulting from the small daily number of stroke admissions on cool days.
TABLE 2. ORs (95% CIs) of Stroke Admissions for Each IQR Increase* in Single-Pollutant Models†
Temperature, °C OR (95% CI) PIH IS ⱖ20 (n⫽4539) (n⫽11528) PM10 1.54 (1.31–1.81)‡ 1.46 (1.32–1.61)‡ SO2 1.06 (0.95–1.18) 1.06 (1.00–1.13) NO2 1.56 (1.32–1.84)‡ 1.55 (1.40–1.71)‡ CO 1.21 (1.09–1.34)‡ 1.21 (1.14–1.28)‡ O3 1.20 (1.06–1.35)‡ 1.15 (1.07–1.23)‡ ⬍20 (n⫽654) (n⫽1230) PM10 0.82 (0.48–1.40) 0.97 (0.65–1.44) SO2 0.85 (0.58–1.26) 1.11 (0.83–1.48) NO2 0.81 (0.50–1.31) 1.16 (0.81–1.68) CO 1.18 (0.80–1.72) 1.77 (1.31–2.39)‡ O3 0.57 (0.24–1.34) 0.88 (0.50–1.53)
*An IQR increase in PM10(66.33g/m3), SO2(6.17 ppb), NO2(17.08 ppb),
CO (0.29 ppm), and O3(21.20 ppb).
†Adjusted for temperature and humidity. ‡P⬍0.01.
TABLE 3. ORs (95% CIs)* of Stroke Admissions for Each IQR Change† in 2-Pollutant Models
OR (95% CI)
Adjusted for PM10 Adjusted for SO2 Adjusted for NO2 Adjusted for CO Adjusted for O3
PM10 PIH 䡠 䡠 䡠 1.55 (1.31–1.83)§ 1.28 (1.01–1.61)§ 1.45 (1.20–1.74)§ 1.56 (1.27–1.91)§ IS 䡠 䡠 䡠 1.46 (1.32–1.61)§ 1.16 (1.01–1.34)§ 1.35 (1.21–1.51)§ 1.51 (1.34–1.71)§ SO2 PIH 0.99 (0.88–1.11) 䡠 䡠 䡠 0.91 (0.80–1.03) 0.94 (0.83–1.06) 1.08 (0.96–1.20) IS 1.01 (0.95–1.08) 䡠 䡠 䡠 0.93 (0.87–1.00) 0.94 (0.88–1.02) 1.08 (1.01–1.15)§ NO2 PIH 1.31 (1.03–1.66)‡ 1.66 (1.38–2.00)§ 䡠 䡠 䡠 1.60 (1.25–2.05)§ 1.51 (1.26–1.80)§ IS 1.39 (1.20–1.60)§ 1.62 (1.45–1.81)§ 䡠 䡠 䡠 1.54 (1.33–1.79)§ 1.53 (1.37–1.71)§ CO PIH 1.08 (0.97–1.22) 1.25 (1.11–1.40)§ 0.98 (0.84–1.14) 䡠 䡠 䡠 1.19 (1.08–1.32)§ IS 1.11 (1.04–1.19)§ 1.24 (1.16–1.33)§ 1.00 (0.92–1.09) 䡠 䡠 䡠 1.19 (1.12–1.26)§ O3 PIH 0.98 (0.85–1.14) 1.21 (1.07–1.36)§ 1.07 (0.94–1.22) 1.17 (1.03–1.32)‡ 䡠 䡠 䡠 IS 0.96 (0.88–1.05) 1.16 (1.08–1.24)§ 1.02 (0.94–1.10) 1.12 (1.04–1.20)§ 䡠 䡠 䡠 *Adjusted for temperature and humidity.
†An IQR increase in PM10(66.33g/m3), SO2(6.17 ppb), NO2(17.08 ppb), CO (0.29 ppm), and O3(21.20 ppb).
There is now strong consensus that a significant associa-tion exists between mortality and PM10levels. Lipfert,40in a review of several studies on hospital admissions, suggests a consistent association between hospital admissions for respi-ratory conditions and PM10. The impact of PM10 on admis-sions for stroke is less well documented.12,16,20,21,25We found evidence of an association between PM10 and stroke admis-sions that is in agreement with the findings of Ponka and Virtanen21 and Wordley et al.12Our results further suggest that increased stroke admissions are associated with NO2 levels and not merely with PM10 levels, which are highly correlated with NO2concentrations. This finding is in agree-ment with that of Ponka and Virtanen.21The importance of NO2as a cause of increased mortality or hospital admissions is not sufficiently understood. However, we cannot rule out the possibility that NO2 was acting, at least in part, as a surrogate for some other unmeasured end products of reaction sequences initiated by NO2.
In most recent studies, particles have been indicated to have a possible causal effect on cardiovascular mortality. Several potential mechanisms have been proposed. It has been hypothesized that exposure to particles could provoke alveolar inflammation, causing exacerbations of existing lung disease and increased blood coagulation.41 It has also been suggested that elevated levels of particulates are associated with increased plasma viscosity,42increased risks of raised heart rate,43and changes in heart rate variability.44In addi-tion, studies have reported an association between plasma fibrinogen and both particles and NO2.45,46 These findings suggest hemodynamic disturbances that may lead to an increased risk of cardiovascular events and an increased risk of other types of circulatory events such as stroke.22Exposure to high temperatures has also been found to increase plasma viscosity and serum cholesterol levels.47,48During the onset of heat stroke in experimental animals exposed to very high temperatures, increased intracranial hypertension and cere-bral ischemia have been reported.48It is not clear whether these conditions might explain the increased risk of stroke admissions found in this study on hot days.
Our study has several limitations. First, there is potential for selection bias because we were unable to include clini-cally unrecognized stroke cases or cases treated at home. Second, we assigned air pollutant levels from fixed outdoor monitoring stations to individuals to estimate their exposure. Measurement errors resulting from the differences between the population-average exposure and ambient levels cannot be avoided. However, this kind of measurement error is of the Berkson type and is known to cause a bias toward the null and an underestimate of the association.35,49Third, data on influ-enza epidemics were not available and could not be con-trolled for in this study. The present work, however, focused on determining whether daily air pollution fluctuation is associated with stroke admissions. Influenza epidemics can produce respiratory diseases, but the presence of influenza epidemics may not promote stroke epidemics. We therefore think that influenza epidemics are unlikely to be a true confounder. Fourth, this study was conducted in a tropical city, and this fact may restrict somewhat the generalizability of these findings to other locations with different
meteoro-logical characteristics. Fifth, findings may have been influ-enced by the “seasonally” stratified analyses. A potential disadvantage is the loss of statistical power.
A major argument in favor of causality is the consistency of results obtained from a wide variety of cities throughout the world. Our work provides evidence that the associations found in other countries are present in a city in Taiwan, even under different climatic conditions. The possibility that this consistency results from publication bias cannot be excluded. In summary, this study provides an association between exposure to air pollution and hospital admissions for stroke. PM10and NO2seem to be the most important pollutants, and the effects appear to be stronger on warm days. The ecolog-ical design of the study precludes the inference of cause and effect. However, these findings support the possibility that there are acute pathogenetic processes in the cerebrovascular system that are induced by air pollution.
Acknowledgment
This study was supported in part by a grant from the National Science Council, Executive Yuan, Taiwan (NSC-90–2320-B-037–037).
References
1. Dockery D, Pope C. Acute respiratory effects of particulate pollution.
Annu Rev Public Health. 1994;15:107–132.
2. Holgate ST, Samet JM, Koren HS, Maynard RL. Air Pollution and
Health. San Diego, Calif: Academic Press; 1999.
3. Xu X, Gao J, Dockery DW, Chen Y. Air pollution and daily mortality in residential areas of Beijing, China. Arch Environ Health. 1994;49: 216 –222.
4. Hong YC, Leem JH, Ha EH, Christiani DC. PM10exposure, gaseous
pollutants, and daily mortality in Inchon, South Korea. Environ Health
Perspect. 1999;107:873– 878.
5. Lee JT, Shin D, Chung Y. Air pollution and daily mortality in Seoul and Ulsan, Korea. Environ Health Perspect. 1999;107:149 –154.
6. Wong TW, Tam WS, Yu TS, Wong AHS. Associations between daily mortalities from respiratory and cardiovascular diseases and air pollution in Hong Kong, China. Occup Environ Med. 2002;59:30 –35.
7. Schwartz J. What are people dying of on high air pollution days? Environ
Res. 1994;64:26 –35.
8. Zmirou D, Schwartz J, Saez M, Zanobetti A, Wojtyniak B, Touloumi G, Spix C, Leon AP, Moullec YL, Bacharova L, et al. Time-series analysis of air pollution and cause specific mortality. Epidemiology. 1998;9: 495–503.
9. Pantazopoulou A, Katsouyanni K, Kourea-Kremastinou J, Trichopoulos D. Short-term effects of air pollution on hospital emergency outpatient visits and admissions in the greater Athens, Greece area. Environ Res. 1995;69:31–36.
10. Schwartz J. Air pollution and hospital admissions for respiratory disease.
Epidemiology. 1996;7:20 –28.
11. Sunyer J, Spix C, Quenel P, Ponce-de-Leon A, Ponka A, Barumandzadeh T, Touloumi G, Bacharova L, Wojtyniak B, Vonk J, et al. Urban air pollution and emergency admissions for asthma in four European cities: the APHEA Project. Thorax. 1997;52:760 –765.
12. Wordley J, Walters S, Ayres JG. Short term variations in hospital admissions and mortality and particulate air pollution. Occup Environ
Med. 1997;54:108 –116.
13. Delfino RJ, Murphy-Moulton AM, Burnett RT, Brook JR, Becklake MR. Effects of air pollution on emergency room visits for respiratory illness in Montreal, Quebec. Am J Respir Crit Care Med. 1997;155:568 –576. 14. Spix C, Anderson HR, Schwartz J, Vigotti MA, Letertre A, Vonk JM,
Touloumi G, Balducci F, Piekarski T, Bacharova L, et al. Short-term effects of air pollution on hospital admissions of respiratory diseases in Europe: a quantitative summary of APHEA study results. Arch Environ
Health. 1998;53:54 – 64.
15. Anderson HR, Ponce-de-Leon A, Bland JM, Bower JS, Emberlin J, Strachan DP. Air pollution, pollens, and daily admissions for asthma in London 1987–1992. Thorax. 1998;53:842– 848.
16. Wong TW, Lau TS, Yu TS, Neller A, Wong SL, Tam W, Pang SW. Air pollution and hospital admissions for respiratory and cardiovascular diseases in Hong Kong. Occup Environ Med. 1999;56:679 – 683. 17. Zanobetti A, Schwartz J, Dockery DW. Airborne particles are a risk for
hospital admissions for heart and lung disease. Environ Health Perspect. 2000;108:1071–1077.
18. Schwartz J. Air pollution and hospital admissions for cardiovascular disease in Tucson. Epidemiology. 1997;8:371–377.
19. Schwartz J, Morris R. Air pollution and hospital admissions for cardio-vascular disease in Detroit, Michigan. Am J Epidemiol. 1995;142:23–35. 20. Tertre AL, Medina S, Samoli E, Forsberg B, Michelozzi P, Boumghar A, Vonk JM, Bellini A, Atkinson R, Ayres JG, et al. Short-term effects of particulate air pollution on cardiovascular diseases in eight European cities. J Epidemiol Community Health. 2002;56:773–779.
21. Ponka A, Virtanen M. Low-level air pollution and hospital admissions for cardiac and cerebrovascular diseases in Helsinki. Am J Public Health. 1996;86:1273–1280.
22. Hong YC, Lee JT, Kim H, Ha EH, Schwartz J, Christiani DC. Effects of air pollutants on acute stroke mortality. Environ Health Perspect. 2002; 110:187–191.
23. Hong YC, Lee JT, Kim H, Kwon HJ. Air pollution: a new risk factor in ischemic stroke mortality. Stroke. 2002;33:2165–2169.
24. Hoek G, Brunekreef B, Fischer P, van Wijnen J. The association between air pollution and heart failure, arrhythmia, embolism, thrombosis, and other cardiovascular causes of death in a time series study. Epidemiology. 2001;12:355–357.
25. Poloniecki JD, Atkinson RW, Leon AP, Anderson HR. Daily time series for cardiovascular hospital admissions and previous day’s air pollution in London, UK. Occup Environ Med. 1997;54:535–540.
26. Bureau of National Health Insurance(BNHI). National Health Insurance
Annual Statistical Report. Taipei, Taiwan: BNHI; 2001.
27. Lee TH, Hsu WC, Chen CJ, Chen ST. Etiologic study of young ischemic stroke in Taiwan. Stroke. 2002;33:1950 –1955.
28. Chang KC, Tseng MC, Weng HH, Lin YH, Liou CW, Tan TY. Prediction of length of stay of first-ever ischemic stroke. Stroke. 2002;33: 2670 –2674.
29. Maclure M. The case-crossover design: a method for studying transient effects on the risk of acute events. Am J Epidemiol. 1991;133:144 –153. 30. Marshall RJ, Jackson RT. Analysis of case-crossover designs. Stat Med.
1993;12:2333–2341.
31. Levy D, Lumley T, Sheppard L, Kaufman J, Checkoway H. Referent selection in case-crossover analyses of acute health effects of air pol-lution. Epidemiology. 2001;12:186 –192.
32. Neas LN, Schwartz J, Dockery D. A case-crossover analysis of air pollution and mortality in Philadelphia. Environ Health Perspect. 1999; 107:629 – 631.
33. Lee JT, Schwartz J. Reanalysis of the effects of air pollution on daily mortality in Seoul, Korea: a case-crossover design. Environ Health
Perspect. 1999;107:633– 636.
34. Bateson TF, Schwartz J. Control for seasonal variation and time trend in case-crossover studies of acute effects of environmental exposures.
Epi-demiology. 1999;10:539 –544.
35. Katsouyanni K, Touloumi G, Spix C, Schwartz J, Balducci F, Medina S, Rossi G, Wojtyniak B, Sunyer J, Bacharova L, et al. Short term effects of ambient sulphur dioxide and particulate matter on mortality in 12 European cities: results from time series data from the APHEA project.
BMJ. 1997;314:1658 –1663.
36. Air Quality Monitoring Report. Taipei, Taiwan: Environmental Pro-tection Administration; 2001.
37. Sunyer J, Schwartz J, Tobias A, Macfarlane D, Garcia J, Auto JM. Patients with chronic obstructive pulmonary disease are at increased risk of death associated with urban particle air pollution: a case-crossover analysis. Am J Epidemiol. 2000;151:50 –56.
38. Kwon HJ, Cho SH, Nyberg F, Pershagen G. Effects of ambient air pollution on daily mortality in a cohort of patients with congestive heart failure. Epidemiology. 2001;12:413– 419.
39. Levy D, Sheppard L, Checkoway H, Kaufman J, Lumley T, Koenig J, Siscovick D. A case-crossover analysis of particulate matter air pollution and out-of-hospital primary cardiac arrest. Epidemiology. 2001;12:193–199. 40. Lipfert FW. A critical review of the association between demands for
hospital services and air pollution. Environ Health Perspect. 1993; 101(suppl 2):229 –268.
41. Seaton A, MacNee W, Donaldson K, Godden D. Particulate air pollution and acute health effects. Lancet. 1995;345:176 –178.
42. Peters A, Doring A, Wichmann HE, Koenig W. Increased plasma vis-cosity during an air pollution episode: a link to mortality? Lancet. 1997; 349:1582–1587.
43. Peters A, Perz S, Doring A, Stieber J, Koenig W, Wichmann HE. Increases in heart rate during an air pollution episode. Am J Epidemiol. 1999;150:1094 –1098.
44. Gold DR, Litonjua A, Schwartz J, Lovett E, Larson A, Nearing B, Allen G, Verrier M, Cherry R, Verrier R. Ambient pollution and heart rate variability. Circulation. 2000;101:1267–1273.
45. Pekkanen J, Brunner EJ, Anderson HR, Tiittanen P, Atkinson RW. Daily concentrations of air pollution and plasma fibrinogen in London. Occup
Environ Med. 2000;57:818 – 822.
46. Schwartz J. Air pollution and blood markers of cardiovascular risk.
Environ Health Perspect. 2001;109(suppl 3):405– 409.
47. Gordon DJ, Hyde J, Trost DC, Whaley FS, Hannan PJ, Jacobs DR, Ekelund LG. Cyclic seasonal variation in plasma lipid and lipoprotein levels: the Lipid Research Clinics Coronary Primary Prevention Trial Placebo Group. J Clin Epidemiol. 1988;41:679 – 689.
48. Keatinge WR, Coleshaw SR, Easton JC, Cotter F, Mattock MB, Chelliah R. Increased platelet and red cell counts, blood viscosity, and plasma cholesterol levels during heat stress, and mortality from coronary and cerebral thrombosis. Am J Med. 1986;81:795– 800.
49. Zeger SL, Thomas D, Dominici F, Samet JM, Schwartz J, Dockery D, Cohen A. Exposure measurement error in time-series studies of air pol-lution: concepts and consequences. Environ Health Perspect. 2000;108: 419 – 426.