A visible-light response vanadium-doped
titania nanocatalyst by sol–gel method
Jeffrey C.-S. Wu
∗, Chih-Hsien Chen
Department of Chemical Engineering, National Taiwan University, No. 1, Sec. 4, Roosevelt Rd., Taipei, Taiwan 10617, ROC
Received 25 October 2003; received in revised form 17 January 2004; accepted 13 February 2004
Abstract
A series of vanadium-doped TiO2catalysts were synthesized by two modified sol–gel methods. V-doped TiO2was found to be mainly
preserved its anatase phase after calcination at 400◦C. The TEM micrographs showed the sizes of primary particles were in the range of 6–20 nm. The increase of vanadium doping promoted the particle growth, and enhanced “red-shift” in the UV-Vis absorption spectra. The XPS (X-ray photoelectron spectroscopy) could not detect vanadium indicating negligible vanadium on the surface of catalysts, furthermore, there were also no peak of vanadium oxide in the XRD patterns. XAS (X-ray absorption spectroscopy) analysis indicating V4+instead of
V5+implied that vanadium either substituted Ti4+site or embedded in the vacancy of TiO2structure. Therefore, vanadium was concluded
to be highly dispersed inside the TiO2structure. The photocatalytic activity was evaluated by the degradation of crystal violet (CV) and
methylene blue (MB) under visible light irradiation. The degradation rate of CV and MB on V-doped TiO2were higher than those of pure
TiO2. As the results, V-doped TiO2possessed better absorption ability of visible light.
© 2004 Elsevier B.V. All rights reserved.
Keywords: Titania; Vanadium doping; Visible-light photocatalyst; Sol–gel
1. Introduction
Titania is a well-known photocatalyst. Many applications using titania in photo reactions have been successfully de-veloped, such as the purification of contaminated water and
the remediation of polluted air[1]. However, most
applica-tions so far are limited to UV light irradiation because the light absorption edge of pure titania is less than 380 nm. More than 96% solar light reaches earth surface is in the range of visible light (mostly 400–600 nm) since most UV is filtered by ozone layer. Therefore, a visible-light response photocatalyst becomes a recent trend in order to take full ad-vantage of visible light. A few of visible-light photocatalysts
were reported recently. Asahi et al.[2] reported a nitrogen
doped titania possessed viable light photocatalytic activity in the photodegradation of methylene blue and acetaldehyde
and its hydrophilicity. Anpo et al.[3]used ion implantation
to dope a series of transition metal, such V, Cr and Ni into
TiO2films with band gap shifting to visible light. Zhoa et al.
[4] prepared a V/TiO2 film and found an increase doping
of vanadium resulting in further red-shift in UV-Vis spec-troscopy. A series of transition metal were incorporated in
∗Corresponding author. Tel.:+886-223631994; fax: +886-236323040.
E-mail address: [email protected] (J.C.-S. Wu).
TiO2and tested by photoreaction under visible light by Choi
et al.[5]. Klosek and Raffrey[6]deposited V on a TiO2film
with dip coating technique, and obtained a monolayer vana-dium, which was active using visible light (396–450 nm). In summary, vanadium doping provides a promising strategy to improve the photoactivity of titania under visible light.
The sol–gel process is one of the versatile methods to prepare nano-size materials. This technique does not require complicated instruments such as chemical vapor deposi-tion. It provides a simple and easy means of synthesizing nano-size particles, which is essential for nano catalysts. The incorporation of an active metal in the sol during the gelation stage allows the metal to have a direct interaction with support, therefore the material posses special catalytic properties. One of the most promising photocatalysts for
CO2 photoreduction was supported copper titania which
was previously synthesized using sol–gel method in our lab
[7]. Although titania catalysts have been extensively
stud-ied, the procedure of preparing photocatalytic metal-doped titania are still of great interesting.
The research is aimed to develop a visible-light response catalyst via vanadium doping. The objective is to prepare
a uniformly and highly dispersed state of the V4+
incorpo-rated titania photocatalyst so that its electronic properties is
modified, enabling the absorption of visible light[8].
1010-6030/$ – see front matter © 2004 Elsevier B.V. All rights reserved. doi:10.1016/j.jphotochem.2004.02.007
2. Experimental
2.1. Preparation of catalysts
Two methods were used to dope vanadium in TiO2
cat-alyst.Fig. 1illustrates the first modified sol–gel procedure.
Vanadyl acetylacetonate was completely dissolved in the
n-butanol solution. Acetic acid was mixed in titanium
bu-toxide. The molar ratio of titanium butoxide, acetic acid and
n-butanol was 1:4:4. The atomic ratio of vanadium was
cal-culated based on the desired V/Ti ratio and added in butanol. Then, the above two solution were mixed and hydrolyzed by the water generated via the esterification of acetic and butanol. The hydrolysis was completed after 24 h, then the
solution was dried at 150◦C and pulverized to powder. The
dried gel was then calcined at 400◦C for 30 min. The
cata-lysts prepared by this procedure were assigned V/TiO2-NE.
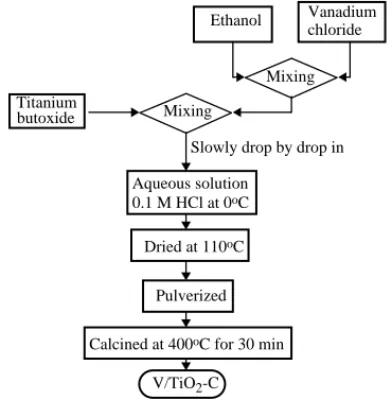
The second method was carried in a cooled acidic aqueous
solution shown inFig. 2. Vanadium chloride was dissolved
completely in ethanol, then mixed into titanium butoxide. The volume of ethanol was 10 times of ethanol/titanium butoxide solution. The amount of vanadium was calculated based on the desired V/Ti ratio. The mixed solution was slowly drop-by-drop added in a 0.1 M HCl solution, which volume was 10 times of ethanol/titanium butoxide solution, and quickly hydrolyzed due to large amount of water.
Dur-ing this process, the solution was kept cooled at near 0◦C in
a bath by circulating chilled water. The solution was dried
at 110◦C, then following the same procedure of the first
method. The catalysts prepared by this procedure were
as-signed V/TiO2-C.
2.2. Characterization
The specific surface area of the V/TiO2catalyst was
mea-sured by N2adsorption using a Micrometrics ASAP 2010. A
diffuse reflectance UV-Vis Spectrophotometer (HITACHI, Titanium
butoxide Acetic Acid n-Butanol
Mixing Hydrolyzed 24 hr Dried at 150oC
Pulverized Calcined at 400oC for 30 min
V/TiO2-NE
Vanadyl acetylacetonate Mixing
Mixing
Fig. 1. Procedure of catalysts by non aqueous sol–gel, V/TiO2-NE.
Titanium butoxide Ethanol Mixing Dried at 110oC Pulverized Calcined at 400oC for 30 min
V/TiO2-C Vanadium chloride Mixing Aqueous solution 0.1 M HCl at 0oC
Slowly drop by drop in
Fig. 2. Procedure of catalyst by cooled water hydrolysis, V/TiO2-C.
U3410) was employed to obtain the UV-Vis absorption spec-tra. The crystalline phase was identified by X-ray diffrac-tometry (XRD) on a MAC (model M03XHF, Material Anal-ysis and Characterization, Japan). X-ray photoelectron spec-troscopy (XPS) was performed using VG Microtech MT500, operated with a constant pass energy of 50 eV and with Mg K␣ radiation as the excitation source (hν = 1253.6 eV). The catalyst was pressed into a pellet, and then adhered on a
sam-ple holder by carbon tape. Oxygen (1s, 530.7 eV for TiO2)
and carbon (1s, 284.5 eV) were taken as internal standards for binding energy calibration. A transmission electron mi-croscope (TEM), Hitachi H-7100, was applied to observe the morphology of catalysts and estimate the particle size.
The X-ray absorption spectra (XAS) of the V and Ti K-edge for the catalysts were measured at the Wiggler 17C station of the Taiwan Synchrotron Radiation Center in Hsinchu Science-based Industrial Park. Fluorescence mode was used to measure vanadium in titania catalysts. The powder sample was pressed in a sample holder positioned
at 45◦to the incident X-ray beam in a sample box. The
flu-orescent X-rays from the sample passed through a Ti-filter and reached the detector. The filter was used to avoid the interference from other atoms or incident X-rays. The mea-surement of titanium was in transition mode directly. The X-ray photon energy varied across and beyond the absorp-tion edge of the measured atom. For vanadium, it was in the range from 200 eV below the vanadium absorption edge at 5465 to 800 eV above it. The intensities of both fluorescent
(If) and incident (Io) X-rays were measured to calculate the
absorption coefficient (µ) for the atoms of interest using
the equation, µx = Io/If, where x is the thickness of the
sample. Spectral analysis followed the standard steps of background correction and normalization before the near edge absorption structure was determined. Moreover, the
spectra of pure V2O4and V2O5powder were measured as
A B C D
E
F G
Fig. 3. Schematic of visible-light photo reaction system: (A) light; (B) IR filter (water); (C) UV filters; (D) Pyrex reactor; (E) magnetic rod; (F) stirrer; (G) light channel.
2.3. Photo degradation of crystal violet and methylene blue
The experiment of the CV or MB photo degradation
was carried out in a visible-light Pyrex reactor. Fig. 3
de-picts the visible-light photo reactor. The light source was a Philips CDM-R lamp with power 73 W and illumination
4850 lm. The IR (>700 nm) and UV (<400 nm) lights were
filtered by a water bottle and UV filters, respectively. A background of MB or CV degradation was carried under irradiation without catalyst first. The photocatalytic degra-dation rate was calculated by subtracting the background rate.
A weight 0.05 g of catalyst powder was suspended in ei-ther crystal violet (CV) or methylene blue (MB) aqueous
so-lution. The concentration of CV was 1.3×10⁻⁵M prepared
Fig. 4.Fig. 4(a) and (b)display the TEM micrographs: (a) 0.02-V/TiO2-C; (b) 0.015-V/TiO2-NE catalysts.
by dissolving 0.01 g in 350 ml de-ionized water. The amount of MB, 0.0037 g, was dissolved in 350 ml de-ionized water
forming a 2.8 × 10⁻⁵M solution. The solution was stirred
and reached adsorption equilibrium with catalyst before a lamp was turned on to start the photo reaction. An UV-Vis spectrometer (Shimadzu, UV-210A) monitored the concen-tration changes of CV and MB using wavelength 590.5 and 661.0 nm, respectively. A linear calibration of absorption vs. concentration was obtained either CV or MB.
3. Results and discussion
3.1. Characteristics of catalysts
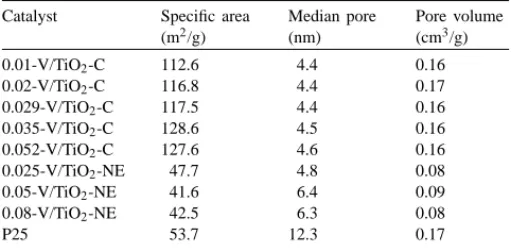
Table 1summaries the specific surface area, mean pore size and pore volume of the catalysts and Degussa P25
titania. The V/TiO2-C series gave specific surface area
over 110 m2/g, while those of V/TiO2-NE ranged from
37 to 47 m2/g. The pore sizes were in the meso pore
re-gion. Fig. 4(a) and (b) displays the TEM micrographs
of V/TiO2-C and V/TiO2-NE, respectively, The particle
sizes of V/TiO2-C ranged from 6 to 8 nm, while those of
V/TiO2-NE were around 20 nm.
Fig. 5(A) and (B)show the XRD patterns of V/TiO2-C
and V/TiO2-NE, respectively, indicating all anatase phases.
All catalysts were stable in anatase using our preparation
method, even after calcined temperature up to 700◦C. No
Table 1
Specific area, median pore size and pore volume of V/TiO2 catalysts
Catalyst Specific area (m2/g) Median pore (nm) Pore volume (cm3/g) 0.01-V/TiO2-C 112.6 4.4 0.16 0.02-V/TiO2-C 116.8 4.4 0.17 0.029-V/TiO2-C 117.5 4.4 0.16 0.035-V/TiO2-C 128.6 4.5 0.16 0.052-V/TiO2-C 127.6 4.6 0.16 0.025-V/TiO2-NE 47.7 4.8 0.08 0.05-V/TiO2-NE 41.6 6.4 0.09 0.08-V/TiO2-NE 42.5 6.3 0.08 P25 53.7 12.3 0.17
were found in the XRD patterns implying either vanadium
was incorporated in the crystalline of TiO2, or vanadium
oxide was very small and highly dispersed. The crystallite sizes estimated from peak broadening were consistent with
the observation in TEM micrographs (Fig. 4). The crystallite
size increased with increasing vanadium loading on both
V/TiO2catalysts.
Fig. 6(A) and (B) show the UV-Vis absorption
spec-tra of V/TiO2-C and V/TiO2-NE, respectively. The
spec-trum of pure TiO2, which was prepared by our method, is
shown in Fig. 6(B)and is similar to that of Degussa P25
inFig. 6(A). Compared with the spectrum of pure titania,
the red-shift was clearly observed in the series of V/TiO2-C
and V/TiO2-NE catalysts. The higher the vanadium doping,
the greater red-shift was. The UV-Vis spectrum of V2O5
also displays inFig. 7(a)for comparison. The tailing of
ab-sorption curves reveal that V/TiO2absorb the photon energy
in the range of 380–750 nm, and is different from that of
pure V2O5(near 500 nm). The band gaps of catalysts are in
the range of 3.2∼2.8 eV. The 3d orbital of vanadium might
change the band gap of titania so that V/TiO2catalysts
en-able to absorb visible light.
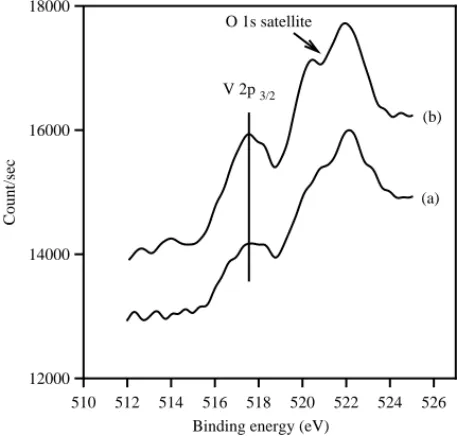
The chemical status of vanadium was evaluated by XPS
as shown inFig. 7. Both V/TiO2-C and V/TiO2-NE gave the
similar spectra. The signal of characteristic peaks of vana-dium was very weak. The magnitude was so small that was comparable with the oxygen satellite peak. The binding
en-ergy of vanadium was near 517.3 eV indicating V5+species
[9]. However, a shoulder of the peak at 516.1 eV suggested
V4+species, too. XPS can only measure the elements on the
most outer surface. Only very few vanadium was on the
sur-face of the TiO2particles indicating most vanadium located
inside TiO2.
Fig. 8(A) and (B) show the X-ray adsorption near
edge structure (XANES) of vanadium in V/TiO2-C and
V/TiO2-NE, respectively. The XANES of titanium in
V/TiO2was found the same as that in pure anatase TiO2, but
significantly different from that in pure rutile TiO2. Such
re-sult of anatase phase was consistent with the XRD pattern.
The XANES of pure V2O4 and V2O5 were also measured
and depicted inFig. 8for the comparison of either V4+ or
V5+. An absorption pre-edge at 5470 eV was observed in
10 20 30 40 50 60 70 (a) (b) (c) (d) (e) (101) Intensity θ 2 10 20 30 40 50 60 70 (a) (b) (c) (d) 2θ (101) Intensity (A) (B)
Fig. 5. (A) XRD patterns of V/TiO2-C catalysts calcined 400◦C: (a)
V/Ti = 0.01, (b) V/Ti = 0.02, (c) V/Ti = 0.029, (d) V/Ti = 0.035, (e) V/Ti = 0.052; (B) XRD patterns of V/TiO2-NE catalysts calcined at 400◦C: (a) V/Ti= 0.015, (b) V/Ti = 0.025, (c) V/Ti = 0.05, (d) V/Ti= 0.08.
either V2O4 or V2O5. The shape of absorption pre-edge
from V/TiO2-C and V/TiO2-NE is symmetric and closed
to that of V2O5. Three post-edge absorption peaks, 5486,
5494 and 5506 eV can be found in V2O5. The post-edge
absorption peaks of V2O4are located near 5482, 5489 and
5502 eV, although they are not sharp. The XANES’s of
V/TiO2-C and V/TiO2-NE are all similar, and show two
post-edge absorption peaks at 5488 and 5501 eV. Those two
peaks may be composed of those peaks of V2O5and V2O4.
Therefore, the chemical status of vanadium in V/TiO2-C
and V/TiO2-NE co-existed both V4+and V5+. The
chem-ical status is an important evidence to deduce whether
200 300 400 500 600 700 800 -0.5 0.0 0.5 1.0 1.5 2.0 2.5 3.0 (g) (e) (f) (d) (c) (b) (a) K-M absorptio n Wavelength (nm) 200 300 400 500 600 700 800 0 2 4 6 8 K-M absorptio n (e) (d) (c) (b) (a) Wavelength (nm) (A) (B)
Fig. 6. (A) UV-Vis absorption spectra of V/TiO2-C: (a) P25, (b)
V/Ti= 0.01, (c) V/Ti = 0.02, (d) V/Ti = 0.029, (e) V/Ti = 0.035, (f) V/Ti= 0.052, (g) V2O5; (B) UV-Vis absorption spectra of V/TiO2-NE:
(a) TiO2-NE, (b) V/Ti= 0.015, (c) V/Ti = 0.025, (d) V/Ti = 0.05, (e)
V/Ti= 0.08.
is possible in the octahedral lattice of TiO2, while V5+may
be V2O5highly dispersed within crystalline of TiO2.
3.2. Photocatalytic activity
The photocatalytic activity of V/TiO2catalyst was tested
by the de-colorization of CV and MB solutions. A CV molecule can be degraded into aryl compounds representing
the photo oxidation activity [10]. A cationic form of MB
can be reduced and changed blue to colorless by accepting
an electron representing the photo reduction activity [11].
Table 2 lists the photo degradation rates of V/TiO2-C and
510 512 514 516 518 520 522 524 526 12000 14000 16000 18000 V 2p 3/2 O 1s satellite (b) (a) Count/sec
Binding energy (eV)
Fig. 7. XPS of vanadium 2p3/2 spectra of V/TiO2-C: (a) V/Ti= 0.035,
(b) V/Ti= 0.052.
V/TiO2-NE irradiated under visible light at ambient
tem-perature. The rate was calculated based on a 6-h irradia-tion, and was found zeroth order at the experimental
con-ditions. The catalyst, 0.035 V/TiO2-C, showed the highest
rates 3.07 × 10⁻⁷and 3.87 × 10⁻⁷mol/l h of CV and MB,
respectively. The maximum photo reaction rates of CV and
MB were 3.61 × 10⁻⁷ and 3.71 × 10⁻⁷mol/l h,
respec-tively, on 0.05 V/TiO2-NE. The pure TiO2 was expected to
be no photo activity but showed perceivable photo reac-tion rates because of a little porreac-tion of residue UV entering
photo reactor.Table 3lists the photon intensity of original
light source and after IR and UV filters indicating a small port of UV-A and UV-C can enter the photo reactor. Af-ter UV portion was filAf-tered, the photon intensity of UV-A
and UV-C were reduced to only 1.0 and 10.6W/cm2,
re-spectively, compared with near 40,000W/cm2 of visible
light.
Table 2
Photo degradation rates of crystal violet (CV) and methyl blue (MB) with initial concentration, 1.3 × 10⁻⁵ and 2.8 × 10⁻⁵M, respectively, under visible-light irradiation Catalyst CV rate (10−7mol/l h) MB rate (10−7mol/l h) TiO2-C 1.73 2.02 0.01-V/TiO2-C 0.67 2.70 0.02-V/TiO2-C 1.30 3.90 0.029-V/TiO2-C 2.55 3.12 0.035-V/TiO2-C 3.07 3.87 0.052-V/TiO2-C 2.21 3.62 TiO2-NE 2.44 3.01 0.015-TiO2-NE 2.44 3.17 0.025-TiO2-NE 2.12 3.67 0.05-TiO2-NE 3.61 3.71 0.08-TiO2-NE 2.26 3.18
5.44 5.46 5.48 5.50 5.52 5.54 5.56 5.58 5.60 Normalized intensity Energy (KeV) (e) (d) (c) (b) (a) 5.44 5.46 5.48 5.50 5.52 5.54 5.56 5.58 5.60 Normalized intensity Energy (KeV) (e) (d) (c) (b) (a) (A) (B)
Fig. 8. (A) Vanadium XANES of V/TiO2-C: (a) V2O5, (b) V/Ti= 0.029,
(c) V/Ti= 0.035, (d) V/Ti = 0.052, (e) V2O4; (B) vanadium XANES
of V/TiO2-NE, (a) V2O5, (b) V/Ti = 0.025, (c) V/Ti = 0.05, (d)
V/Ti= 0.08, (e) V2O4.
A photo reaction is initiated by the electron and hole via the excitation of photons. The transformation of photons to electron/hole pair, i.e., quantum efficiency, is one of crucial factors in a photo reaction. The quantum efficiency of UV light is much higher than that of visible light because of its
Table 3
The filtering results of UV light
UV-A (W/cm2)a 365 nm UV-C (W/cm2)a 254 nm Original light 1023.5 18.1 IR and UV filtered 1.0 10.6
aMeasured by a Lumen meter with specific wavelength at 365 or
254 nm.
high photon energy. Therefore, even a small amount of UV can activate photo reaction effectively than that of visible
light. In addition, both TiO2and V/TiO2catalyst have higher
UV absorption efficiency than visible light. The absorption
of visible light on V/TiO2is higher than that on pure TiO2
as shown inFig. 6. However, the enhancement of photo
ac-tivity by visible-light is still surpassed by small amount of UV. not so drastically. That’s why only marginally
increas-ing photo activity were observed in V/TiO2catalysts under
visible-light irradiation.
4. Conclusion
The modified sol–gel methods offer successful routes to
synthesize V-doped titania catalysts. Vanadium ion in TiO2
may change the band gap between conduction and valence bands. Thus, V-doped titania acquires the capability of ab-sorbing visible light and shows a ‘red-shift’ in the UV-Vis spectra. The results of photocatalytic reaction indicate that
the V-doped TiO2 has higher activity than pure TiO2
un-der visible light irradiation. The improvement is due to the
highly dispersed vanadium in the TiO2crystallite.
Acknowledgements
The authors would like to thank the National Sci-ence Council of Taiwan, the Republic of China, for fi-nancially supporting this research under contract no. NSC-91-2214-E-002-021. Authors also thank Dr. Jyh-Fu Lee of the Wiggler 17C station of the Taiwan Synchrotron Radiation Center, and Ms. Chaoling Lai of the Surface Analysis Lab at the National Taiwan University for their effort in instrumental analysis.
References
[1] A. Fujishima, T.N. Rao, D.A. Tryk, Titanium dioxide photocatalysis, J. Photochem. Photobiol. C: Photochem. Rev. 1 (2000) 1–21. [2] R. Asahi, T. Morikawa, T. Ohwaki, K. Aoki, Y. Taga, Visible-light
photocatalysis in nitrogen-doped titanium oxides, Science 293 (2001) 269–271.
[3] M. Anpo, Y. Ichihashi, M. Takeuchi, H. Yamashita, Design of unique titanium oxide photocatalysts by an advanced metal ion-implantation method and photocatalytic reactions under visible light irradiation, Res. Chem. Intermediates 24 (42) (1998) 143–149.
[4] G. Zhao, H. Kozuka, H. Lin, T. Yoko, Sol–gel preparation of Ti1−x–VxO2 solid solution film electrodes with conspicuous
photo-response in the visible region, Thin Solid Films 339 (1999) 123–128. [5] W. Choi, A. Termin, M. Hoffmann, The role of metal ion dopants in quantum-size TiO2: correlation between photoactivity and charge
carrier recombination dynamics, J. Phys. Chem. 98 (1994) 13669– 13679.
[6] S. Klosek, D. Raffery, Visible light driven V-doped TiO2
photocatalyst and its photooxidation of ethanol, J. Phys. Chem. B 105 (2001) 2815–2819.
[7] I.-H. Tseng, W.-C. Chang, J.C.-S. Wu, Photoreduction of CO2using
sol–gel-derived titania and titania-supported copper catalysts, Appl. Catal. B: Environ. 37 (1) (2002) 37–48.
[8] M. Anpo, H. Yamashita, S. Kanai, K. Sato, T. Fujimoto, Photocatalyst, process for producing the photocatalyst, and photocatalytical reaction method, US Patent 6,077,492 (2000). [9] J.F. Moulder, W.F. Stickle, P.E. Sobol, K.D. Bomben, Handbook of
X-ray photoelectron spectroscopy, Physical Electronics, Inc., Eden Prairie, MN, USA, 1995.
[10] M. Saquib, M. Muneer, TiO2 mediated photocatalytic degradation
of a triphenylmethane dye (gentian violet) in aqueous suspensions, Dyes Pigments 56 (2003) 37–49.
[11] A.G. Cook, R.M. Tollover, J.E. Williams, The blue bottle experiment revisited, J. Chem. Educ. 71 (2) (1994) 160–161.