Evaluation
of
Binary-Coded Light-Emission-Period Schemes
for Improving the Moving Image Quality on PDP
Chern-Lin Chen, Ching-Te Tseng, Shin-Tai Lo Department of Electrical Engineering,
Kelvin Lee Acer Display Technology
National Taiwan University Hsin-Chu, Taiwan
Abstract
While a moving image is displayed on AC-PDP, disturbances of gray scales and colors may be observed. Various methods to improve the image quality are quantitatively compared. Motion image disturbance on AC-PDP has been properly simulated on a computer by using a simple eye-tracking model to simplify the relation between the moving image on AC-PDP, light emission from the PDP, and the captured image with disturbance on retina. From the simulation results, we can easily choose an effective light emission scheme to improve the moving image quality on AC-PDP.
Introduction
Plasma display panels (PDP) are expected to be one of the next generation TV displays, offering the possibility of greater than 40 inches diagonal, flat screen and thin displays. HDTV display needs 8 bit, 256 gray levels. For color PDPs , gray scales are obtained by using pulse- number-modulation within-a-field technique as shown in Fig. 1.
1 Field(16.7 ms)
Addressing period Sub-field S&t aining period
Fig.1 Pulse-number-modulation-within-a-field
This technique of gray scales expression divides each luminance field time into multiple independent sub-fields(SF) with various sustain period and expresses the specific gray level by combination of these SFs. Although this technique is quite sufficient to express still image, disturbances of gray levels and colors are often observed when displaying moving images. These are referred to as the dynamic false contours (DFCs).
As our eyeballs follow a change of the gray level from 128 to 127 of a pixel on AC-PDP, a peak error would arise on our retinas[l],and the one of the gray level from 127 to 128 would arise a peak error in the light-emission scheme. Some errors result in a brighter dot on retina and errors relatively result in a darker dot on retina.
Various methods of reducing the disturbance to increase the dynamic image quality and the comparison of them are listed in Table 1.
In large sized screens, scattering of disturbance [2], or error difision[3] may cause noise or checker-patterned side effects when motion is synchronized with the pattern. Multi- level sub-field(MLS)[4] makes the luminous be three forth of the traditional technique. Equalizing pulse[5] has little benefit with significant motion greater than 10 pixels per field, while techniques related to motion, and compression scheme[6] for AC-PDP seems to have to go the extra mile in practical application. Nowadays, to find the optimized SF order and weighting under a limited amount of SFs is more applicable to reduce false contour for us.
Some modified light-emission-schemes have been presented to effectively resolve the false contour. This paper presents the evaluation of those methods with the false contour map.
Table 1 Methods of reducing the dynamic false contour
0 Initial Gray h w l 25:
t
2. Oscillating Error 3.Peak Error
Definition of the false peakhalley
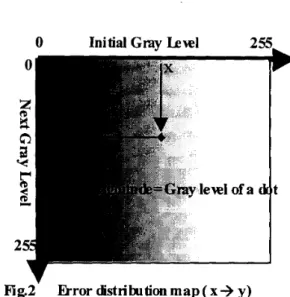
Instead of the traditional signal to noise ratio (SNR)[7], we utilize an error distribution map as shown in Fig.2 and three error indices as shown in Fig.3 to evaluate those methods. As shown in Fig.2, the x-axis value represents the initial gray level of one pixel on AC-PDP and the y-axis value represents the next one. The gray level of dots in the error distribution map represents the
magnitude of the error.
It is assumed that the false contour occurs in the transitive twilight zone between two different gray levels, as shown in Fig.3. Peak /valley error is respectively defined as the interval between the transitive maximdminimum and the larger/smaller of the initial and final gray level. There are occasions that the peak and valley errors exist in the same twilight zone. The oscillating error is defined as the absolute difference of the peak and valley error because of compensation effects. The valley error will make human eyes sense a darker dot and the peak error will make human eyes sense a brighter dot.
.
Next, we will use these error indexes to draw the error distribution map and calculate the total error.
Fig3 Error definition
Simulation of DFCs
To compare the presented light emission schemes for reducing the DFC, a simulation program is developed. Fig4 shows the flow chart of the simulation program. Simulation results are listed in Table2 and their error distribution maps are also shown in Fig. 5
I n i t i a l sequen ce
0
Set u pE r r 0 r cat cula tion
0
YesI
Is o t h e r sequence exist?I
Search f o r the m i n i m u m Search f o r the m i n i m u m(-)
Fig.4 Flow-chart of the simulation program.
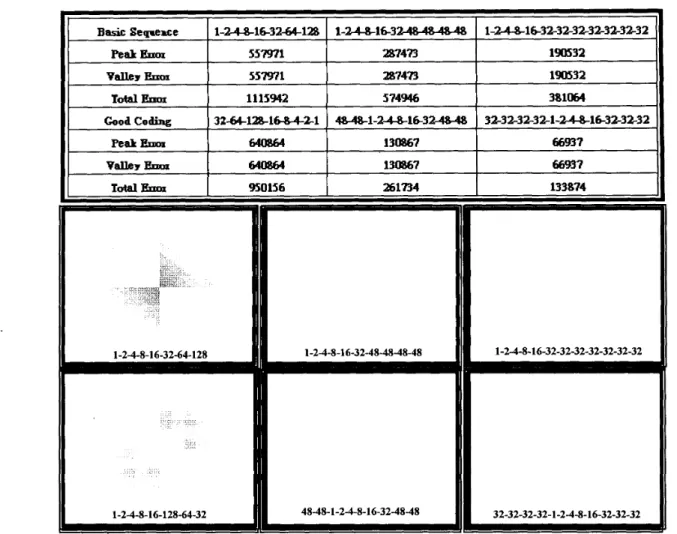
Table2 Simulating results of six different light-emission-schemes
Basic Semrce 1-243-163aWl28 l-UJ5-163aA8484g48 1-24fb163Z3Z32-32-3Z32-32
Peak Error 557971 a7473 190532
i
n
valley Error Total h Good Coding Peak Error valley Enar Total ErrorI
I1
557971 287473 190532 1115942 574946 38"3244-1~16-&42-1 48#-1-248-163;c4&48 32-32-32-321-UJ5-16-32-32-32
64x64 130867 66937
6mb4 130867 66937
950156 261734 133874
81
48-48-1-2.1-2-4-8-1 6-1 28-64-32
Fig5 Error distribution maps six kind of light-emission-schemes Analysis of simulation results
four points are observed. 1 .Mm error:
From the simulation results, the following
The maximum of peak/valley is equal to the value of MSB minus one in any sequence. So a useful method to reduce the error is to split the
MSB into some smaller ones.
2.Reverse:
The polarity of DFC reverses when the SF sequence is reversed as shown is Fig6. Different polarities will result in different visual sensitivity.
Human eyes are highly sensitive to error in darker images and less sensitive in lighter ones. The MLS technique employs this phenomenon to
reduce false contour. If DFC appears between adjoining pixels, the reverse polarity effect will cause both pixels to compensate each other.
T TT
I. Peak error of sequence :1-2-4-8-16-32-64-128 11. Peak error of sequence :128-64-32-16-8-4-2-1
Fig.6 Reverse of the polarity
3.Limitation of eficiency:
More SFs seems to be more useful to reduce false contour. But in order to keep the luminosity, the number of SF is limited to a small number. 4. Coding:
Proper coding in 10 and 12 SFs will enhance the efficiency of improvement of false contour. Table 2 shows that a better coding results in smaller total error.
Conclusion
To improve the moving image quality on AC- PDP, simulation of DFC errors is developed and different presented schemes are quantitatively compared. According to the analysis results, guidelines for designing a better light-emission scheme to reduce the DFC are acquired..
References
[ 111. Kawahara, K. Wani, “Simulation and reduction of motion picture disturbance for 42- in.-diagonal AC-PDP,” IDW ’97, pp.503-506. [2]T. Yamaguchi, K. Toda, S. Mikoshiba,
“Improvement in PDP picture quality by three-
dimensional scattering,” SID ’96 Digest,
[3]S. Mikoshiba, “PDP technology and prospect,”
PDP Workshop, pp. 12-1 3.
[4]T. Shigeta, N. Saegusa, H. Honda, T. Nagakubo, T. Akiyama, “Improvement of moving-vedio image quality
on
PDPs by reducing the dynamic false contour,” SID ‘98, pp.287- 290( 1998)[5]S. Mikoshiba. “Dynamic false contours on PDPs-false or contour? ,” IDW’96, pp25 1-254. [6]T. Koura, “Evaluation of moving-picture
quality on 42-in. PDP,” SID 98 Digest, [7]Y. Watanabe, M. Yoshida, K. Ogawa, T. Ueda, M. Tajima, “Quantitave analysis of dynamic false contours on PDPs,” SID ’97, pp.289-292 pp.29 1
-
1 94.pp620-623.