Maternal age and the likelihood of a maternal request for
cesarean delivery: A 5-year population-based study
Herng-Ching Lin, PhD,
a,* Sudha Xirasagar, MBBS, PhD
bTaipei Medical University, School of Health Care Administration, Taipei, Taiwana; Arnold School of Public Health, University of South Carolina, Columbia, SCb
Received for publication August 9, 2004; revised September 16, 2004; accepted September 28, 2004
KEY WORDS
Maternal age Maternal request Cesarean delivery
Objective: The purpose of this study was to examine associations between maternal age and maternal request cesarean deliveries.
Study design: Five-year population-based data from Taiwan (1997-2001) that covered 904,657 singleton deliveries without a clinical indication for cesarean delivery that were judged by the attending physician were subjected to multiple logistic regression, year-wise, to examine the association of maternal age with request cesarean delivery, adjusted for health care institutional characteristics.
Results: Request cesarean delivery rates steadily increased over the study period within each age group, disproportionately so among the 34C age group. Women aged !25 years were less likely than women aged 25 to 34 years (reference group) to request a cesarean delivery (odds ratio range, 0.67-0.88) and women aged 34C were more likely than the reference group to have a request cesarean delivery (odds ratio range, 1.96-2.01), adjusted for health care institutional characteristics.
Conclusion: Population-based data confirms the expectancy that request cesarean delivery propensity increases with maternal age.
Ó 2005 Elsevier Inc. All rights reserved.
Cesarean delivery rates have been a major concern of health policy makers in many developed and developing countries. For example, CSs account for 40% of all live births in Chile,1 about 36% in Brazil,1 32.3% in Taiwan,2 23.5% in the United States,3 and 22.4% in Italy.4These rates far exceed the World Health Organ-ization’s recommended rate of 15% of all deliveries.5
Many authors aver that unnecessary cesarean delivery increases maternal morbidity and death risk and contributes to unnecessary consumption of medical resources.6,7
Previous empiric studies have suggested that reduction in cesarean delivery rates is not associated with any increase in morbidity/mortality rates and therefore may be cost-effective, without entailing any loss of health benefits.8,9 Many efforts have been made to identify the factors that contribute to cesarean delivery. Research-ers have documented the role of clinical factors (previous cesarean delivery, dystocia, fetal distress, breech pre-sentation, and malpresentation) and nonclinical factors
* Reprint requests: Herng-Ching Lin, PhD, School of Health Care Administration, Taipei Medical University, 250 Wu-Hsing St., Taipei 110, Taiwan.
E-mail:[email protected]
0002-9378/$ - see front matterÓ 2005 Elsevier Inc. All rights reserved. doi:10.1016/j.ajog.2004.09.133
(socioeconomic status, race, maternal age, institutional characteristics, physician practice styles, and other char-acteristics) in cesarean delivery.10,11
In recent years, the justification for request cesarean delivery in the absence of clinical indications has been debated intensely from the clinical, ethical, and legal perspectives.12Proponents of patient choice believe that maternal choice should be paramount in the decision about the mode of delivery. With increasing advocacy for patient rights, request cesarean delivery has become more common in many countries. Irvine and Shaw13 reported that maternal request accounted for 24.9% of all elective cesarean deliveries that were performed at Watford General Hospital in the United Kingdom. In Italy, request cesarean delivery increased from 3.6% of all deliveries in 1997 to 9% in 2000 after ratification of a bill on the rights of pregnant women.14 In Norway, maternal request accounted for 7.6% of cesarean de-liveries in 1999.15According to 61.9% of obstetricians in United Kingdom’s North Thames Region, maternal request was a major factor in high cesarean delivery rates.16
Although many authors have proposed several rea-sons for women’s requests for elective cesarean de-liveries,17,18 the role of maternal sociodemographic characteristics remains unclear because of methodologic limitations.17 However, the exploration of these rela-tionships becomes increasingly important because pa-tient-driven elective cesarean delivery increases relative to physician-driven cesarean delivery. In particular, the identification of the age groups with higher propensity for a request cesarean delivery can help policy makers to better target research and policy interventions.
This study used 5-year population-based data to examine this issue, to avoid the pitfall of chance findings in any 1 year. The database, which covered every delivery in Taiwan, presents a unique opportunity to explore maternal choice of delivery mode systematically as it relates to age. Possible confounding factors such as health care institutional characteristics are also ac-counted for.
Material and methods
Data sources
This study used data on all singleton deliveries in Taiwan that were vaginal or by a cesarean delivery done at maternal request (by implication, judged by the provider as clinically suitable for vaginal delivery) between 1997 and 2001 from the National Health Insurance (NHI) Research Database. The database covers all medical benefit claims for Taiwan’s population of O20 million people who are covered with comprehensive health benefits and low co-payment rates under the govern-ment-sponsored NHI. Claims are reimbursed on the
basis of the NHI’s diagnosis-related-group (DRG) classification code recorded on each claim. Both cesarean delivery and vaginal delivery are reimbursed at fixed payment rates, regardless of length of stay or resource use. Medically necessary cesarean delivery (defined as cesarean delivery performed at the physician’s initiative) coded 0371A is reimbursed at a fixed rate, twice the rate of vaginal delivery. Cesarean delivery performed at maternal request coded 0373B is considered by the Bureau of NHI (BNHI) as medically unnecessary and is reimbursed at the same rate as vaginal delivery, the balance to be recovered by providers from the patients. In addition to the DRG payment code, each claim has 1 principal diagnosis and up to 4 secondary diagnoses, as per International Classification of Disease,(ICD-9CM) codes, 1 principal operative procedure code, and up to four secondary operative codes.
Study group: Inclusion and exclusion criteria
The study objective was to examine the role of maternal age in women’s choice of cesarean delivery in the absence of medical need, judged by the attending physician. Therefore, we selected only singleton vaginal deliveries (DRG code 0373A), and singleton cesarean delivery deliveries that were DRG-coded 0373B, implying that these cases were judged clinically eligible for vaginal delivery, but provided cesarean delivery at the mother’s request. Our study population excludes multiple gesta-tion cases and cases coded 0371A, those women who underwent cesarean delivery based on the physician’s decision to perform a cesarean delivery. The data from the latter group in the year 2000 formed the study population for an earlier study on the role of institu-tional factors in cesarean delivery and were controlled for clinical indications and comorbidities.2
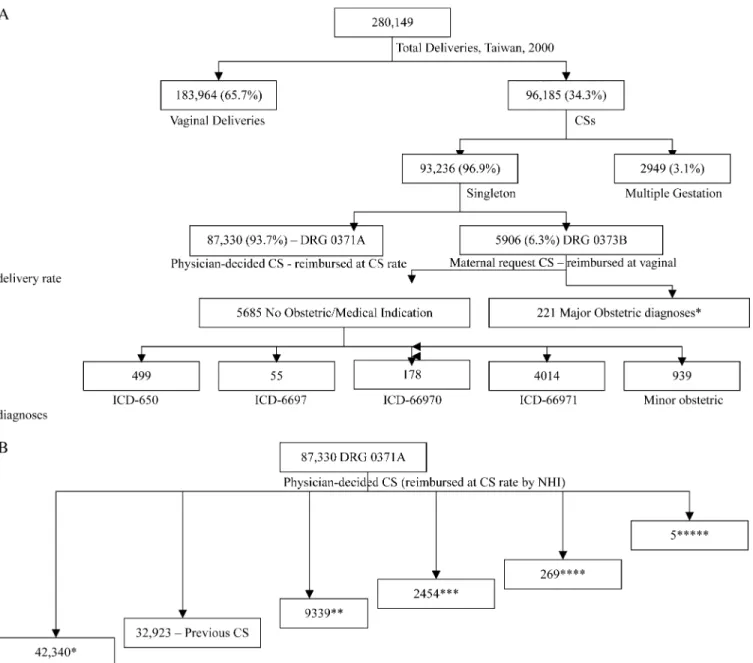
Figure 1, A, illustrates the inclusion and exclusion criteria, with data from the year 2000, and shows the clinical characteristics of included and excluded cases. (All singleton deliveries that were excluded in the present study had been included in the study population of the earlier study.2) TheAppendixshows the distribution of the 929 women in our study group with some comorbid-ity (we identify conditions that had at least 15 cases). The rest of our study population had no secondary diagnosis.
Figure 1, B, presents the clinical characteristics of the excluded singleton deliveries of the year 2000, showing that almost all delivery cases with major obstetric complications were in the group that received medically necessary cesarean delivery and therefore out of the ambit of this (maternal request cesarean delivery) study. Reimbursement at the cesarean delivery rate is a function of coding the case as medically necessary cesarean delivery (0371A), which is cross-checked by the BNHI through regular audits, with the use of a random sample of records from each hospital. Therefore, it is in
the provider’s interest to ensure documentation of any secondary diagnosis that clinically justifies cesarean delivery. The BNHI imposes high fines (100 times the reimbursement rate) and censures for undue deviations
from the admissible norms and supports a patient grievance mechanism. Patients in Taiwan are free to choose any provider; therefore, providers have every incentive to guard against negligent, fraudulent, or
Figure 1 A, Distribution of all deliveries in 2000 by clinical characteristics and delivery mode. Current study includes 183,964 (vaginal delivery cases) C 5685 (request CS without clinical indication for CS), total 189,649 cases. B, Clinical characteristics of physician-decided CS cases in 2000- CS coded DRG 0371A, reimbursed at full CS rates (study population covered in Lin and Xirasagar, 2004).
erroneous coding. We believe that our inclusion criteria that are shown inFigure 1, A, effectively selected only those women who were eligible for vaginal delivery for the study and therefore eligible for a study of maternal choice of delivery mode.
In-patient claims of all patients who were admitted to hospitals or obstetric and gynecology clinics between January 1, 1997, and December 31, 2001, for delivery were screened for DRG codes 0373B, elective cesarean delivery per maternal request, and 0373A, vaginal delivery. As illustrated in Figure, by definition, the study population excluded all those who were provided a request cesarean delivery but had a significant obstet-ric diagnosis that could have justified medically neces-sary cesarean delivery as per current state-of-art and Anderson and Lomas19hierarchy of obstetric diagnoses (previous cesarean delivery, breech presentation, dysto-cia, and fetal distress; total = 221 cases).
Descriptive, bivariate, and multiple logistic regression analyses in SAS software (SAS Institute Inc, Cary, NC) were used. Bivariate analyses were used to examine the crude associations between delivery mode versus mater-nal age, hospital level, ownership, location, and teaching status. For logistic regression analyses, the dichotomous dependent, variable, cesarean delivery at maternal
re-quest of 1, vaginal delivery of 0, was used. The independent variable of interest was maternal age classified into 3 categories: !25 years, 25 to 34 years, and O34 years.
We also controlled for health care institutional characteristics, namely, ownership (public, private for-profit, and private not-for-profit), geographic location (northern, central, southern, and eastern Taiwan), and hospital level (medical centers with O500 beds, regional hospitals with 250-499 beds, district hospitals with 20-249 beds, and obstetrics/gynecology clinics with !10 beds). All medical centers and regional hospitals are teaching hospitals, and all clinics are nonteaching institutions. A probability level of !.05 was chosen for statistical significance.
Results
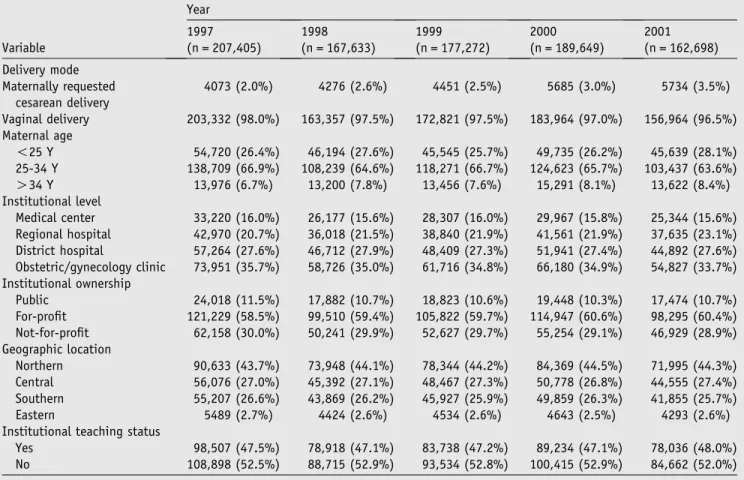
Table I shows the distribution of study subjects by age and characteristics of the health care institution and geographic location from 1997 to 2001. There is a steady upward trend of maternal request cesarean delivery rates, which increased from 2.0% in 1997 to 2.6% in 1998, 2.5% in 1999, 3.0% in 2000, and 3.5% in 2001. As
Table I Distribution of women without a clinical indication for cesarean delivery
Variable Year 1997 (n = 207,405) 1998 (n = 167,633) 1999 (n = 177,272) 2000 (n = 189,649) 2001 (n = 162,698) Delivery mode Maternally requested cesarean delivery 4073 (2.0%) 4276 (2.6%) 4451 (2.5%) 5685 (3.0%) 5734 (3.5%) Vaginal delivery 203,332 (98.0%) 163,357 (97.5%) 172,821 (97.5%) 183,964 (97.0%) 156,964 (96.5%) Maternal age !25 Y 54,720 (26.4%) 46,194 (27.6%) 45,545 (25.7%) 49,735 (26.2%) 45,639 (28.1%) 25-34 Y 138,709 (66.9%) 108,239 (64.6%) 118,271 (66.7%) 124,623 (65.7%) 103,437 (63.6%) O34 Y 13,976 (6.7%) 13,200 (7.8%) 13,456 (7.6%) 15,291 (8.1%) 13,622 (8.4%) Institutional level Medical center 33,220 (16.0%) 26,177 (15.6%) 28,307 (16.0%) 29,967 (15.8%) 25,344 (15.6%) Regional hospital 42,970 (20.7%) 36,018 (21.5%) 38,840 (21.9%) 41,561 (21.9%) 37,635 (23.1%) District hospital 57,264 (27.6%) 46,712 (27.9%) 48,409 (27.3%) 51,941 (27.4%) 44,892 (27.6%) Obstetric/gynecology clinic 73,951 (35.7%) 58,726 (35.0%) 61,716 (34.8%) 66,180 (34.9%) 54,827 (33.7%) Institutional ownership Public 24,018 (11.5%) 17,882 (10.7%) 18,823 (10.6%) 19,448 (10.3%) 17,474 (10.7%) For-profit 121,229 (58.5%) 99,510 (59.4%) 105,822 (59.7%) 114,947 (60.6%) 98,295 (60.4%) Not-for-profit 62,158 (30.0%) 50,241 (29.9%) 52,627 (29.7%) 55,254 (29.1%) 46,929 (28.9%) Geographic location Northern 90,633 (43.7%) 73,948 (44.1%) 78,344 (44.2%) 84,369 (44.5%) 71,995 (44.3%) Central 56,076 (27.0%) 45,392 (27.1%) 48,467 (27.3%) 50,778 (26.8%) 44,555 (27.4%) Southern 55,207 (26.6%) 43,869 (26.2%) 45,927 (25.9%) 49,859 (26.3%) 41,855 (25.7%) Eastern 5489 (2.7%) 4424 (2.6%) 4534 (2.6%) 4643 (2.5%) 4293 (2.6%)
Institutional teaching status
Yes 98,507 (47.5%) 78,918 (47.1%) 83,738 (47.2%) 89,234 (47.1%) 78,036 (48.0%)
expected, most women every year were in the age group of 25 to 34 years. There is an increasing proportion of women aged O34 years with time, possibly representing an underlying trend of increasing childbirth at older ages.
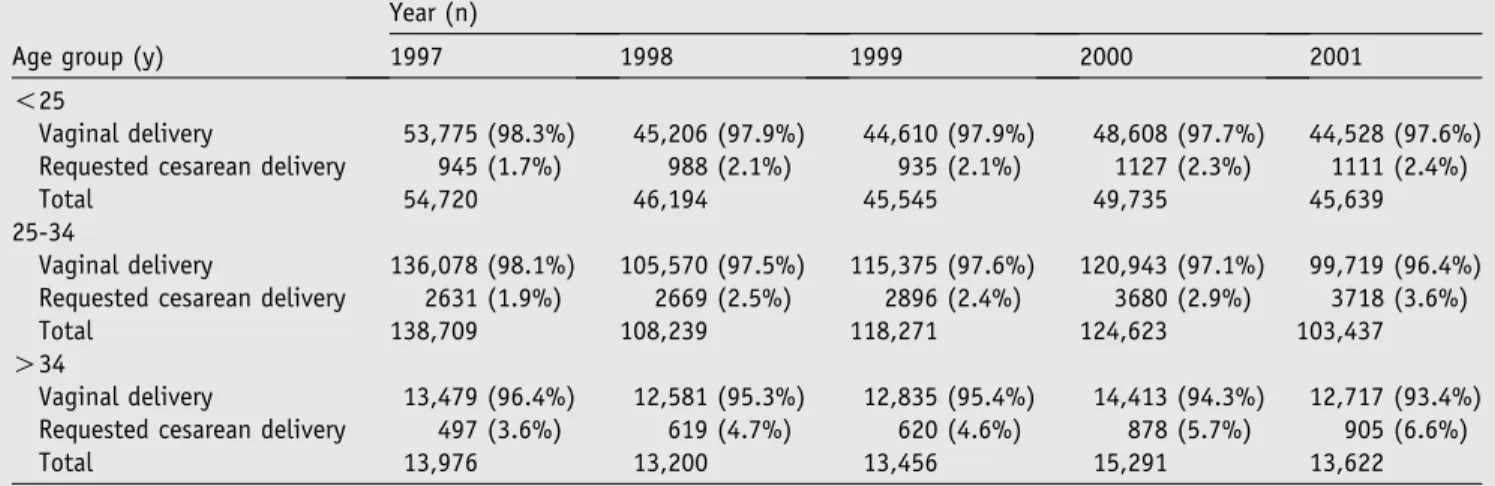
Table IIsummarizes the distribution of delivery mode by age group. Request cesarean delivery rates progres-sively increased with maternal age (all P ! .001; Pearson’s chi-squared test) in every study year. In addition, request cesarean delivery rates in each age group consistently increased from 1997 to 2001. For example, increasing percentages of women aged !25 years requested a cesarean delivery, 1.7%, 2.1%, 2.1%, 2.3%, and 2.4% during 1997, 1998, 1999, 2000, and 2001, respectively. The unadjusted odds of maternally requested cesarean delivery for the !25 year age group relative to the 25 to 34 age group were 0.91, 0.86, 0.84, 0.76, and 0.67, respectively, for 1997, 1998, 1999, 2000, and 2001, which indicates consistently declining odds of requested cesarean delivery among !25 year aged mothers relative to the 25 to 34 year age group, across the study period (data not given).
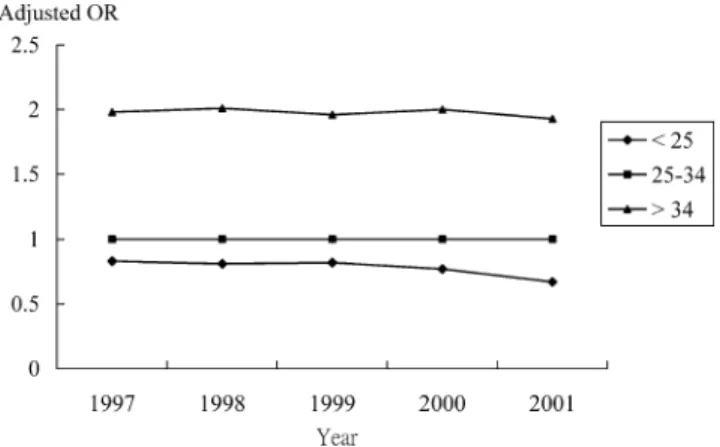
Figure 2shows the adjusted odds of the likelihood of maternal request for cesarean delivery by maternal age. The adjusted odds ratio (controlled for institutional factors and geographic location) substantiate the find-ings of the unadjusted odds ratios, show a similar downward trend for the !25 year age group relative to the 25-34 age group (odds ratio, 0.83, 0.81, 0.82, 0.77, and 0.67 respectively). Older women aged O34 years showed higher odds (twice as likely) relative to the 25 to 34 year age group. Higher odds for older women are observed consistently for every year during the study period, after adjustment for hospital level, ownership, and geographic location. Overall, the adjusted odds of a maternal request for cesarean delivery significantly increased with maternal age and across the study period.
Because Figure 1, A, shows that 16.5% of request cesarean delivery (939/5685 women) had some medical or obstetric comorbidity, we examined the effect of comorbidities on the odds ratios for the year 2000, by including a dummy variable coded 1 if the patient had a comorbidity (all 939 request cesarean delivery cases with comorbidity and vaginal delivery cases with c-morbidity), or zero for no comorbidity. The revised logistic regression model with this control variable added showed the adjusted odds of request cesarean delivery for the !25 year age group as 0.77 (95% CI, 0.72-0.82), and for O34 year age group as 2.00 (95% CI, 1.85-2.16). These odds are identical to the model without the secondary diagnoses (Figure 2). This in-dicates that secondary obstetric or medical diagnoses in patients whose condition is judged suitable for vaginal delivery do not change the age-request cesarean delivery relationship.
Comment
This study used 5-year, population-based data to explore the relationship between maternal age and maternal request cesarean delivery. Consistently, in every study year, increasing maternal age is associated with increasing odds of request cesarean delivery, with the highest odds for the O34 year age group and lowest for mothers !25 years old, after adjustment for health care institutional characteristics. Our finding is consis-tent with some authors’ speculation that older women’s preferences could explain partly their high cesarean delivery rate.20,21We also find increasing request cesar-ean delivery likelihood among all age groups with time and that, relative to women aged 25 to 34 years, the youngest age group (!25 years) were progressively less likely to have a request cesarean delivery. This suggests
Table II Maternally requested cesarean rates by age group from 1997 to 2001
Age group (y)
Year (n)
1997 1998 1999 2000 2001
!25
Vaginal delivery 53,775 (98.3%) 45,206 (97.9%) 44,610 (97.9%) 48,608 (97.7%) 44,528 (97.6%)
Requested cesarean delivery 945 (1.7%) 988 (2.1%) 935 (2.1%) 1127 (2.3%) 1111 (2.4%)
Total 54,720 46,194 45,545 49,735 45,639
25-34
Vaginal delivery 136,078 (98.1%) 105,570 (97.5%) 115,375 (97.6%) 120,943 (97.1%) 99,719 (96.4%) Requested cesarean delivery 2631 (1.9%) 2669 (2.5%) 2896 (2.4%) 3680 (2.9%) 3718 (3.6%)
Total 138,709 108,239 118,271 124,623 103,437
O34
Vaginal delivery 13,479 (96.4%) 12,581 (95.3%) 12,835 (95.4%) 14,413 (94.3%) 12,717 (93.4%)
Requested cesarean delivery 497 (3.6%) 619 (4.7%) 620 (4.6%) 878 (5.7%) 905 (6.6%)
Total 13,976 13,200 13,456 15,291 13,622
disproportionately increasing propensity of the 25 to 34 year age group to request cesarean delivery, relative to the time trend increase that has been observed among the !25 year age group. Although many studies are available on the reasons for maternal cesarean delivery preferences, we are not aware of any published pop-ulation-based study on request cesarean delivery and maternal age.
Anecdotal studies from the United Kingdom, Finland, Sweden, Singapore, and Australia document several reasons for maternal cesarean delivery preference in the absence of clinical need (such as safety of self or the baby, previous negative birth experience [which includes neo-natal morbidity or death]), traumatic childhood experi-ences, fear of perineal damage, a fear of childbirth, physical stamina, the ability to schedule delivery in advance, late childbearing, protection from pelvic floor damage, refusal or reluctance to undergo labor pain, information from the doctor, and social conve-nience.17,18,22,23 A similar study by Huang et al24 in Taiwan found that 45.1% of request cesarean delivery mothers did so primarily for astrologic reasons and that, relative to Western studies, fewer percentages did so to have a scheduled delivery, to avoid delivery pain, to avoid inconvenience to the husband and family members because of unscheduled vaginal delivery, to avoid sexual dysfunction subsequent to vaginal delivery, because of husband/relatives’ cesarean delivery preference, or to time the cesarean delivery with vacation time.
Because we controlled for institutional factors and the study sample excluded women who had any clinical indication for cesarean delivery, these odds ratios closely reflect maternal choice patterns, despite being clinically suitable for vaginal delivery. A major reason for cesarean delivery preference among older women could be related to safety. Gamble and Creedy,17on the basis of a comprehensive literature review, documented the widespread belief among women that adverse fetal and maternal outcomes increase with maternal age. Several authors have documented that delayed childbearing beyond 34 years is associated with increasing risk of adverse pregnancy outcomes.25Therefore, older women, especially primigravid women, may request a cesarean delivery to circumvent adverse outcomes, which runs counter to the many empiric studies that show that clinically un-indicated cesarean delivery increases ma-ternal mortality rates and is relatively disadvantageous to infants.7,26Specifically, Goer7presented a comprehen-sive literature review on maternal and fetal risks of vaginal versus cesarean delivery under various obstetric and medical conditions. Goer also accounted for the negative impact of specific poor obstetric practices during vaginal delivery that may have caused much of the maternal and fetal morbidity, thus, questioning the validity of contentions that vaginal delivery produces inferior outcomes relative to cesarean delivery.
Physician preferences may also influence cesarean delivery preferences among older women through the information they communicate or imply.27 In 1 survey, 98% of cesarean delivery patients said they agreed to their physician’s recommendation for cesarean deliv-ery.28 Among Israeli obstetricians, 79% indicated that they preferred cesarean delivery for 40-year-old primi-gravid women, despite the lack of clinical indications.23 Possibly, many physicians in Taiwan may recommend cesarean delivery for older women by citing safety reasons, thus influencing ‘‘maternal choice.’’ However, our speculation runs counter to a research study from the United Kingdom, which suggests that request cesarean delivery was largely patient-driven rather than physician-led.17 In-depth surveys are needed to clarify this issue.
Two of our study findings have policy implications. First, higher rates of request cesarean delivery among older pregnant women, even after an adjustment for clinical indications suggest the need for in-depth re-search on maternal and fetal outcomes, as well as cost and care implications. Although many of the major cesarean delivery risks surface in subsequent pregnan-cies, which are less likely among older women anyway, cesarean delivery preferences among older mothers must be investigated, in view of the documented adverse fetal and maternal morbidity and mortality rates with cesar-ean delivery7and the associated (possibly unnecessary) health care costs being added to the increasingly un-bearable health care costs in most developed and middle income countries. Such research can enable informed policy approaches to educate physicians and the public about the pros and cons of elective cesarean delivery.
Together with clinical outcomes and cost, the social and personal reasons for cesarean delivery preferences must be researched with the use of well-designed surveys that cover recent parturients and prepregnant women. This will enable accurate assessments of its physician-led
Figure 2 Adjusted odds ratios for request cesarean section by age group of study subjects. OR, Odds ratio, adjusted for institutional level, ownership, location, and teaching status.
and patient-driven components. Such research has in-ternational significance, given the burgeoning health care costs in almost all countries, and points out that this issue is critical for policy makers internationally to adopt an informed policy stand.
Our second finding is the consistently rising trend of cesarean delivery preference among women of all age groups. This suggests that request cesarean delivery (whether patient-driven or physician-led) is likely to increase further unless the reasons for this trend are identified and reversed, if cesarean delivery turns out to be an inferior option relative to a comprehensive port-folio of maternal and infant outcomes. Longitudinal panel studies of large samples that cover all clinical (maternal and infant) consultations after delivery are needed to settle the issue unequivocally.
The policy implications in the Taiwan context also have several pointers for international policymakers. In 2001, 3.5% of women in Taiwan without a clinical indication for cesarean delivery, as judged by their physician, opted for cesarean delivery, which amounted to 7.6% of total cesarean deliveries (5734/75,304 cesar-ean deliveries), which is comparable to Norway’s 7.6%15 and lower than Italy’s 9%.14 This raises ques-tions about the avoidable direct and indirect costs of medically unnecessary cesarean delivery. Although the government does not bear the direct costs of request cesarean delivery (request cesarean delivery patients have to bear the cost difference between vaginal delivery and cesarean delivery), it remains liable for the indirect costs because of infant morbidity and delayed maternal morbidity after cesarean delivery. Another issue is that the NHI reimbursement policy may be concealing a larger, hidden proportion of clinically un-indicated cesarean delivery, if health care providers engage in diagnosis up-coding to classify a request cesarean delivery case as a clinically indicated cesarean delivery case.
From the patient’s perspective, the right of women to choose the delivery mode should be respected. However, they also have a right to be enabled to make informed choices by their physicians based on the risks and the benefits of each delivery mode, which in turn calls for evidence-based research on delivery outcomes.
There are a couple of limitations to this study. First, the NHI Research Database lacks key information on maternal parity that could be a key determinant of cesarean delivery preferences. Our dataset also lacks data on socioeconomic characteristics, which might influence maternal choice. A significant criticism of this study could be that it lacks information on gestational age at delivery or fetal birth weight. How-ever, circumstantial evidence suggests that this may not be a major issue. Secondary diagnosis codes are avail-able to record maturity before and after delivery, which should cover most clinically significant deviations from
optimum gestational age. Second, given the BNHI’s audit procedures and censure mechanisms, such omis-sions appear unlikely. However, despite the safeguards, some degree of coding error in an administrative dataset cannot be ruled out.
This study is based on data from the NHI Research Database that is provided by the BNHI, Department of Health, Taiwan, and managed by the National Health Research Institutes. The interpretations and conclusions contained herein do not represent those of the BNHI, Department of Health, or the National Health Research Institutes.
References
1. Belizan JM, Althabe F, Barros FC, Alexander S. Rates and implications of caesarean sections in Latin America: ecological study. BMJ 1999;319:1397-400.
2. Lin HC, Xirasagar S. Institutional factors in cesarean delivery rates: policy and research implications. Obstet Gynecol 2004;103:128-36.
3. Gomes UA, Silva AA, Bettiol H, Barbieri MA. Risk factors for the increasing caesarean section rate in Southeast Brazil: a comparison of two birth cohorts, 1978-1979 and 1994. Int J Epidemiol 1999;28:687-94.
4. Evans L. Italy has Europe’s highest caesarean section rate. BMJ 1995;310:487.
5. World Health Organization. Appropriate technology for birth. Lancet 1985;2:436-7.
6. Shearer EL. Cesarean section: medical benefits and costs. Soc Sci Med 1993;37:1223-31.
7. Goer H. The case against elective cesarean section. J Perinat Neonatal Nurs 2001;15:23-38.
8. Myers SA, Gleicher N. A successful program to lower cesarean-section rates. N Engl J Med 1988;319:1511-6.
9. Socol ML, Garcia PM, Peaceman AM, Dooley SL. Reducing cesarean births at a primarily private university hospital. Am J Obstet Gynecol 1993;168:1748-54.
10. Gould JB, Davey B, Stafford RS. Socioeconomic differences in rates of cesarean section. N Engl J Med 1989;321:233-9. 11. Di Lallo D, Perucci CA, Bertollini R, Mallone S. Cesarean section
rates by type of maternity unit and level of obstetric care: an area-based study in central Italy. Prev Med 1996;25:178-85.
12. Young D. Confrontation in Kansas City: elective cesareans and maternal choice. Birth 2000;27:153-5.
13. Irvine LM, Shaw RW. Trial of scar or elective repeat caesarean section at maternal request? J Obstet Gynaecol 2001;21:463-7. 14. Tranquilli AL, Giannubilo SR. Cesarean delivery on maternal
request in Italy. Int J Gynaecol Obstet 2004;84:169-70.
15. Kolas T, Hofoss D, Daltveit AK, Nilsen ST, Henriksen T, Hager R, et al. Indications for cesarean deliveries in Norway. Am J Obstet Gynecol 2003;188:864-70.
16. Irvine LM. Maternal request for caesarean section: Is it obstetri-cian driven? J Obstet Gynaecol 2001;21:373-4.
17. Gamble JA, Creedy DK. Women’s request for a cesarean section: a critique of the literature. Birth 2000;27:256-63.
18. Chong ES, Mongelli M. Attitudes of Singapore women toward cesarean and vaginal deliveries. Int J Gynaecol Obstet 2003;80:189-94.
19. Anderson GM, Lomas J. Determinants of the increasing cesarean birth rate: Ontario data 1979 to 1982. N Engl J Med 1984;311:887-92.
20. Bianco A, Stone J, Lynch L, Lapinski R, Berkowitz G, Berkowitz RL. Pregnancy outcome at age 40 and older. Obstet Gynecol 1996;87:917-22.
21. Bell JS, Campbell DM, Graham WJ, Penney GC, Ryan M, Hall MH. Do obstetric complications explain high caesarean section rates among women over 30? A retrospective analysis. BMJ 2001;322:894-5.
22. Amu O, Rajendran S, Bolaji II. Should doctors perform an elective caesarean section on request? Maternal choice alone should not determine method of delivery. BMJ 1998;317:463-5.
23. Al-Mufti R, McCarthy A, Fisk NM. Survey of obstetricians’ personal preference and discretionary practice. Eur J Obstet Gynecol Reprod Biol 1997;73:1-4.
24. Huang CY, Yang MC, Chen WC. Maternal factors associated with the use of cesarean section: a case study of the National Taiwan University Hospital [in Chinese]. J Chin Public Health 1997;16:309-18.
25. Berkowitz GS, Skovron ML, Lapinski RH, Berkowitz RL. Delayed childbearing and the outcome of pregnancy. N Engl J Med 1990;322:659-64.
26. Hall MH. Commentary: confidential enquiry into maternal death. BJOG 1990;97:752-3.
27. Gonen R, Tamir A, Degani S. Obstetricians’ opinions regarding patient choice in cesarean delivery. Obstet Gynecol 2002;99:577-80.
28. Lescale KB, Inglis SR, Eddleman KA, Peeper EQ, Chervenak FA, McCullough LB. Conflicts between physicians and patients in non-elective cesarean delivery: incidence and the adequacy of informed consent. Am J Perinatol 1996;13:171-6.
Appendix
Distribution of complications among maternal request cesarean delivery cases with medical/obstetric secondary diagnosis (total 939/5685 cases request cesarean delivery cases)
Diagnosis ICD-9-CM Total
Premature rupture of membranes 658.1 135 (2.37%) Other specified indications for care
or intervention related to labor and delivery
659.8 111 (1.95%)
Early onset of labor 644.2 73 (1.28%)
Excessive fetal growth 656.6 59 (1.03%)
Mild or unspecified preeclampsia 642.4 44 (0.77%) Delayed delivery after spontaneous or
unspecified rupture of membranes
658.2 34 (0.60%) Anemia 648.2 31 (0.54%) Transient hypertension of pregnancy 642.3 28 (0.49%) Severe preeclampsia 642.5 25 (0.44%) Late pregnancy 645 22 (0.39%) Hemorrhage from placenta previa 641.1 20 (0.35% Abnormal glucose tolerance 648.8 19 (0.33%) Other current
conditions classifiable elsewhere
648.9 19 (0.33%)
Oligohydramnios 658.0 18 (0.31%)
Induced labor:
Failed or outcome unspecified
659.1 15 (0.26%)
Elderly primigravida 659.5 15 (0.26%)
Unspecified complication of labor and delivery
669.9 15 (0.26%)
Others* 256 (4.5%)