Abstract—A compact-size analog maximum power point tracking (AMPPT) technique is proposed in this paper for high power efficiency in the photovoltaic (PV) system. Combining ex-isting MPPT approaches, we present a fast and accurate tracking performance. Here, a wide-range current multiplier, which tracks the maximum power point (MPP) in the solar power system, is implemented to detect the power slope condition of the solar panel. Experimental results show that the proposed technique can rapidly track the MPP with a high tracking accuracy of 97.3%. Furthermore, the proposed system can connect to the grid-connected inverter to supply ac power.
Index Terms—Analog Maximum Power Point Tracking (AMPPT), grid-connected inverter, photovoltaic system, tracking efficiency, wide-range current multiplier.
I. INTRODUCTION
T
HE GLOBAL warming crisis has recently drawn world-wide public attention to issues related to energy con-servation and alternative energy. Several energy concon-servation methods, such as energy recycling [1] and energy harvesting techniques [2], have been proposed to reduce unnecessary energy waste from commercial appliances. In addition, alterna-tive energy, such as thermal [3], wind [4], or solar energy [5], is renewable and addresses pollution problems. Solar energy presents the advantages of low maintenance cost and pollu-tion-free characteristics. These are keys to solving worsening global warming and reducing greenhouse gas emissions. Thus, this alternative energy has been gaining increasing popularity in numerous countries.Solar energy may not be the most efficient choice with re-gard to energy production. Nevertheless, it still outweighs other kinds of energy, such as nuclear, coal, and gas energy, because it causes zero pollution, has no moving parts, and allows for easy maintenance. Despite these advantages, the overall energy production cost for solar energy is still too high compared with that incurred from gas or oil production. High costs restrict the wide-ranging global application of solar power systems. Generally, the low power efficiency of a solar power system is
Manuscript received May 18, 2011; revised July 27, 2011 and September 14, 2011; accepted October 30, 2011. Date of publication January 17, 2012; date of current version June 22, 2012. This work was supported by the National Science Council, Taiwan, under Grant NSC 009-050 and NSC 100-2220-E-009-055. This paper was recommended by Associate Editor E. Alarcon.
The authors are with the Institute of Electrical Control Engineering, National Chiao Tung University, Hsinchu 30010, Taiwan (e-mail: [email protected]. tw).
Color versions of one or more of the figures in this paper are available online at http://ieeexplore.ieee.org.
Digital Object Identifier 10.1109/TCSI.2011.2177008
attributed to two factors. One is the conversion efficiency of the solar cell. The other is related to the power efficiency of the system, or more specifically, the power efficiency on the power stage. The improvement of solar cell materials and relevant technology has continuously elevated the conversion efficiency of solar cells [6]. Conversion energy is reported to reach around 30% in today’s commercial products when a specific material is adopted [7]. Furthermore, enhancing the power efficiency of solar power systems enables the improvement of the efficiency of the power stage and the extraction of substantial energy from solar panels. The nonlinear physical characteristics of solar arrays, however, are inevitable obstacles to the highly efficient energy utilization of solar power systems.
The maximum available power supplied by a solar array de-pends on solar irradiation level and ambient temperature [8]. In practice, both these factors are difficult to precisely predict and measure. Thus, contemporary photovoltaic (PV) products, such as PV inverters [9] or solar chargers [10], are usually inte-grated with maximum power point tracking (MPPT) technique to extract the highest energy volume from solar arrays. Sev-eral MPPT algorithms exist [11], [12]. Some of them are imple-mented using a microcontroller [13], field programmable gate array [14], and digital signal processors [15]. Others are imple-mented using analog or mixed signal methods [16], [17]. For instance, in [18], a small-signal sinusoidal perturbation is in-jected into the switching frequency to compare the ac compo-nent [18]. The average value of the solar array voltage is used to locate the maximum power point (MPP). In [19], the authors track the MPP by introducing a small-signal sinusoidal pertur-bation into the duty cycle of the switch and comparing the max-imum variation in the input voltage and the voltage stress on the switch. Ref. [20] uses the extremum-seeking control method to track the MPP. All of these tracking methods can exhibit high tracking accuracy. Unfortunately, they are implemented by dis-crete components instead of an integrated circuit (IC). In [21], a dual-module–based tracking technique, which compares the voltage and current difference between two solar arrays to track the MPP, is proposed. This method, however, increases hard-ware costs because each solar array has to be controlled by an individual tracker.
References [22] and [23] use the pilot cell to assist tracking. Nevertheless, the pilot cell should match the characteristics of the main solar array. In [24], a tracking solution is used to address the problems encountered during rapidly changing weather conditions. The technique incorporates an additional measurement of power in the middle of the MPPT sampling period. Furthermore, one can also use the information of the solar array, such as the diode quality factor and the reverse
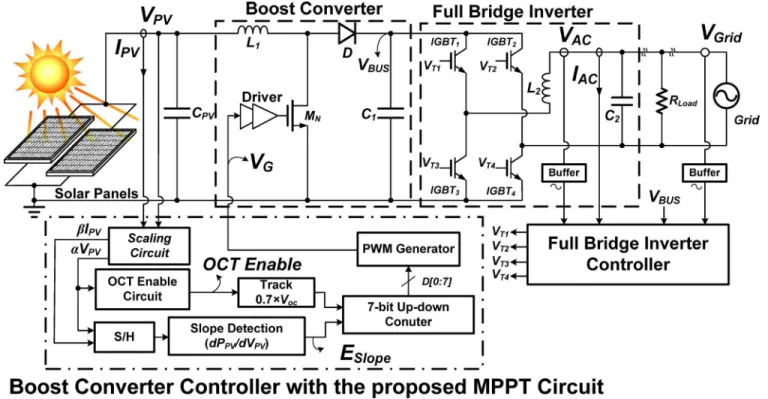
Fig. 1. Proposed grid-connected PV system.
saturation current, to track the MPP [25]. Some methods combine two different tracking techniques to gain advantages. In [26] and [27], two tracking techniques are combined to improve tracking accuracy. The system switches between two tracking methods according to irradiation levels. In the current paper, a MPP tracker using a single-chip controller IC is proposed. The proposed MPP tracker integrates some current-domain arithmetic circuits, sensing circuits, and duty cycle modulation circuits to achieve the MPP calculation. All of the circuits are implemented in a single-chip. The tracker features rapid tracking speed and high tracking accuracy. In addition, the proposed system includes a boost dc-dc converter and a grid-connected PV inverter to enable the transport of solar energy into the power grid for further use [28].
The proposed PV system is illustrated in Fig. 1. The boost converter works in conjunction with the proposed MPPT circuit in consistently tracking the MPP of the solar array. In addition, a full bridge inverter is incorporated to convert dc to ac power.
The rest of the paper is organized as follows. In Section II, the characteristics of the PV module are discussed in detail to show nonlinear behaviors and relevant cause factors. Section III intro-duces the proposed MPPT algorithm used to extract the highest volume of energy from solar panels. Circuit implementation is presented in Section IV to demonstrate the proposed wide-range current multiplier used in the PV system intended for im-proving tracking accuracy. The measurement results, shown in Section V, confirm the functionality and efficiency of the pro-posed MPPT system. Finally, Section VI concludes the paper.
II. CHARACTERISTICS OF THEPV MODULE
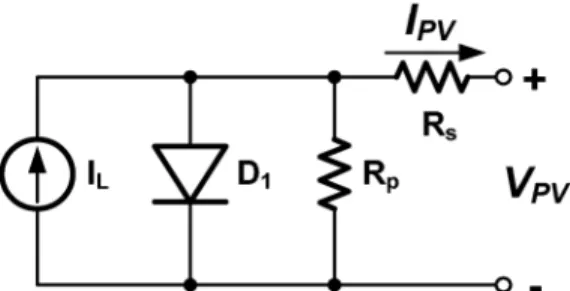
As previously mentioned, the characteristics of the PV module vary with different irradiation levels and ambient temperatures. A simplified equivalent circuit [29] in Fig. 2 can
facilitate the investigation of the nonlinear behaviors of the PV module. The equivalent circuit consists of a current source , which suggests the light-generated current; a diode , which emulates the PN junction of a real PV cell; a series resistor and a parallel resistor which symbolize the parasitic series resistance and parasitic parallel resistance on the PV module. The voltage generated at terminals is the voltage of the PV module, which can be multiplied through series-connected PV modules. Moreover, the current outflow from terminals is the current of the PV module. The relationship between and can be shown in the following equations [30]:
(1) (2) (3) where:
PV module output current; PV module output voltage; parallel resistor;
series resistor;
PV module reversal saturation current; ideality factors;
temperature ; Boltzmann’s constant;
Fig. 2. Equivalent circuit of the PV module.
light-generated current; electronic charge;
short-circuit current temperature coefficient at ;
solar irradiation ;
short-circuit current at 25 and 1000 ; bandgap energy for silicon;
reference temperature;
saturation current at temperature .
The equations verify that the characteristics of the PV module depend on temperature and solar irradiation level. Fig. 3 shows the IV curves plotted under different irradiation levels and am-bient temperatures. Under different irradiation levels [Fig. 3(a)], maximum power point increases nonlinearly as solar ir-radiation increases. On the other hand, under different ambient temperatures, the characteristics of the IV curves of the solar array behave in the manner depicted in Fig. 3(b). A nonlinear decrease in is observed when ambient temperature in-creases. These nonlinear characteristics of the PV module are crucial for analyzing and designing the PV system, especially for the MPP tracker.
III. PROPOSEDMPPT ALGORITHM
Fig. 4 demonstrates the concept of the proposed MPPT al-gorithm. Before the solar power system is activated, the oper-ating point of the system is located on open-circuit voltage point . Conventional MPPT algorithms, such as slope detection algorithm [31] [e.g., perturbation and observation (P&O) algo-rithm or hill-climbing (HC) algoalgo-rithm], calculate the slope of the characteristic curves to determine slope conditions and track the MPP. Nevertheless, a PV system adopting this algorithm re-quires a lengthy amount of time to track the operating point from to during the system power-on period, as depicted in Fig. 4.
Other tracking algorithms such as the constant voltage algo-rithm use a fixed ratio of maximum power voltage to open-cir-cuit voltage to approximate the MPP. Theoretically, 0.7 fractions of open-circuit voltage is close to the MPP [32]. Therefore, periodically disconnecting the solar array and power stage to measure and multiplying it to 0.7 can rapidly detect the current MPP. The fraction factor (0.7) varies when different
Fig. 3. Characteristic curves under (a) different irradiation levels and (b) am-bient temperatures.
Fig. 4. Illustration of the proposed MPP tracking algorithm.
Fig. 5. Illustration of the variable step perturbation (VSP) technique.
solar cell materials are used. Moreover, it is considerably sus-ceptible to environmental conditions such as ambient temper-ature and solar irradiation level. In this sense, the MPP cannot be guaranteed when varying environmental conditions are taken into consideration. Moreover, consistent disconnection between
Fig. 6. Timing diagram of the proposed MPP tracking algorithm.
the solar array and power stage causes power delivery interrup-tion during the sampling period, thereby resulting in the low power efficiency of the PV system.
To increase tracking speed and accuracy while maintaining high power efficiency, the open-circuit tracking (OCT) and slope detection tracking (SDT) algorithms are adopted to track the MPP in this study. Disconnection between the solar array and power stage occurs only once; that is, at the beginning of the system power-on period. This way, unnecessary power loss is avoided and the power efficiency is maintained. Fig. 6 illus-trates the timing diagram of the proposed tracking algorithm. is a digital signal meant to indicate the slope condition. Logic-high means that the slope condition
of the solar array is positive. By contrast, logic-low means is negative. OCT Enable indicates whether the OCT algorithm is enabled. is the gate signal of the power NMOS in the boost converter. Signal shows the inductor current of the boost converter, which can also indicate the current of the solar array.
The tracking procedure can be divided into the following se-quences. First, before the solar power system is activated, is detected by the controller to set the solar array voltage close to . This approach improves tracking speed unlike the slow tracking speeds in conventional P&O and HC algorithms. The switching duty cycle of the boost converter is set to its maximum value to accelerate the tracking speed during the open-circuit voltage detection period. Second, after the OCT period, the SDT technique takes over the tracking pro-cedure to continually and accurately track the MPP, ensuring that the power stage receives the most energy from the solar array. Third, when environmental conditions change (e.g., re-duction in irradiation level), the slope condition changes from positive to negative, as indicated by the solar cell characteris-tics shown in Fig. 3. Then, transits from high to low. As mentioned in Section II, PV voltage tends to decrease as PV current increases, and vice versa. Thus, the SDT technique in-creases the switching duty cycle. The current of the solar array increases to reduce the operating voltage and ensure the move-ment of the system operating point to a new maximum power point , as illustrated in Fig. 4. The flowchart in Fig. 6 summarizes the overall tracking topology of the proposed MPP tracking algorithm. After the solar power system is switched on, the OCT technique is enabled until the operating voltage is set to
Fig. 7. Flowchart of the proposed MPPT algorithm.
. Subsequently, the SDT technique consistently mon-itors the slope condition and guarantees that the system operates at the MPP regardless of any environmental change.
Besides, the SDT algorithm includes the variable step pertur-bation (VSP) technique [Fig. 5] to accelerate the tracking speed and to minimize the oscillation problem around the MPP. The system chooses larger perturbation step sizes when the oper-ating point is far away from the MPP, which can increase the tracking speed. In contrast, when the operating point is working around the MPP, the step sizes are set to be smaller in order to minimize the oscillation problem around the MPP.
The proposed AMPPT technique includes the advantages of both the OCT and SDT techniques. The OCT technique can roughly locate the MPP at rapid tracking speeds, while the SDT technique can improve tracking accuracy, which cannot be guar-anteed solely by the OCT technique.
For a large-scale PV system, unavoidable shadows caused by nearby trees, clouds, and buildings frequently degrade the energy of the solar array. The so-called “partial shading effect”
Fig. 8. Power-voltage characteristic curve due to non-uniform irradiation.
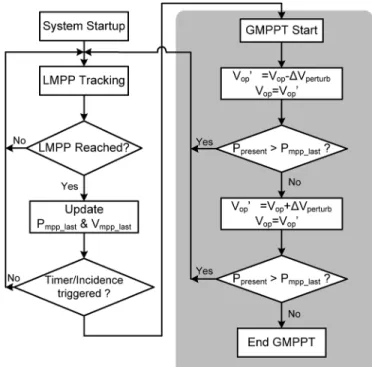
[33] poses a considerable threat to highly efficient energy utilization. Fig. 8 shows that when the solar arrays are shaded, there might be local maxima in the IV curves of the solar arrays when the bypass diodes are used. As a result, the designed MPP tracker may easily misjudge the optimal operating point; therefore, the system cannot provide its maximal energy. The proposed MPP tracking algorithm can further be improved by the algorithm described in Fig. 9 to guarantee the robustness of the PV system. The system primarily determines whether it has reached its local maximum power point . The
measured power and voltage are then
stored for later comparison. The control loop enters the global maximum power point tracking (GMPPT) stage when triggered by the timer. The default timer is set to 1 s. That is, the global maximum power point (GMPP) tracker is enabled every second to check whether the current operating point belongs to the GMPP. If the current operating point is already the maximum point on the power-voltage plane, the system will continuously operate at this point. Otherwise, the GMPP tracker locates the GMPP and forces the system to operate on the located point. During the GMPPT stage, the system is perturbed by a voltage difference , which is approximated to 60%–70% of [34]. Thus, an GMPPT technique guarantees full robustness of the connected PV system. Nevertheless, because tracking takes more time to locate the GMPP, the overall tracking speed is downgraded at the circumstance of partial shading. However, high tracking accuracy can be retained because the same SDT technique is used to track the MPP.
(4) The overall power efficiency is undermined when the GMPPT is activated, as shown in (4). denotes all the energy generated from the solar arrays. is the power loss on the power stage. denotes the power loss due to the local MPP tracking, which is inversely proportional to the tracking accuracy. is the frequency of the GMPPT procedure. and are the power consumed by the calculation and perturbation circuits in the GMPPT controller, respectively. As a result, more often the GMPPT is triggered, more energy is wasted and the lower overall power efficiency is presented.
Fig. 9. Flowchart of GMPPT.
IV. PROPOSEDCIRCUIT OF THEMPPT CONTROLLER
The proposed slope detection circuit shown in Fig. 10 detects the slope of the characteristic IV curve, that is, , at the operating point. The slope equation, according to the transfer curve of power-voltage, can be written as (5).
(5) The denominator in (5) is eliminated deliberately by the con-version ratio of voltage-to-current (V-to-I) converter to improve the calculation accuracy of the slope detection circuit. The slope detector detects the voltage and current information at two
dif-ferent time intervals. They are at and
at . Utilizing the sample/hold (SH) cir-cuit to sense the photovoltaic voltage and current of solar array, and represent the instant photovoltaic voltage and current of solar array, respectively. Similarly, and record the previous photovoltaic voltage and current, respec-tively. For easy and fast operation in analog circuits, the value of is converted to a current signal, , by the voltage-to-current (V-to-I) converter, as shown in (6). The co-efficient denotes the conversion gain of the V-to-I converter. (6)
Fig. 10. Proposed slope detection circuit.
The current difference, , between and , can be derived by the current subtractor. Moreover, the multipli-cation of and , can be achieved by the proposed wide-range current multiplier.
It’s obvious from Fig. 4 that the maximum power point occurs at the point where the slope is zero or near to zero. Therefore, one can try to find an operating point whose slope is as low as possible, no matter it is negative or positive. Once this point is found, the maximum power point can then be decided. Nev-ertheless, there is a simpler way to do the tracking. Observing the characteristic curve of solar array in Fig. 4, the maximum power point falls right between the right-hand side plane and the left-hand side plane of the curve. Namely, the maximum power point occurs on the slope transition point, where slope changes from either positive to negative or from negative to positive.
Comparing the current and in (6),
therefore, one can determine the slope condition of solar array, which can be easily carried out by a current comparator.
Fig. 10 shows the block diagram of the proposed slope detec-tion circuit following (6). The slope detecdetec-tion circuit includes a current subtractor, a voltage-to-current converter, a current com-parator, and a wide-range current multiplier. The current sub-tractor serves the purpose of computing the current difference between and . The output current of the current sub-tractor is . The voltage-to-current converter is used to con-vert the voltage data into the current data for further calculation need. The wide-range current multiplier multiplies and . In the end, the current comparator compares
and to determine the slope condition
and sends out a digital signal, either high or low, to indicate the slope condition at that time instance.
The digital signal indicates the slope condition for the duty cycle modulation circuit, which is made up by a 7-bit up-down counter. The duty cycle modulation circuit increases or decreases the duty cycle of the boost converter. As mentioned before, the voltage of solar array increases nonlinearly as the current decreases, and vice versa. When the slope is positive, the value of is high to decrease the duty cycle of the converter and thus increase the operating voltage. On the other
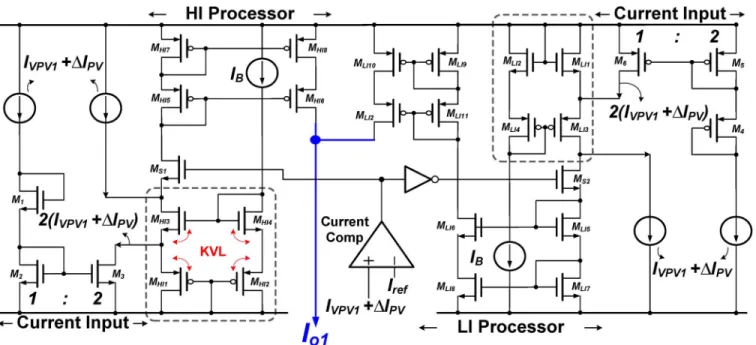
hand, a low value of the indicates the slope is negative. Then the duty cycle increases to decrease the operating voltage. Since the characteristic of solar array follows majorly by the environmental factors, such as the temperature and the irradia-tion, the voltage and current range of solar array are very wide. As a result, typical current multipliers cannot meet the need in the PV application. As can be seen in Fig. 10, the proposed wide-range current multiplier is composed of the wide-range squaring circuit, current subtractor and amplifier. The proposed wide-range squaring circuit in the wide-range current multiplier consists of a high current (HI) processor and a low current (LI) processor. This wide-range squaring circuit serves the purpose of extending the allowable current range of the current multi-plier. Fig. 11 shows the transistor level of the wide-range cur-rent squaring circuit. All the curcur-rent mirrors are implemented in the cascade way to improve the calculation accuracy. The cur-rent comparator in the figure decides whether the input curcur-rent, , is larger or smaller than the reference current, . If is larger than , the HI processor is activated and the current, flows into the drain terminal of MOSFET . After that, the current mirror pro-duces current equal to flowing out from the source terminal of . By Kirchhoff’s Voltage Law (KVL),
the summation of and is equal to that of
and as expressed in (7).
(7)
The squaring principle of MOSFET gives
(8) (9)
where is the transconductance
param-eter of transistor, is the current flowing through the tran-sistor, is the voltage between gate and source, and is the threshold voltage of the transistor.
Fig. 11. Proposed wide-range squaring circuit.
Based on squaring principle of transistor in (9), the following equations can be derived from (7).
(10)
(11) Furthermore, according to Kirchhoff’s Current Law (KCL), the following equations can therefore be derived.
(12) (13) (14) stands for the bias current in the squaring circuit. Substi-tuting (12), (13), and (14) into (11),
(15) Squaring both sides, one can derive
(16) Eliminating and squaring both sides again, (17) Then, the following equation can be derived.
(18)
Likewise, another identical wide-range squaring circuit can derive in Fig. 10, where the input current is , as shown in (19).
(19)
Subtracting from , can be
ob-tained by amplifying the current .
is generated in the end to adjust the duty cycle of the boost con-verter. Accordingly, the operating voltage of solar array is en-sured to locate at the maximum power point.
The proposed wide range squaring circuit and the slope de-tection circuit can precisely determine the slope condition at any time instant and under any circumstance. The boost converter and other controlling circuits in the controller, then, use the de-tected slope information to manipulate the operating point of the PV system. For that, the PV system can continuously operate under maximum power condition and with high power conver-sion ratio.
V. EXPERIMENTALRESULTS
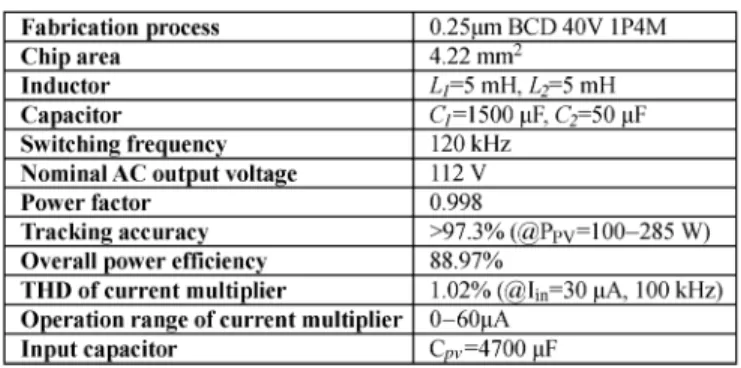
The test chip, which contains both the proposed MPPT circuit and the controller for the boost controller, was fabricated by a 0.25 BiCMOS-DMOS (BCD) 40 V 1P4M process. Fig. 12 shows the experimental setup, prototype, and chip micrograph of the controller for the boost converter. The solar array used in the measurement is Tynsolar TYN-285P6 [35]. Table I provides the technical specifications of the solar array.
The tracking accuracy of the MPPT circuit can be estimated using the following equation [36]:
(20) is the actual energy captured and delivered by the system from the solar array. denotes the maximum energy from the sun at a specific time instance, temperature,
Fig. 12. Experimental prototype and chip micrograph. TABLE I
TECHNICALSPECIFICATIONS OFTYN-285P6
Fig. 13. Tracking accuracy of the proposed MPPT algorithm and circuit.
and solar irradiation. Fig. 13 shows the MPPT accuracy per-formance measured using the proposed tracking algorithm and circuit. The tracking accuracy is higher than 97.3% in the avail-able power range of 100 to 300 W at ambient temperature of 28 . The tracking accuracy is limited below 98% compared with that observed in contemporary products [37] because of the following factors: the process variation during the silicon fabrication, temperature variation, IC layout optimization, and limited operation range of the calculation circuit components such as the multiplier, adder, and subtractor. An overflow or un-derflow current may cause the circuit to misinterpret the slope condition. As a result, tracking accuracy is undermined.
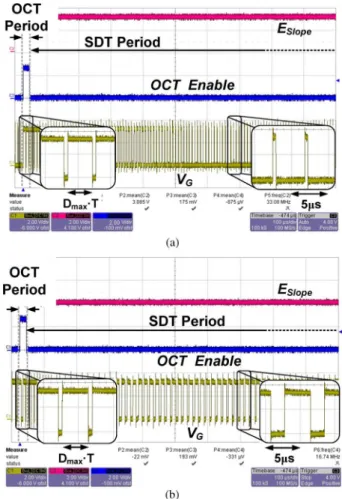
Fig. 14 shows the waveforms of the PV system during the power-on period. At the time that the PV system is switched on, the OCT technique is enabled to adjust the operating voltage close to the value of . During this open-circuit voltage
Fig. 14. Waveforms of PV system during the system power-on perio d: (a) when the detected slope condition is positive and (b) when the detected slope condition is negative.
detection period, the duty cycle is set to its maximum value to enhance the tracking speed. After this, the SDT technique takes over the tracking procedure to improve the tracking accuracy. When the slope detection circuit detects that the slope condi-tion is positive (i.e., is high), the duty cycle decreases [Fig. 14(a)]. Consequently, the inductor current is reduced and the operating voltage toward the MPP is increased. Conversely, when the slope condition is detected as negative, is set low and the controller increases the duty cycle to the boost con-verter [Fig. 14(b)]. As a result, the inductor current increases to lower the operating voltage of the system.
Fig. 15 shows the duty cycle transitions when solar irradiation changes. The detected slope condition changes either from neg-ative to positive or from positive to negneg-ative depending on the solar irradiation level. Fig. 15(a) illustrates that when the solar irradiation level increases, the duty cycle of the control signal, , which controls the gate of the power NMOS , gradu-ally decreases to a smaller value. By contrast, changes from a small to a large duty cycle when the detected slope condition transits from positive to negative, which is caused by the degra-dation of the solar irradiation level [Fig. 15(b)].
Some waveforms are shown in Fig. 16 for the investigation of the tracking speed during the system power-on period. Fig. 16(a) shows that when the OCT technique is disabled, the settling time for the system is 1.1 s. When the OCT technique is activated during the startup period, which can
Fig. 15. Waveforms of according to different values: (a) when the solar irradiation level increases, changes from low to high and (b) when the solar irradiation level decreases, changes from high to low.
rapidly approximate the MPP, the settling time can be short-ened to 22 ms [Fig. 16(b)]. Therefore, the proposed MPPT algorithm and circuit improves tracking speed at the system startup period. Furthermore, the transient behavior during any environmental condition changes is also shown in Fig. 16. As can be seen in the figure, when the solar irradiation changes from high to low, the current transient time is less than 1 ms. The transient behavior on the dc bus is negligible since a large storage capacitor is connected.
Fig. 17 and Fig. 18 demonstrate some experimental results re-garding the global maximum power point tracking. In Fig. 17,
denotes the tracking accuracy degradation percentage, is the power variation due to the GMPPT, and is the en-ergy provided by the solar arrays. As can be seen in the experi-mental result, the larger the power variation is the higher error percentage will be. The tracking error also incurs system effi-ciency degradation. in Fig. 18 means the time the system takes to locate the GMPP. When the power variation increases, the system needs more time to track the GMPP.
Fig. 19 shows the waveforms at the dc-ac inverter output, which is connected to the boost converter as shown in Fig. 1. Fig. 20 demonstrates that when the grid-connected PV system is enabled, output voltage works in phase with grid power . Table II summarizes the measurement results. The proposed AMPPT achieves a tracking accuracy of higher than 97.3%.
Fig. 16. Waveforms of , , and during the power-on period: (a) when the OCT technique is disabled and (b) when the OCT technique is acti-vated.
Fig. 17. GMPPT experiment results in terms of the tracking error percentage.
VI. CONCLUSION
The characteristic IV curves of the solar array are discussed to aid the understanding of the behaviors of solar arrays and
de-Fig. 18. GMPPT experiment results in terms of the tracking time.
Fig. 19. Output voltage and current of the inverter.
Fig. 20. Output waveforms when is connected to .
sign the MPPT circuit. The proposed MPPT algorithm achieves fast tracking speed and maintains high tracking accuracy in the solar power system. Furthermore, with single-chip circuit im-plementation, power consumption can be reduced and the high
power efficiency of the system is guaranteed. A wide-range cur-rent multiplier circuit is used to satisfy the requirement of the tracking circuit. The proposed MPPT circuit can determine the slope condition with fast speed and high accuracy. Experimental results verify the efficiency and tracking speed of the proposed MPPT algorithm. The findings also demonstrate that the PV system can convert solar energy into grid electricity with syn-chronized phase response. Moreover, a fully robust MPPT cir-cuit can be applied when the GMPPT algorithm is included.
ACKNOWLEDGMENT
The authors wish to thank Chunghwa Picture Tubes Ltd. for their help.
REFERENCES
[1] C.-Y. Hsieh and K.-H. Chen, “Boost DC-DC converter with Fast Refer-ence Tracking (FRT) and Charge-Recycling (CR) techniques for high-efficiency and low-cost led driver,” IEEE J. Solid-State Circuits, vol. 44, pp. 2568–2580, 2009.
[2] A. Richelli, L. Colalongo, S. Tonoli, and Z. M. Kovacs-Vajna, “A 0.2 V–1.2 V DC-DC boost converter for power harvesting applications,”
IEEE Trans. Power Electron., vol. 24, pp. 1541–1546, 2009.
[3] E. Carlson, K. Strunz, and B. Otis, “20 mV input boost converter for thermoelectric energy harvesting,” in Proc. IEEE Symp. VLSI Circuits, 2009, pp. 162–163.
[4] Z. Chen, J. M. Guerrero, and F. Blaabjerg, “A review of the state of the art of power electronics for wind turbines,” IEEE Trans. Power
Electron., vol. 24, pp. 1859–1875, 2009.
[5] W. Rong-Jong and W. Wen-Hung, “Grid-connected photovoltaic gen-eration system,” IEEE Trans. Circuits Syst. I, Reg. Papers, vol. 55, pp. 953–964, 2008.
[6] G. J. Bauhuis et al., “26.1% thin-film GaAs solar cell using epitaxial lift-off,” Solar Energy Mater. Solar Cells, vol. 93, pp. 1488–1491, 2009.
[7] M. A. Green et al., “Solar cell efficiency tables (version 36),” Progr.
Photovoltaics: Res. Appl., vol. 18, pp. 346–352, 2010.
[8] T. Esram, J. W. Kimball, P. T. Krein, P. L. Chapman, and P. Midya, “Dynamic maximum power point tracking of photovoltaic arrays using ripple correlation control,” IEEE Trans. Power Electron., vol. 21, pp. 1282–1291, 2006.
[9] S. Jain and V. Agarwal, “A single-stage grid connected inverter topology for solar pv systems with maximum power point tracking,”
IEEE Trans. Power Electron., vol. 22, pp. 1928–1940, 2007.
[10] F. Boico, B. Lehman, and K. Shujaee, “Solar battery chargers for NiMH batteries,” IEEE Trans. Power Electron., vol. 22, pp. 1600–1609, 2007.
[11] T. Esram and P. L. Chapman, “Comparison of photovoltaic array max-imum power point tracking techniques,” IEEE Trans. Energy Convers., vol. 22, pp. 439–449, 2007.
[12] C. Rodriguez and G. A. J. Amaratunga, “Analytic solution to the pho-tovoltaic maximum power point problem,” IEEE Trans. Circuits Syst.
[16] Z. Liang, R. Guo, and A. Huang, “A new cost-effective analog max-imum power point tracker for PV systems,” Proc. IEEE Energy
Con-vers. Congr. Expo. (ECCE), pp. 624–631, 2010.
[17] P. Mattavelli, S. Saggini, E. Orietti, and G. Spiazzi, “A simple mixed-signal MPPT circuit for photovoltaic applications,” in Proc. IEEE Appl.
Power Electron. Conf. Expo., 2010, pp. 953–960.
[18] K. K. Tse, M. T. Ho, H. S.-H. Chung, and S. Y. Hui, “A novel maximum power point tracker for PV panels using switching frequency modula-tion,” IEEE Trans. Power Electron., vol. 17, pp. 980–989, 2002. [19] H. S.-H. Chung, K. K. Tse, S. Y. R. Hui, C. M. Mok, and M. T. Ho, “A
novel maximum power point tracking technique for solar panels using a SEPIC or Cuk converter,” IEEE Trans. Power Electron., vol. 18, pp. 717–724, 2003.
[20] R. Leyva, C. Alonso, I. Queinnec, A. Cid-Pastor, D. Lagrange, and L. Martinez-Salamero, “MPPT of photovoltaic systems using ex-tremum—Seeking control,” IEEE Trans. Aerosp. Electron. Syst., vol. 42, pp. 249–258, 2006.
[21] J.-H. Park, J.-Y. Ahn, B.-H. Cho, and G.-J. Yu, “Dual-module-based maximum power point tracking control of photovoltaic systems,” IEEE
Trans. Ind. Electron., vol. 53, pp. 1036–1047, 2006.
[22] D. Brunelli, C. Moser, L. Thiele, and L. Benini, “Design of a solar-har-vesting circuit for batteryless embedded systems,” IEEE Trans.
Cir-cuits Syst. I, Reg. Papers, vol. 56, pp. 2519–2528, 2009.
[23] A. Tariq and J. Asghar, “Development of an analog maximum power point tracker for photovoltaic panel,” in Proc. Int. Conf. Power
Elec-tron. Drives Syst., 2005, pp. 251–255.
[24] D. Sera, T. Kerekes, R. Teodorescu, and F. Blaabjerg, “Improved MPPT algorithms for rapidly changing environmental conditions,” in
Proc. Power Electron. Motion Control Conf. (EPE-PEMC), 2006, pp.
1614–1619.
[25] C.-X. Liu and L.-Q. Liu, “An improved perturbation and observation MPPT method of photovoltaic generate system,” in Proc. IEEE Conf.
Ind. Electron. Appl. (ICIEA), 2009, pp. 2966–2970.
[26] G. J. Yu, Y. S. Jung, J. Y. Choi, I. Choy, J. H. Song, and G. S. Kim, “A novel two-mode MPPT control algorithm based on comparative study of existing algorithms,” in Conf. Rec. 29th IEEE Photovoltaic
Specialists Conf., 2002, pp. 1531–1534.
[27] C. Dorofte, U. Borup, and F. Blaabjerg, “A combined two-method MPPT control scheme for grid-connected photovoltaic systems,” in
Proc. Eur. Conf. Power Electron. Appl., 2005, p. 10.
[28] Y.-M. Chen, H.-C. Wu, Y.-C. Chen, K.-Y. Lee, and S.-S. Shyu, “The AC line current regulation strategy for the grid-connected PV system,”
IEEE Trans. Power Electron., vol. 25, pp. 209–218, 2010.
[29] P. Maffezzoni and D. D’Amore, “Compact electrothermal macromod-eling of photovoltaic modules,” IEEE Trans. Circuits Syst. II, Exp.
Briefs, vol. 56, pp. 162–166, 2009.
[30] M. G. Villalva, J. R. Gazoli, and E. R. Filho, “Comprehensive ap-proach to modeling and simulation of photovoltaic arrays,” IEEE
Trans. Power Electron., vol. 24, pp. 1198–1208, 2009.
[31] N. Femia, G. Petrone, G. Spagnuolo, and M. Vitelli, “Optimization of perturb and observe maximum power point tracking method,” IEEE
Trans. Power Electron., vol. 20, pp. 963–973, 2005.
[32] M. A. Masoum, H. Dehbonei, and E. F. Fuchs, “Theoretical and experi-mental analyses of photovoltaic systems with voltageand current-based maximum power-point tracking,” IEEE Trans. Energy Convers., vol. 17, pp. 514–522, 2002.
[33] T. Shimizu, M. Hirakata, T. Kamezawa, and H. Watanabe, “Generation control circuit for photovoltaic modules,” IEEE Trans. Power
Elec-tron., vol. 16, pp. 293–300, 2001.
[34] H. Patel and V. Agarwal, “Maximum power point tracking scheme for PV systems operating under partially shaded conditions,” IEEE Trans.
Ind. Electron., vol. 55, pp. 1689–1698, 2008.
[35] Tynsolar [Online]. Available: http://www.tynsolar.com.tw/up-load/TYN-285P6.pdf
control engineering from National Chiao Tung Uni-versity, Taiwan, in 2008 and 2011, respectively.
His research interests include design of power management circuit, LED driver ICs, solar battery charger, and analog integrated circuit designs.
Chun-Yu Hsieh was born in Taichung, Taiwan. He received the B.S. and Ph.D. degrees from the Depart-ment of Electrical and Control Engineering, National Chiao Tung University, Taiwan, in 2006 and 2010, respectively.
His research area includes many projects of LED driver ICs and power management ICs at Low Power Mixed Signal Lab now. He is the author or coauthor of more than 20 papers published in journals and con-ferences, and also holds several patents. His inter-ests include power management circuit designs, LED driver ICs, and analog integrated circuit designs.
Fu-Kuei Feng was born in Taipei, Taiwan. He received the M.S. degree in electrical and control engineering from National Chiao Tung University, Hsinchu, Taiwan, in 2009.
He has been engaged in design and development of PV inverters, UPS, power inverters, and solar chargers for 23 years. His research interests are in the areas of power electronics, digital control systems, and renewable energy converter.
Ke-Horng Chen (M’04–SM’09) received the B.S., M.S., and Ph.D. degrees in electrical engineering from National Taiwan University, Taipei, in 1994, 1996, and 2003, respectively.
From 1996 to 1998, he was a part-time IC designer at Philips, Taipei. From 1998 to 2000, he was an ap-plication engineer at Avanti Ltd., Taiwan. From 2000 to 2003, he was a project manager at ACARD Ltd., where he was engaged in designing power-manage-ment ICs. He is currently a Professor in the Depart-ment of Electrical Engineering, National Chiao Tung University, Hsinchu, Taiwan, where he oversees the Mixed-signal and Power Management IC Laboratory. He is the author and coauthor of more than 100 papers published in journals and conferences, as well as the owner of several significant patents. His current research interests include power management ICs; mixed-signal circuit designs; display algorithm and driver designs of liquid crystal display TV; red, green, and blue color sequential backlight designs for optically compensated bend panels; and low-voltage circuit designs.
Dr. Chen has served as an Associate Editor of the IEEE TRANSACTIONS ON POWER ELECTRONICSand the IEEE TRANSACTIONS ON CIRCUITS AND
SYSTEMS—PARTII. He is on the IEEE CAS VLSI Systems and Applications
Technical Committee and the IEEE CAS Power and Energy Circuits and Systems Technical Committee.