ORIGINAL ARTICLE
Artificial Neural Network Model for Predicting 5-Year
Mortality After Surgery for Hepatocellular Carcinoma:
A Nationwide Study
Hon-Yi Shi& King-Teh Lee& Jhi-Joung Wang&
Ding-Ping Sun& Hao-Hsien Lee& Chong-Chi Chiu
Received: 9 July 2012 / Accepted: 24 July 2012 / Published online: 10 August 2012 # 2012 The Society for Surgery of the Alimentary Tract
Abstract
Background To validate the use of artificial neural network (ANN) models for predicting 5-year mortality in HCC and to compare their predictive capability with that of logistic regression (LR) models.
Methods This study retrospectively compared LR and ANN models based on initial clinical data for 22,926 HCC surgery patients from 1998 to 2009. A global sensitivity analysis was also performed to assess the relative significance of input parameters in the system model and to rank the importance of variables.
Results Compared to the LR models, the ANN models had a better accuracy rate in 96.57 % of cases, a better Hosmer–Lemeshow statistic in 0.34 of cases, and a better receiver operating characteristic curves in 88.51 % of cases. Surgeon volume was the most influential (sensitive) parameter affecting 5-year mortality followed by hospital volume and Charlson co-morbidity index. Conclusions In comparison with the conventional LR model, the ANN model in this study was more accurate in predicting 5-year mortality. Further studies of this model may consider the effect of a more detailed database that includes complications and clinical examination findings as well as more detailed outcome data.
Keywords Hepatocellular carcinoma . Artificial neural network . Logistic regression . Five-year mortality rate
Hao-Hsien Lee and Chong-Chi Chiu are equal contributors in this work.
H.-Y. Shi
:
K.-T. LeeDepartment of Healthcare Administration and Medical Informatics, Kaohsiung Medical University,
Kaohsiung, Taiwan K.-T. Lee
Division of Hepatobiliary Surgery, Department of Surgery, Kaohsiung Medical University Hospital,
Kaohsiung, Taiwan J.-J. Wang
Department of Medical Research, Chi Mei Medical Center, Tainan, Taiwan
D.-P. Sun
:
C.-C. Chiu (*)Department of Surgery, Chi Mei Medical Center, 901, Chung Hwa Road,
Tainan 71004, Taiwan e-mail: [email protected]
H.-H. Lee
:
C.-C. ChiuDepartment of Surgery, Chi Mei Medical Center, Liouying, Taiwan
C.-C. Chiu
Taipei Medical University, Taipei, Taiwan
C.-C. Chiu
Chia Nan University of Pharmacy and Science, Tainan, Taiwan
Introduction
Hepatocellular carcinoma (HCC) is the third most common cause of cancer mortality worldwide,1–3and surgical resec-tion remains a mainstay of treatment for HCC patients whose liver function is well preserved. The incidence of HCC has steadily increased in both the United States and the United Kingdom in the past two decades.1–3The prog-nosis of HCC is dismal. The only proven curative therapy for HCC is surgical treatment by hepatic resection or liver transplantation, and only a small percentage of HCC patients meet the indications for these procedures.1In recent years, outcome prediction studies have become prevalent in many areas of health care research, especially in surgical treatment for HCC.4–6However, acceptable models for pre-dicting outcome of surgical treatment for HCC have proven difficult to develop.7
Artificial neural networks (ANNs) are complex and flex-ible nonlinear systems with properties not found in other modeling systems. These properties include robust perfor-mance in dealing with noisy or incomplete input patterns, high fault tolerance, and the capability to generalize from the input data.8Although many different ANNs have been developed, one of the most common structures consists of an interconnected group of nodes in multiple layers, in which input nodes and output nodes have clinical correlates.9,10 Hidden nodes, which connect to inputs and outputs, allow nonlinear interactions among the input vari-ables and do not have real-world correlates. The nodes are connected by links, each of which has an associated weight. This network is“trained” by exposure to inputs paired with known outputs, and learning occurs when the weights be-tween nodes are modified according to feedback.9,10 The computational power of an ANN is derived from the dis-tributed nature of its connections. Once a model is trained, novel records can be used as input to improve its prediction capability.8–10
Although substantially improved outcome prediction mod-els have been developed for many surgical procedures in recent years, studies of HCC outcome prediction models have had major shortcomings.11,12 For example, few have used longitudinal data for more than 2 years. Moreover, no HCC outcome prediction studies have considered group differences in factors such as age, gender, and nonsurgical treatment. Additionally, few of the reported performance comparisons of ANN and LR prediction models have compared the models in terms of internal validity (reproducibility), which is an essential performance metric.
Therefore, the primary aim of the study was to validate the use of ANN models for predicting 5-year mortality in HCC surgery patients. The secondary aim was to compare predictive capability between an ANN model and an LR model.
Patients and Methods Study Population
This study analyzed administrative claims data obtained from the Taiwan Bureau of National Health Insurance (BNHI). Because the BNHI is the sole payer in Taiwan, the BNHI data set was assumedly the most comprehensive and reliable data source for the study. The BNHI registry database also contains contracted medical facilities and board-certified physicians as well as monthly summaries for all inpatient claims. Although this study was exempt from full review by the internal review board since it only analyzed aggregate secondary data without identifying spe-cific patients, the study protocol conformed to the ethical standards established by the 1964 Declaration of Helsinki, which waive the requirement for written or verbal patient consent in data linkage studies.
Data collection was performed by reviewing monthly patient discharge data released by the BNHI. The National Health Insurance Research Database sample included all cases of patients hospitalized after a principal diagnosis of malignant neoplasm of liver or intrahepatic bile ducts (ICD-9-CM codes 155.XX) (n0148,018) during the years 1998– 2009. After excluding partial hepatectomy (ICD-9-CM pro-cedure code 50.22) and liver lobectomy (ICD-9-CM proce-dure code 50.3), 24,748 cases remained. The analysis excluded patients diagnosed with secondary and unspecified malignant neoplasm (ICD-9-CM codes 196.XX–199.XX), malignant neoplasm of intrahepatic bile ducts (ICD-9-CM code 155.1), or malignant neoplasm of liver, not specified as primary or secondary (ICD-9-CM code 155.2). The final sample comprised 22,926 eligible subjects who had re-ceived hepatectomy for primary liver malignancy during the study period.
Potential Confounders
For each patient, data collection included HCC volume of the treating hospital, HCC volume of the treating surgeon, and the following patient data: age, gender, co-morbidity, chemotherapy, radiotherapy, length of stay (LOS), and 5-year mortality. Co-morbidities were identified from ICD-9-CM codes for primary and secondary diagnoses and were used to calculate the Deyo–Charlson co-morbidity index (CCI).13 For each hospital or surgeon, HCC volume was defined by calculating the percentage of HCC surgeries in the total surgeries performed by the respective hospital or surgeon during the study period. Specifically, HCC volume was categorized as low, medium, high, and very high if the number of HCC surgeries performed by the hospital or surgeon during a given year in the study period comprised ≤25 %, 26 %~49 %, 50 %~74 %, and ≥75 %, respectively,
of the total surgical procedures performed by the hospital or surgeon that year.
Development of LR Models
The dataset was divided randomly into two sets, one set of 18,341 cases (80 % of the overall dataset) for training the model and 4,585 cases for testing the model. Models were built by using a training set and logistic regression. Age, gender, CCI, hospital volume, chemotherapy, radiotherapy, surgeon volume, and LOS were the independent variables, and HCC surgery outcome (5-year mortality) was the depen-dent variable. These steps (randomized division of dataset and regression analysis considering the same variables) were re-peated 1,000 times to obtain 1,000 pairs of training and testing datasets (80 % and 20 % of the original dataset, respectively), which were saved for further processing by the neural network. Development of ANN Models
The ANN used in this study was a standard feed-forward, back-propagation neural network with three layers: an input layer, a hidden layer and an output layer. A multilayer percep-tron (MLP) network is an emerging tool for designing special classes of layered feed-forward networks.14 Its input layer consists of source nodes, and its output layer consists of neurons; these two layers connect the network to the outside world. In addition to these two layers, the MLP usually has one or more layers of neurons referred to as hidden neurons because they are not directly accessible. The hidden neurons extract important features contained in the input data.
An MLP is usually trained by a back-propagation (BP) algorithm with forward and backward phases.14 The BP learning algorithm is easily implemented, and its linear complexity in the synaptic weights of the network makes it computationally efficient. For optimal learning efficiency, the neurons are usually activated with both anti-symmetric functions (e.g., hyperbolic tangent function) and non-symmetric functions (e.g., logistic function). The following cross-validation technique is used to optimize the time when a MLP network training session “stops.” First, a set of examples including one estimation subset is used for train-ing the model, and one validation subset is used for evalu-ating model performance. The neural network is then optimized using the training data set. Finally, a separate test data set is used to halt training to mitigate over-fitting. The training cycle is repeated until the test error no longer decreases.15,16
Statistical Analysis
The unit of analysis in this study was the individual HCC surgery patient. The data analysis was performed in several
stages. Firstly, continuous variables were tested for statisti-cal significance by one-way analysis of variance, and cate-gorical variables were tested by Fisher exact analysis. Significant predictors (p<0.05) were identified by univari-ate analyses. Secondly, the discriminatory power of the models was analyzed using area under the receiver operating characteristic curves (AUROCs). Here, discriminatory pow-er refpow-ers to the ability of a model to distinguish those who died from those who survived. A perfectly discriminating model would assign a higher probability of death to patients who died than to patients who survived. Thirdly, the relative calibration of the models was compared using the Hosmer– Lemeshow (H-L) statistic to study the predictive accuracy of the models over the entire range of severity. The lower the H-L statistic, the better the fit. For every 1,000 pairs of ANN models and LR models (trained and tested on the same datasets) these indices (accuracy rate, AUROC, and H-L statistic) were calculated and compared using paired t tests. Finally, sensitivity analysis was performed to assess the importance of variables in the fitted models. To simplify the training process, key variables were introduced and unnecessary variables were excluded. A sensitivity analysis was also performed to assess the relative significance of input parameters in the system model and to rank the vari-ables in order of importance. The global sensitivity of the input variables against the output variable was expressed as the ratio of the network error (sum of squared residuals) with a given input omitted to the network error with the input included. A ratio of 1 or lower indicates that the variable diminishes network performance and should be removed.
The STATISTICA 10.0 (StatSoft, Tulsa, OK) software package was used to construct the ANN model and the MR model of the relationship between the identified predictors and selected significant variables (p<0.05).
Results
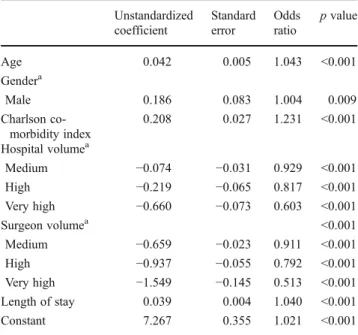
Table1shows the characteristics of the patients and hospi-tals analyzed in this study. The mean age of the study population was 58.6 years (standard deviation, 12.7). Males comprised 73.7 % of the patients, and the overall 5-year mortality rate was 39.2 %. The mean CCI of the study population was 3.6 (standard deviation, 1.6). Table2shows the coefficients for 5-year mortality obtained for the training set in the LR model. The 5-year mortality rate showed a significant (p<0.05) correlation with age, gender, CCI, hos-pital volume, surgeon volume, and LOS.
The ANN-based approaches were used to obtain the 3-layer networks and the relative weights of neurons used to predict 5-year mortality. The MLP 6-4-1 model includes 6 inputs, 1 bias neuron in the input layer, 4 hidden neurons, 1
bias neuron in the hidden layer, and 1 output neuron (Table3).
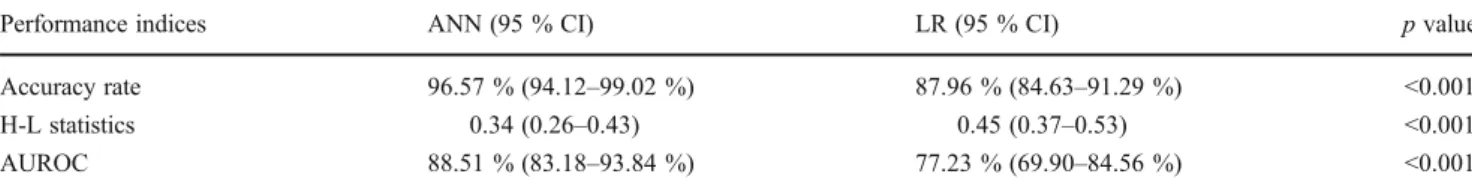
Table 4 shows that the ANN model significantly out-performed the LR model in terms of discrimination, calibra-tion, and accuracy (cutoff point 0.5). Compared to the LR model, the ANN model had a superior accuracy rate in 96.57 % of cases, a superior H-L statistic in 0.34 of cases, and a superior AUROC in 88.51 % of cases.
The training data set was also used to calculate the variable sensitivity ratios (VSR) for the MLP network. Table5 presents the VSR values for the outcome variable (5-year mortality) in relation to age, gender, CCI, hospital volume, surgeon volume, and LOS. In both models, the best (most sensitive) parameter for predicting 5-year mortality was surgeon volume followed by hospital volume and CCI. All VSR values exceeded 1, which indicated that the net-work performed better when all variables were considered.
Table 6 shows the 100 data sets used to compared the predictive accuracy of the models. Again, all performance indices revealed that the ANN model was more accurate than the LR model.
Discussion
For predicting 5-year mortality after HCC surgery, this study showed that the ANN model is better than the LR model. A literature review shows that this study is the first to use a nationwide population-based database for training and test-ing a neural network to predict HCC surgery outcomes. When using actual outcome data for a performance compar-ison based on a simple outcome measure, the ANN model clearly outperformed the LR model constructed using the same limited number of clinical inputs.
In comparison with reports that used data for a single medical center, this national registry study based on Taiwan BNHI data gives a better overview of the current practice of HCC surgery in an HBV- and HCV-epidemic region. Unlike other single-center serial studies, data from this and our earlier registry studies provide an overview of practices in large populations while avoiding referral bias or bias reflect-ing the practices of individual surgeons or institutions.17–19 The ANNs are adaptive models that enable a dynamic approach to analyzing mortality risk and enable modifica-tion of the internal structure in relamodifica-tion to a funcmodifica-tional Table 1 Characteristics of the study population (N022,926)
Variables N (%)
Age at operation (years)a 58.6±12.7
Gender
Female 6,028 (26.3 %)
Male 16,898 (73.7 %)
Charlson co-morbidity index (score)a 3.6±1.6 Chemotherapy Yes 13,297 (57.9 %) No 9,629 (42.1 %) Radiotherapy Yes 6,419 (28.0 %) No 16,507 (72.0 %)
Hospital volume (cases/year)
Low (≤25 %) 4,218 (18.4)
Medium (26–49 %) 6,145 (26.8)
High (50–74 %) 6,086 (26.6)
Very high (≥75 %) 6,477 (28.2)
Surgeon volume (cases/year)
Low (≤25 %) 5,250 (22.9)
Medium (26 %–49 %) 5,860 (25.6)
High (50 %–74 %) 5,806 (25.3)
Very high (≥75 %) 6,010 (26.2)
Length of stay (days)* 17.8±9.7
5-year mortality
Survival 13,937 (60.8 %)
Death 8,989 (39.2 %)
aValues are presented as means±standard deviations
Table 2 Logistic regression model using selected variables related to 5-year mortality Unstandardized coefficient Standard error Odds ratio p value Age 0.042 0.005 1.043 <0.001 Gendera Male 0.186 0.083 1.004 0.009 Charlson co-morbidity index 0.208 0.027 1.231 <0.001 Hospital volumea Medium −0.074 −0.031 0.929 <0.001 High −0.219 −0.065 0.817 <0.001 Very high −0.660 −0.073 0.603 <0.001 Surgeon volumea <0.001 Medium −0.659 −0.023 0.911 <0.001 High −0.937 −0.055 0.792 <0.001 Very high −1.549 −0.145 0.513 <0.001 Length of stay 0.039 0.004 1.040 <0.001 Constant 7.267 0.355 1.021 <0.001 a
Reference group characteristics are female gender, low hospital vol-ume, and low surgeon volume
Table 3 Input layer, hidden layer, and output layer of the artificial neural network (ANN) model at 5-year mortality
Medical outcome ANN-based model
objective (bottom-up computation, i.e., the data themselves generate the model). Although they cannot deal with miss-ing data, ANN models can be built with reference to outliers and nonlinear interactions among variables because they can simultaneously handle very large numbers of variables.8–10 Whereas conventional statistical models reveal parameters that are significant only for the entire population, ANNs include parameters that are statically significant at the indi-vidual level even if they are not statistically significant for the entire population. Unlike other standard statistical mod-els, ANNs can also manage complexity even with small samples and with an unbalanced ratio between variables and records.8–10 That is, ANNs overcome the problem of dimensionality. We suggest that the large and homogeneous dataset in the present study provided a sufficiently robust basis for network training because it included all clinical variables shown to have a potential impact on mortality in previous logistic regression models.2,4
Cazzaniga et al. was the first study to compare prediction capability between an ANN model and an LR model. Their performance comparison in predicting cirrhosis in chronic hepatitis C patients confirmed that the predictive perfor-mance of the ANN model was better in terms of accuracy and reproducibility.20 Cucchetti et al. further showed that, compared to the conventional LR model, an ANN model was more accurate in identifying HCC tumor grades and microscopic vascular invasion on the basis of preoperative variables and recommended its use for tailoring clinical management.21More recently, Shi et al. compared the per-formance of an ANN model and an LR model for predicting in-hospital survival after hepatic resection in HCC patients.22 Again, the ANN model outperformed the LR model in terms of prediction accuracy.
The current study confirmed the feasibility of using ANNs in medical decision support systems to predict disease-free survival after HCC surgery based on clinical databases of HCC patients who have received hepatic resec-tion. The findings are consistent with an earlier retrospective study by Shi et al., in which comparisons of 1,000 pairs of LR and ANN models generated from initial clinical data for 22,926 HCC surgery patients showed that the ANN models were more accurate in predicting in-hospital mortality and had higher overall performance indices.22
This nationwide population-based study consistently showed that the best single predictor of 5-year mortality was surgeon volume, which was consistent with the results of other reports showing that high-volume surgeons consistently achieve superior outcomes of hepatectomy for HCC.23 There-fore, their treatment strategies should be carefully analyzed and emulated. If 5-year mortality is considered a benchmark, surgeon volume, which is a major predictor of postoperative outcome, is crucial. Clearly, outcomes of surgical procedures depend not only on patient management, but also on the skill and experience of individual surgeons. Meanwhile, high-volume surgeons in high-high-volume hospitals are most likely to achieve good patient outcomes because they are well sup-ported by highly skilled and interdisciplinary care teams.23
Patients who undergo surgery for HCC are typically bur-dened by a host of liver-related co-morbidities that increase their risk of poor surgical outcomes, including complications, long LOS, high mortality, and high treatment costs.1–6,23Our statistical data also indicate that postoperative outcome in terms of 5-year mortality tends to increase with CCI.
This study has several limitations that are inherent in any large database analysis. First, the clinical picture obtained in Table 4 Comparison of 1,000 pairs of ANN and LR models for predicting 5-year mortality
Performance indices ANN (95 % CI) LR (95 % CI) p value
Accuracy rate 96.57 % (94.12–99.02 %) 87.96 % (84.63–91.29 %) <0.001
H-L statistics 0.34 (0.26–0.43) 0.45 (0.37–0.53) <0.001
AUROC 88.51 % (83.18–93.84 %) 77.23 % (69.90–84.56 %) <0.001
ANN artificial neural network, LR logistic regression, H-L statistics Hosmer–Lemeshow statistics, AUROC area under the receiver operating characteristic
Table 5 Global sensitivity analysis of the artificial neural network model in predicting 5-year mortality
Medical outcome Variable sensitivity ratio (VSR)
1st 2nd 3rd 5-year mortality Surgeon volume (1.14) Hospital volume (1.13) Charlson co-morbidity index (1.04)
Table 6 Comparison of performance indices of the ANN model and the LR model for predicting 5-year mortality in the 100 new data sets (unit, %)
Model Sensitivity 1-Specificity PPV NPV Accuracy
rate Area under ROC curve ANN model 74.23 94.10 74.64 86.98 97.43 87.12 LR model 68.17 90.22 74.56 82.41 88.67 74.67
ANN artificial neural network, LR logistic regression, PPV positive predictive value, NPV negative predictive value
this analysis of claims data is not as precise as that of a prospective clinical trial data analysis due to possible errors in the coding of primary diagnoses and surgical modalities. Second, complications associated with HCC surgical proce-dures were not assessed, which limits the validity of the comparison. Third, although supervised ANNs were validated with training and testing procedures in different patients with-in the same sample population, our predictive with-instrument requires further validation in an independent population. Fourth, we note that the specific focus on 5-year mortality as the endpoint of this prediction tool may limit the overall clinical utility of ANNs to a small subset of patients who have a high likelihood of death within 5 years. Finally, only two models were used to predict in-hospital survival after HCC surgery. Other than survival, accuracy in predicting other outcomes, such as patient-reported quality of life, were not compared because the relevant data were not included in the database. However, given the robust magnitude of the effects and the statistical significance of the effects in this study, these limitations are unlikely to compromise the results.
Conclusions
In conclusion, compared with the conventional LR model, the ANN model in the study was more accurate in predicting 5-year mortality and had higher overall performance indices. The global sensitivity analysis also showed that surgeon volume was the most important predictor of 5-year mortality after HCC surgery. The predictors analyzed in this study could be addressed in preoperative and postoperative health care con-sultations to educate candidates for HCC surgery in the expected course of recovery and health outcomes. Although emergency care teams can consider the use of ANNs for improving prognosis in this patient group, additional studies are needed to determine the true clinical relevance of ANNs by further evaluating the additional variables included in the model reported here and to determine whether clinicians can effec-tively use these instruments to predict outcome and to optimize the clinical management of patients who receive HCC surgery. Acknowledgments This study was supported by funding from the National Science Council, Taiwan (NSC99-2314-B-037-069-MY3).
References
1. Wakai T, Shirai Y, Sakata J, et al. Surgical outcomes for hepato-cellular carcinoma in nonalcoholic fatty liver disease. J Gastro-intest Surg 2011;15:1450–1458.
2. Kim SH, Choi SB, Lee JG, et al. Prognostic factors and 10-year survival in patients with hepatocellular carcinoma after curative hepatectomy. J Gastrointest Surg 2011;15:598–607.
3. Demirjian A, Peng P, Geschwind JF, et al. Infiltrating hepatocel-lular carcinoma: seeing the tree through the forest. J Gastrointest Surg 2011;15:2089–2097.
4. De Giorgio M, Vezzoli S, Cohen E, et al. Prediction of progression-free survival in patients presenting with hepatocellular carcinoma within the Milan criteria. Liver Transpl 2010;16:503–512. 5. Truty MJ, Vauthey JN. Surgical resection of high-risk
hepatocel-lular carcinoma: patient selection, preoperative considerations, and operative technique. Ann Surg Oncol 2010;17:1219–1225. 6. Cucchetti A, Piscaglia F, Grigioni AD, et al. Preoperative
predic-tion of hepatocellular carcinoma tumour grade and micro-vascular invasion by means of artificial neural network: a pilot study. J Hepatol 2010;52:880–888.
7. Lee WJ, Hur KY, Lakadawala M, Kasama K, Wong SK, Lee YC. Gastrointestinal metabolic surgery for the treatment of diabetic patients: a multi-institutional international study. J Gastrointest Surg 2012;16:45–51.
8. Tu JV. Advantages and disadvantages of using artificial neural networks versus logistic regression for predicting medical out-comes. J Clin Epidemiol 1996;49:1225–1231.
9. Sandberg IW, Lo JT, Fancourt CL, Principe JC, Katagiri S, Haykin S. Nonlinear dynamical systems: feedforward neural network per-spectives, UK: John Wiley and Sons, Inc, 2001.
10. Sakaguchi Y, Takano M. Reliability of internal prediction/estima-tion and its applicaprediction/estima-tion. I. Adaptive acprediction/estima-tion selecprediction/estima-tion reflecting reliability of value function. Neural Netw 2004;17:935–952. 11. Chua TC, Saxena A, Chu F, Liauw W, Zhao J, Morris DL.
Clinico-pathological determinants of survival after hepatic resection of hepa-tocellular carcinoma in 97 patients–experience from an Australian hepatobiliary unit. J Gastrointest Surg 2010;14:1370–1380. 12. Raza SA, Clifford GM, Franceschi S. Worldwide variation in the
relative importance of hepatitis B and hepatitis C viruses in hepatocel-lular carcinoma: a systematic review. Br J Cancer 2007;96:1127–1134. 13. D’Hoore W, Sicotte C, Tilquin C. Risk adjustment in outcome assessment: the Charlson comorbidity index. Methods Inf Med 1993;32:382–387.
14. Rumelhart DE, Hinton GE, Williams RJ. Learning internal repre-sentations by error propagation. In: Rumelhart DE and McCleland JL, editors, Cambridge, MA: MIT Press; 1986, pp 318–362. 15. Haykin S. Neural Networks: A Comprehensive Foundation, 2nd
ed., Englewood Cliffs, NJ: Prentice-Hall, 1999.
16. Sandberg IW, Lo JT, Fancourt CL, Principe JC, Katagiri S, Haykin S. Nonlinear Dynamical Systems: Feedforward Neural Network Perspectives, UK: John Wiley and Sons, Inc, 2001.
17. Ji J, Sundquist K, Sundquist J. A population-based study of hep-atitis D virus as potential risk factor for hepatocellular carcinoma. J Natl Cancer Inst 2012;104:790–792.
18. Goetze TO, Paolucci V. Adequate extent in radical re-resection of incidental gallbladder carcinoma: analysis of the German Registry. Surg Endosc 2010;24:2156–2164.
19. Martin RC 2nd, Rustein L, Pérez Enguix, et al. Hepatic arterial infusion of doxorubicin-loaded microsphere for treatment of hepatocellular can-cer: a multi-institutional registry. J Am Coll Surg 2011;213:493–500. 20. Cazzaniga M, Salerno F, Borroni G, et al. Prediction of
asymp-tomatic cirrhosis in chronic hepatitis C patients: accuracy of arti-ficial neural networks compared with logistic regression models. Eur J Gastroenterol Hepatol 2009;21:681–687.
21. Cucchetti A, Piscaglia F, Grigioni AD, et al. Preoperative predic-tion of hepatocellular carcinoma tumour grade and micro-vascular invasion by means of artificial neural network: a pilot study. J Hepatol 2000;52:880–888.
22. Shi HY, Lee KT, Lee HH, et al. Comparison of artificial neural network and logistic regression models for predicting in-hospital mortality after primary liver cancer surgery. PLoS One 2012;7:e35781.
23. Livingston EH, and Cao J. Procedure volume as a predictor of surgical outcomes. JAMA 2010;304:95–97.