跨國資訊服務業的生產力評量
計 畫 類 別 : 個別型計畫
計 畫 編 號 : MOST
103-2410-H-004-116-執 行 期 間 : 103年08月01日至104年07月31日
執 行 單 位 : 國立政治大學資訊管理學系
計 畫 主 持 人 : 周彥君
計畫參與人員: 大專生-兼任助理人員:蕭宇彤
報 告 附 件 : 出席國際會議研究心得報告及發表論文
處 理 方 式 :
1.公開資訊:本計畫可公開查詢
2.「本研究」是否已有嚴重損及公共利益之發現:否
3.「本報告」是否建議提供政府單位施政參考:否
中 華 民 國 104 年 10 月 09 日
服務經濟架構下,資訊服務產業具有一定的重要性。本計畫的研究
問題即在分析資訊服務產業的生產力。利用OECD國家從1995到
2007年的資料,我們使用Malmquist productivity index和data
envelopment analysis 檢視資訊服務產業在過去的13年間的生產力
表現。此外,我們透過數學模型,將生產力分解為科技演進、生產
效率以及經濟規模三要素。依據生產、創新以及競爭三方面的論述
,我們進一步分析資訊服務產業在此三要素的表現。
中 文 關 鍵 詞 : 資訊服務產業、生產力分析
英 文 摘 要 :
英 文 關 鍵 詞 :
1. Introduction
Over the past several decades, developed countries have transformed themselves from a
manufacturing-based economy to a services-based economy. In the U.S., the output of the services sector accounts for more than 75% of gross domestic product (GDP) and services industries employ a
comparable proportion of the total workforce (Karmarkar, 2004; Triplett and Bosworth, 2004). Organization for Economic Cooperation and Development (OECD) countries exhibit a similar pattern with more than 70% of total value added coming from services (Sheehan, 2006). Meanwhile, many developing countries are following the footsteps of their developed counterparts. As their economies grow, they witness an increasing share of output being contributed by the services sector. In China and India, 35% of their labor performs services-related work and the ratio continues to rise every year (Qiu, 2007). These figures and the trends they represent suggest that services industries are playing an increasingly important role in the world economy.
However, “services industries have long been disparaged as sources of low-skills, low-wage jobs, and they often are characterized as part of a stagnant sector marked by low productivity growth and only limited opportunities for innovation” (Triplett and Bosworth, 2004). Baumol (1967) contends that the long-term trend of having a greater share of employment tied to services would hurt the rate of aggregate economic growth. While this concern appears valid for many services industries, there are ones that may suggest otherwise (e.g., banking and finance, healthcare, and education). In this paper, we study total factor productivity (TFP) growth of the information technology (IT) services industry and examine how this knowledge- and skill-intensive business services industry fares along various performance
dimensions. We argue that the IT services industry is different from many other services industries, as it provides value-added business services, it is technology-enabled and innovation-driven, and its output is used by other industries, hence rendering an amplifying ripple effect throughout the economy.
IT services refer to the delivery and support of IT operations and activities in order to satisfy business requirements and to manage IT infrastructure for organizations. Organizations can make or buy IT services (Pearlson and Saunders, 2010). The internal IT department is charged with the provision of IT services if a firm decides to make them internally. The buy decision, instead, leads to sourcing IT services from outside vendors. The IT services industry is made up of IT services providers that offer the support of infrastructure, network and desktop help as well as the delivery of software development, applications, data, and component objects. Our study focuses on the IT services industry and looks at related issues of IT services from the standpoint of producers instead of customers.
Both technological innovations and economic factors have stimulated the IT services industry (Willcocks and Lacity, 2012). For instance, utility computing provides a cost efficient way to execute business applications, and software-as-a-service (SaaS) becomes a popular means to source IT functions (Benlian and Hess, 2011). Application service providers (ASP) rely on the service-oriented architecture (SOA) and reuse software objects to provide IT services more quickly (Susarlar et al., 2003). Outsourcing also contributes to the growth of the IT services industry (Shao and David, 2007; Chadee and Raman, 2009). The worldwide revenue for IT services in 2009 was estimated at $800 billion (Babaie et al., 2005), which was higher than the global spending of $447 billion on IT capital goods (OECD, 2006).
Despite its critical nature, the IT services industry has received surprisingly little attention in the literature. Extant related studies mainly focus on the adoption of various IT systems and business value of associated investments at the firm level (Angst et al., 2010; Gao and Hitt, 2012), the industry level (Cheng and Nault, 2012; Luo et al., 2012), and the country level (Jorgenson, 2001; Colecchia and Schreyer, 2002). Provider-oriented studies also mostly look at IT capital goods (Chou et al., 2012), instead of IT services. Our research intends to fill the gap in the literature by examining the productivity performance of the IT services industry in a cross-country context. In so doing, our effort also answers the call for more research on critical economic and socio-technical issues of IT services (Rai and
Sambamurthy, 2006).
Our study of the IT services industry is at the country level where the literature has found interesting results for IT economic value and the IT capital goods industries. For example, Jorgenson (2001) argues that fallen prices provide strong incentives to substitute IT capital goods for other types of capital and for labor services. Colecchia and Schreyer (2002) find that the U.S is not the only country that benefits from the positive effects of IT capital investment on economic growth. Other than IT capital deepening, they point out IT diffusion and usage also plays a key role. Chou et al. (2012) report stronger performance of the IT capital goods industry to meet increasing demands induced by price decline. The recent observation of productivity acceleration being dominated by IT-using industries also leads to the proposition that IT’s effects on output may go beyond input usage (Bosworth and Triplett, 2007), and IT-leveraged innovations facilitate knowledge transfer across countries through international trade of IT capital goods (Park et al., 2007). Country-level studies like these offer macro insights for national policymaking but still need to be complemented by studies of other related industries like IT services or by more firm-level studies to better understand IT’s impacts in different settings at different levels.
The motivation for our study on IT services is based on two observations. First, IT services are an important part of the services economy as they are inputs to other services. Second, extant literature has mainly focused on the IT capital goods but not on the services side. The research questions raised in our study are as follows: (1) Do the IT services industries in OECD countries show high productivity growth?
(2) What are the sources of and the inhibitors to the observed productivity growth? (3) Are these IT services industries innovative and agile? (4) Is their productivity performance subject to the changing demands of the dynamic IT services market induced by the trend of on-demand computing? We answer these questions by analyzing panel data on the IT services industries in 25 OECD countries over the period of 1995 to 2007. The time period of the data is interesting since the Internet was decommissioned by NSFNET in 1995, which signaled the start of e-commerce (Harris and Gerich, 1996). Because the Internet is a disruptive innovation for many industries (Christensen and Raynor, 2003; Hindle, 2009) and is a key enabling technology for IT services provision (Qiu, 2007), our study essentially looks at the performance of the IT services industry in the modern Internet-based e-commerce era.
Taking a multi-theoretical perspective, we aim to evaluate the productivity performance of 25 OECD countries’ IT services industries with Malmquist productivity index (MPI) to pinpoint the contributors and inhibitors to their productivity growth. Malmquist productivity index is chosen because we can decompose it into three components that provide a full analysis with links to real-world
phenomena: technical change (for innovation), efficiency change (for catch-up), and scale change (for demand fluctuation). Technical change represents the shift in the production frontier over time; efficiency change refers to the adjustment in the relative distance of the observed output to the maximum output specified by the production frontier; and scale change relates to the movement from one scale region to another defined by the production frontier. In practice, technical change reflects the strength of innovative capacity; efficiency change reveals the capability of a unit to catch up with its leading peers; and scale change reacts to demand fluctuations in the market (Arcelus and Arozena, 1999).
Our study assesses the competiveness of a country’s IT services industry on the global stage. The breakdown of Malmquist productivity index into technical innovation of production process, catch-up effort to utilize existing capacity, and responsiveness of production scale to market dynamics provides insightful implications. Policymakers and corporate executives hence can develop and implement
effective industrial policies and competitive business strategies to advance their IT services industries and firms, respectively. We employ data envelopment analysis (DEA) to calculate MPI for OECD countries’ IT services industries, as DEA is considered suited for performance evaluation in the services context (Sherman and Zhu, 2006). The application of DEA to MPI is well documented in the literature (Färe et al., 1998; Cook and Seiford, 2009).
The rest of the paper is organized as follows. Section 2 discusses recent advances in the IT services domain. In Section 3, we review the theories of production, innovation and competition that form the underpinning for our study. Section 4 presents the DEA-based models for computing Malmquist productivity index and its three constituent factors. The data collection for our cross-country analysis is described in Section 5. Section 6 presents and discusses our empirical results. Section 7 draws
implications from our results for the practice of IT services management, and finally Section 8 concludes the paper.
2. Advances in IT Services
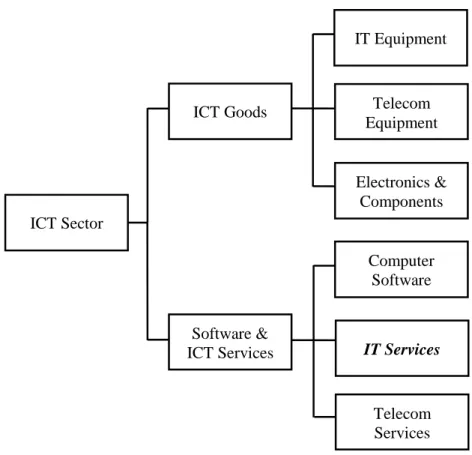
Intangible services are distinguished from tangible product goods in several ways, such as close interaction of providers and clients; simultaneity of production and consumption; nature of knowledge created and exchanged; combination of knowledge into useful systems; exchange as processes and experience points; and exploitation of information and communication technologies (ICT) (Chesbrough and Spohrer, 2006). ICT use is particularly relevant, as ICT is the means to produce and deliver IT services. According to ISIC Rev.3 Code 72, IT services consist of hardware consultancy, software consultancy and supply, data processing, database activities, maintenance and repair of computing machinery, and other computer-related activities. IT services is also one of six major industries that make up the ICT sector as defined by OECD (see Figure 1), with the other five being IT equipment, telecom equipment, electronics and components, computer software, and telecom services.
INSERT FIGURE 1 ABOUT HERE
IT services are used by other sectors and hence play a pivotal part in a services-based economy (Bottini and Tajoli, 2010). In the e-commerce era, they have gone through tremendous transformations and are no longer confined to a back-office function to support just data processing and applications (Qiu, 2007). The pace of innovations in the domain has accelerated as the Internet matured into a legitimate delivery channel and become a fertile ground for new IT services and providers. Bourne (2012) identifies some examples of these new IT services and providers, including Web services, service-oriented
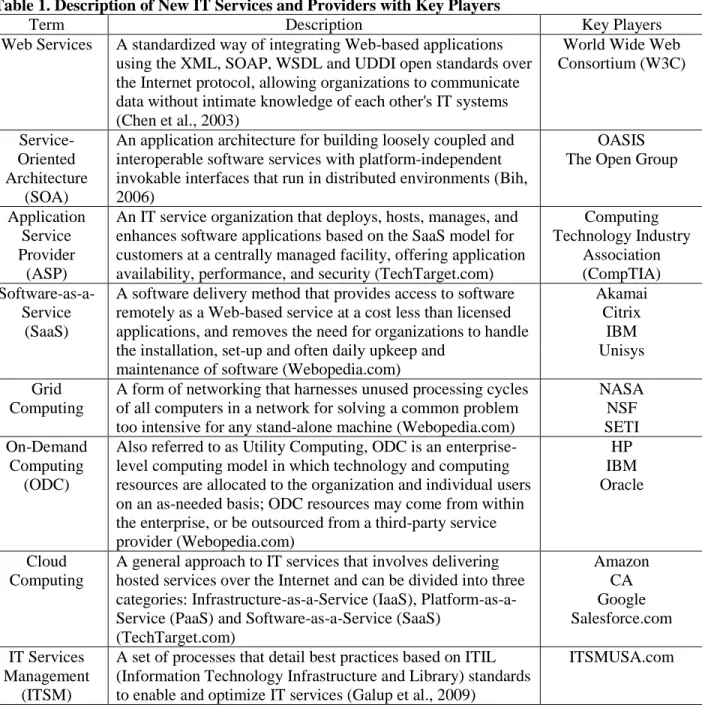
architecture (SOA), software-as-a-service (SaaS), application service provider (ASP), grid computing, on-demand utility computing, cloud computing, and information technology services management (ITSM). Table 1 provides the description of and identifies key players for these new IT services.
INSERT TABLE 1 ABOUT HERE
The growth of the IT services industry also has to do with outsourcing where IT services are procured from outside vendors (Willcocks and Lacity, 2012). With outsourcing, firms enjoy cost saving and quality services as providers realize economies of scale and scope, exploit the potentials of emerging technologies, and gain access to skilled talents with specialized knowledge (Pearlson and Saunders, 2010). Outsourcing precludes clients from acquiring wrong solutions, installing unsuitable systems, or investing in non-standard infrastructures, especially when clients lack qualified IT staff to carry out such critical tasks themselves. Outsourcing is found to have a positive effect on a firm’s innovative capability (Arora et al., 2001; Chesbrough, 2003; Görg and Hanley, 2011).
IT services are consumed at the same time they are produced (Lovelock and Gummesson, 2004). This inseparability means IT services are highly subject to demand fluctuations, in a way similar to perishable goods such as movie tickets, hotel rooms, and airline seats. On-demand computing also makes the issue of managing changing demands crucial for IT services providers. To cope with this issue, Choi et al. (2010) develop a decision support system that models SOA diffusion to achieve agility and cost savings. Sen et al. (2010) study how demand variations influence value perceptions of service-level agreement (SLA) and find sharing demand information is beneficial as a provider is able to better allocate resources and provide higher quality IT services. Susarla et al. (2010) also find long-term fixed-pricing contracts may not be ideal due to the complexity and dynamic nature of the market.
3. A Multi-Theoretical Perspective on Literature
Our multi-theoretical perspective is developed from the theories of production, innovation, and competition. In the following subsections, we review each of the theories applied to the performance evaluation of IT services industries. It is also noted that these theories tie in well with Malmquist productivity index and its three components of technical change, efficiency change, and scale change to be discussed in Section 4.
3.1. Production
Production is the process of combining and coordinating inputs (i.e., capital, labor, materials, intermediates, or productive services) in the creation of outputs (i.e., products, goods, or services) (Beattie and Taylor, 1985). Production frontier is a quantitative representation that specifies the maximum output level that can be achieved with a certain combination of input levels given the current state of
technological knowledge in the production process (Chambers, 1988). Inefficiency arises when the observed actual output level is less than the maximum output level specified by the frontier. Higher efficiency is achieved when a production agent tries to catch up with its leading peers by getting its output level closer to the frontier. Efficiency change thus reflects the variation of efficiency over time due to such catch-up efforts.
Productivity refers to the ratio of outputs to inputs. Depending on the number of inputs involved, total factor productivity takes accounts of all the inputs while partial productivity only considers a single input (e.g., labor productivity). Total factor productivity is regarded as a better performance measure than partial productivity (Baumol and McLennan, 1985; Kendrick, 1984). Malmquist productivity index we use is a measure of total factor productivity. Productivity measurement evaluates the changes of output-input ratios in the production process over time and/or across units, as productivity ratio by itself has little meaning at a certain point in time. In other words, productivity ratios are only meaningful in measuring changes over a period and/or for identifying differences among units producing the same goods or
services (Wang, 1996). In our study, the IT services industries in 25 OECD countries are compared with one another over the period of 1995 to 2007 to gain meaningful insights.
3.2. Innovation
One of the key drivers for productivity growth is technological progress enabled by innovation. Derived from the Latin word “innovāre” that means change, renew or alter, innovation in the business context is the search for and the adoption of new products, processes, and organizational setups (Ijiri and Kuhn, 1988). Innovation differs from invention, as it refers to the application of a better idea or method while invention is about the creation of the idea or method itself. When a production agent introduces a new way of producing (e.g., SaaS) into its production process, such innovation will first lead to technical change and then to productivity improvements. This innovation-based technological progress has been identified as a key factor for the growth of an industry and economy (Kuznets, 1973; Solow, 1957).
However, the conventional neoclassical growth theory treats the source of innovation as an exogenous phenomenon that is beyond the production agent’s control (Solow, 1956). When empirical work based on the growth-accounting model suggested that the unexplained share of growth beyond input usage is very significant, the interest in studying technological change as an endogenous phenomenon has increased (Verspagen, 2007). This interest leads to two competing Schumpeterian paradigms for
explaining the relationship between growth and technology innovation: endogenous growth theory (Romer, 1986, 1990) and evolutionary growth theory (Pasinetti, 1993). The two theories differ on the behavioral assumptions for the agents adopting the innovation. Endogenous growth theory argues that agents conduct a cost/benefit analysis and conscientiously decide on the optimal level of investment in innovation adoption while evolutionary growth theory contends that a trial-and-error method is used to make decisions on innovation adoption by agents operating under bounded rationality as they are unable to cope with the complexities of technical change in a complete manner (Verspagen, 2007). Still, both theories recognize the importance of innovation and technical change for growth and emphasize the decision rights of agents on innovation adoption.
Drawing on Schumpeter’s “creative destruction” for technological innovation, Freeman and Perez (1988) propose “techno-economic paradigms” to explain the patterns of technological advances that have occurred in history and to establish their links to economic changes that developed over time. In each time period, a particular platform-type technology enabled new innovations in products, services and markets, resulting in pervasive impacts on social and institutional structures across industries and throughout the economy (Helpman, 1998). Similar to steam engines and electricity central to the world economy of the past two centuries, IT is regarded as the latest platform technology for the current innovation paradigm that has existed since the mid-1990s. IT qualifies as a platform technology because it fulfills the
and prevalent applications in numerous products and processes (Miozzo and Walsh, 2006). In other words, as a general-purpose platform technology, IT has been able to facilitate the utilization of knowledge assets and stimulate the creation of innovations in products and processes (Caselli and Coleman, 2001; Joshi et al., 2010). This observation is critical to the IT services industry, as both producers and customers in the industry rely on IT to design, provide, deliver, and consume IT services. In this context, generating and applying technical knowledge is a learning process that entails gaining experiences with the production processes and with the IT services being rendered. Learning by doing and learning by using are thus distinctive attributes of IT services providers and customers, respectively.
3.3. Competition
The performance of productivity is influenced not only by technology push but also by demand pull (Triplett and Bosworth, 2004). In this regard, the theory of competition from the industrial
organization literature can provide guidance. The bargaining power of buyers is one of the competitive forces that shape the structure of an industry as well as the performance of firms in the industry (Porter, 1980). In the IT services industry, technological innovations such as on-demand utility computing have provided clients with tremendous leverage over vendors. No longer are IT services clients required to spend a significant amount of money on hardware and infrastructure, as these fixed costs are now borne by providers, and they also enjoy the flexibility and advantage of the pay-as-you-go pricing that comes with on-demand and cloud computing services.
The structure-conduct-performance (SCP) framework based on the theory of competition describes the causalities between industry conditions (structure), business strategy (conduct), and market outcome (performance) (Witteloostuijn, 1992). The SCP framework extends the study of industrial organization by considering the use of inferences from microeconomic analysis and argues that an industry's performance in producing benefits for consumers depends on the behaviors of sellers and buyers (e.g., transaction prices), which depends on the structure of the market shaped by such factors as technology (Mason, 1939, 1949). Typically, the market structure is reflected by the number of firms, market shares, demand growth, or barriers to entry.
Using this SCP framework, we note two implications resulting from the technological paradigm shift in the IT services industry. First, it shifts operational, financial and market risks from the client (demand) side to the vendor (supply) side, making IT services demand more volatile and uncertain for vendors (Bhargava and Sundaresan, 2004). IT services providers thus bear the risks and endure ensuing consequences of either underutilized capacity or penalties incurred for failing to meet SLA. In either case, IT services providers would produce at a scale level dictated more by volatile demands and less by their own strengths and competitiveness, hence hurting their productivity performance. The other implication is that IT services providers have to think carefully about how to manage demand uncertainty in an effective
way. To help firms cope with market volatility, Paleologo (2004) proposes a value-at-risk model to analyze the issue of pricing grid services by taking into account the client demand risks. Kenyon (2005) examines demand uncertainties for pricing outsourcing contracts that involve variable capacity.
Hackenbroch and Henneberger (2007) specifically look at financial services companies and develop a model to study inherent demand variability in their usage of IT resources. All these studies, however, focus on the pricing issue of vendors; little research has been devoted to the productivity performance of the IT services industry at the country level. Our research aims to make progress toward that direction.
4. Research Methods
In our empirical analysis, Malmquist productivity index (MPI) is used as the performance metric to evaluate the productivity of the IT services industry, and data envelopment analysis (DEA) is employed as the measurement approach. In the context of our study, MPI is appropriate as it consists of three components (i.e. technical change, efficiency change, and scale change), each of which is relevant to and can be explained by the three theories discussed in the preceding section: MPI and efficiency change associated with production theory, technical change with innovation, and scale change with competition.
Malmquist (1953) develops a distance function defined on the consumption space to propose Malmquist quantity index for utility theory. Caves et al. (1982) extend Malmquist quantity index to production theory and define MPI for productivity measurement. Färe et al. (1994) illustrate the use of DEA to compute Malmquist productivity index. Since then, the DEA-based approach to MPI has been frequently used for performance evaluation in various contexts across different domains (Färe et al., 1998). One reason for MPI’s popularity for performance evaluation is that the output distance function required for MPI calculation yields a ratio identical to Farrell’s output-oriented efficiency measure (Farrell, 1957). Thus, researchers can use efficiency measurement methods such as DEA (Färe et al., 1994; Arcelus and Arozena, 1999; Shao and Shu, 2004) and stochastic production frontiers (Fuentes et al., 2001; Orea, 2002; Chou et al., 2012) to derive MPI.
MPI can be compared with other productivity indexes such as Törnqvist and Fisher indexes. Törnqvist index is a continuous-time weighted sum of growth rates of various components in computing aggregate indexes for physical “capital” consisting of equipment and structures of different types. Prices of different capital types are used as the weights to represent each component's share in total value. Fisher index, on the other hand, embodies the idea that changing relative input prices will lead to changes in the relative quantities being employed in the production process as producers make substitutions among inputs. In practice, Törnqvist and Fisher indexes are close to each other, but Fisher index is sometimes preferred because it can handle zero quantities without special exceptions (Dumagan, 2002).
Several factors thus prompt us to choose MPI over Törnqvist and Fisher indexes as our total factor productivity measure. First, MPI is more general and includes Törnqvist and Fisher indexes as special cases (Färe et al., 1998). Next, price or share data on inputs and outputs are not required for MPI calculations. Also, we do not have to specify the way of aggregating multiple inputs and outputs for computing MPI. Neither do we need to make any assumptions about behaviors of production units under evaluation, such as profit maximization or cost minimization. Finally, MPI is comprised of three
components, each of which represents a different factor influencing MPI: technical change (for
innovation), efficiency change (for catch-up), and scale change (for demand fluctuation). It is noted that productivity management is a multi-faceted issue and each component has to be examined and managed with care separately (Sherman and Zhu, 2006).
The original MPI measure proposed by Caves et al. (1982) assumes constant returns to scale for the production frontier, and hence it tends to overestimate productivity when the production process exhibits decreasing returns to scale or underestimate it when the process shows increasing returns to scale. To address the issue of variable returns to scale, Färe et al. (1994) recommend the use of a generalized MPI that includes a component of scale change to reflect the effect of change in scale economies on productivity. While MPI incurs extra workload because of the computations involved with distance functions, more insights can also be gained since we are able to identify the contributors and inhibitors to productivity growth through a breakdown analysis that Törnqvist and Fisher indexes do not provide. In the next two subsections, we introduce the MPI and DEA models proposed by Färe et al. (1994) and Banker et al. (1984), respectively, and apply them to our study of IT services industries.
4.1. Malmquist Productivity Index (MPI)
Let x = (x1, x2, …, xM) RMbe an input vector and y = (y1, y2, …, yN) RNdenote a vector of
outputs. Technology set T is defined as:
T = {(x, y): y can be produced by x}. (1) Technology set T consists of all input-output vectors that are technically feasible. Output distance function do(x, y) is defined on technology set T as:
do(x, y) = min {λ: (x, y/λ) T} (2)
= [max {σ: (x, σy) T}]1. (3)
In Equation (2), λ is the denominator factor that moves the position of output vector from y to y/λ, and λ ∈ (0, ∞) where λ=1 indicates maintaining the current position, a value of λ ∈ (0, 1) represents an expansion, and a value of λ ∈ (1, ∞) specifies a contraction (Chou et al., 2012). Because the goal is to expand furthest within T and still be technically feasible, the valid range for λ (and hence the output distance function do(x, y)) is (0, 1] where a smaller λ indicates a longer distance to the frontier of the
technology set T (i.e., lower efficiency), a greater λ denotes a shorter distance to the frontier (i.e., higher efficiency), and λ=1 specifies that no expansion is possible as the output vector y is already on the frontier of T (i.e., perfect efficiency). Equation (3) reflects the same concept with σ ∈ [1, ∞) in a reciprocal way, so the valid range for the output distance function do(x, y) is still (0, 1].
Some properties of output distance function do(x, y) can be identified. First, it is non-decreasing,
linearly homogeneous, and convex in y. Second, it is non-increasing and quasi-convex in x. Third, if (x, y) T, then do(x, y) ≤ 1. Finally, if y falls on the frontier of technology set T, then do(x, y) = 1 (Coelli et al.,
2005). It is noted that Equations (2) and (3) imply output distance function do(x, y) produces a value
equivalent to the reciprocal of Farrell’s output-oriented technical efficiency (Färe et al., 1998). As a result, methods for measuring technical efficiency such as stochastic production frontiers and DEA can be used to compute output distance function do(x, y).
Let t and t+1 denote two consecutive time periods and let do t
(xt, yt) be the value of output distance function using the technology from period t and input-output vector (xt, yt) from the same time period. Then output-oriented Malmquist productivity index (MPI) is defined as (Färe et al., 1994):
2 / 1 1 1 1 1 1 1 1 1
)
,
(
)
,
(
)
,
(
)
,
(
)
,
,
,
(
t t t o t t t o t t t o t t t o t t t t oy
x
d
y
x
d
y
x
d
y
x
d
y
x
y
x
m
(4) 2 / 1 1 1 1 1 1 1 1 1 1 ) , ( ) , ( ) , ( ) , ( ) , ( ) , ( t t t o t t t o t t t o t t t o t t t o t t t o y x d y x d y x d y x d y x d y x d (5)Equation (5) shows that MPI is equivalent to the product of an index of technical efficiency change and an index of technical change. On the right hand side of Equation (5), the ratio of dot+1(xt+1, yt+1)
to do t
(xt, yt) outside the square brackets represents the change in technical efficiencies between periods t and t+1 (i.e., the change in the relative distances from the observed outputs to the ideal maximal outputs at time t and t+1, respectively). The constituents inside the square brackets of Equation (5), on the other hand, reflect technical change (i.e., the shift in the production frontier, calculated as the geometric mean of two Malmquist indexes for time t and t+1). That is,
Technical efficiency change (TEC) =
) , ( ) , ( 1 1 1 t t t o t t t o y x d y x d (6) Technical change (TCH) = 2 / 1 1 1 1 1 1 1 ) , ( ) , ( ) , ( ) , ( t t t o t t t o t t t o t t t o y x d y x d y x d y x d (7)
To account for scale effects, technical efficiency change (TEC) in Equation (6) can be further decomposed into two factors: pure efficiency change and scale change (Färe et al., 1994):
TEC =
)
,
(
)
,
(
)
,
(
)
,
(
)
,
(
)
,
(
)
,
(
)
,
(
1 1 1 -1 1 1 -1 1 1 -1 1 1 t t t r o t t t r o t t t o t t t o t t t r o t t t r o t t t o t t t oy
x
d
y
x
d
y
x
d
y
x
d
y
x
d
y
x
d
y
x
d
y
x
d
(8)The leading ratio ( , )/ - ( , )
1 1 1 -t t t r o t t t r o x y d x y
d outside the square brackets in Equation (8) refers
to the pure change in technical efficiency between time t and t+1subject to the output distance functions
do-r with the subscript r standing for variable returns to scale. Thus,
Pure efficiency change (PEC) =
) , ( ) , ( -1 1 1 -t t t r o t t t r o y x d y x d (9)
The components inside the square brackets of Equation (8) represent the effect of change in economies of scale on productivity and are expressed as SCH. It is noted that SCH can be derived by dividing TEC of Equation (6) by PEC of Equation (9) and hence does not incur its own computations of output distance functions. That is,
Scale change (SCH) = TEC / PEC. (10)
After incorporating Equations (7), (9) and (10) into (5), we obtain MPI decomposition:
) , , , ( t 1 t 1 t t o x y x y m = TCH PEC SCH. (11)
In summary, the multiplication of components TCH, PEC and SCH is equal to MPI. One benefit of defining MPI based on output distance function do(x, y) is that MPI and its constituent components
(i.e., TCH, PEC and SCH) are all calculated in an index format with a threshold value of 1. Therefore, if an index value is equal to 1, it indicates that the performance of a country’s IT services industry remains the same with regard to that performance measure between two time periods. Moreover, an index value greater than 1 represents an improvement, and an index value less than 1 indicates a decline in the performance metric being referred to.
4.2. Data Envelopment Analysis (DEA)
Data envelopment analysis (DEA) is a non-parametric and linear programming-based method for calculating technical efficiency. DEA was initially proposed by Charnes et al. (1978) whose constant returns to scale (CRS) model has been termed the CCR model since then. DEA was later refined by Banker et al. (1984) and their revised model with variable returns to scale (VRS) has been referred to as the BCC model in the literature. Since its introduction, there have been numerous applications of DEA to performance measurement in a variety of services contexts, including banks (Seiford and Zhu, 1999), hospitals (Chen et al., 2005), education (Cherchye et al., 2010), government services (De Witte and Moesen, 2010), etc. Because of the computational linkage specified by Equations (2) and (3), the values
of output-oriented DEA models are equal to the reciprocals of the corresponding output distance functions for computing MPI.
DEA is considered suited for evaluating the performance of the services sector, as DEA can handle multiple outputs of varying qualities, services providers at different locations, and absence of consistent standards, all of which are common for the services sector (Sherman and Zhu, 2006). DEA is non-parametric and based on linear programming. DEA objectively and fairly identifies efficient and inefficient units after considering their mix of inputs and outputs. Also it provides clear indications of the types and amounts of changes in inputs and outputs needed for performance improvement. The
application of DEA to Malmquist productivity index is pioneered by Färe et al. (1994). Among its merits, DEA does not need to specify a functional form for the production frontier or assume a distribution for inefficiency term to be measured. Moreover, since Malmquist productivity index involves the use of both constant returns to scale (CRS) and variable returns to scale (VRS) models of DEA, this simultaneous use renders the alleged shortcoming of DEA’s required specification of returns to scale irrelevant in our study.
To calculate MPI for a country’s IT services industry in a given year, an examination of Equations (5) and (8) shows that we need to first compute TCH, TEC and PEC, then derive SCH by dividing TEC by PEC, and finally multiply TCH, PEC and SCH to obtain MPI. Each output distance function do(x, y) represents one output-oriented DEA linear program. Among TCH, TEC and PEC, there
are a total of six output distance functions and, accordingly, a total of six corresponding DEA models have to be formulated and solved for MPI of each country’s IT services industry in a given year:
). , ( and ), , ( ), , ( ), , ( ), , ( ), , ( -1 1 1 -1 1 1 1 1 1 t t t r o t t t r o t t t o t t t o t t t o t t t o x y d x y d x y d x y d x y d x y d
We use superscripts g and h to represent possible combinations of t and t+1 in formulating our DEA models (i.e., g and h {t, t+1}). This way, rather than six linear programs, we are able to show two generalized DEA models for computing MPI for the IT services industry of a particular country p in a given year t+1 (where M is the number of inputs, N is the number of outputs, and D is the number of countries):
sign in ed unrestrict ..., , 1 , 0 ..., , 1 , 0 ..., , 1 , 0 ..., , 1 , ..., , 1 , subject to max )] , ( [ 1 1 1 1 1 p n m pd h pn p n D d g dn pd h pm m D d g dm pd N n n M m m p h h g o N n s M m s D d N n y s y M m x s x s s y x d
(12) and sign in ed unrestrict ..., , 1 , 0 ..., , 1 , 0 ..., , 1 , 0 , 1 ..., , 1 , ..., , 1 , subject to max )] , ( [ 1 1 1 1 1 1 -p n m pd D d pd g pn p n D d g dn pd g pm m D d g dm pd N n n M m m p g g g r o N n s M m s D d N n y s y M m x s x s s y x d
(13)In Models (12) and (13), θp is the technical efficiency of country p to be maximized and as
explained earlier, its optimal value is equal to the reciprocal of output distance function do(x, y) of
Equation (3). The parameter ε represents an infinitely small number and has no impact on the optimal technical efficiency θp being measured, sm represents the slack for input m, and
n
s indicates the slack for output n. Finally, pd represents the weight for country p compared with a benchmark country d and
it indicates the relative changes in inputs and outputs needed for performance improvement. It is noted that Model (12) is the CCR model with constant returns to scale (CRS) and Model (13) is the BCC model with variable returns to scale (VRS).
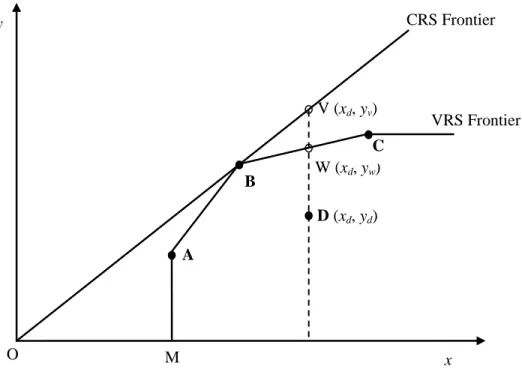
To illustrate the concept of DEA, Figure 2 presents an example of four countries A, B, C, and D using one input x to produce one output y. The straight line OB represents the CRS frontier constructed by
Model (12) and the piece-wise line segments M-A-B-C represent the VRS frontier determined by Model (13). In the CRS case, only country B is the frontier country, and country D’s efficiency is measured as
yd/yv. In the VRS case, countries A, B and C are the frontier countries, and country D’s efficiency is
measured as yd/yw.
INSERT FIGURE 2 ABOUT HERE
5. Data Description
We collected data on IT services industries in 25 countries composed of the U.S., Japan, South Korea, and 22 European Union (EU) countries for the period of 1995 to 2007. The data came from the database of EU KLEMS Growth and Productivity Accounts. The construction of the database is supported by European Commission and it intends to provide a standard productivity database for internationally comparable studies. Since researchers in the past had to compile cross-country datasets on their own, a standard database like EU KLEMS makes the replication and comparability of results possible. This database contains industry-level measures of gross outputs and inputs used for various sectors. In this study, we look at the industry of “computer and related activities” following the NACE Revision 1.1 Industry Classification. The classification of IT services industry is also consistent with that used in OECD IT Outlook (OECD, 2006). The industry contains IT services activities that include hardware consultancy, software consultancy and supply, data processing, database activities, maintenance and repair of office, accounting and computing machinery, and other computer related activities (for more details on the industry classification, refer to http://ec.europa.eu/eurostat/ramon/).
Output (Y) is defined as the “Gross Output of IT Services Industry at Current Local Price,” deflated using the GDP deflator with year 1995 = 100 to adjust for price inflation of each country. The two inputs are capital and labor. Capital (K) is based on “Capital Services,” a quantity measure that captures and reflects the differences in various types of assets that make up the capital input. In other words, the EU KLEMS database reports the measure of capital to take into account proportions of different assets and their varying contributions to output production. This treatment of capital input is considered more granular and precise (O’Mahony and Timmer, 2009). Labor (L) is defined as the “Labor Services,” a quantity measure that is also able to capture and account for differences between low-skilled and high-skilled labor. This measure of labor is aggregated from various categories of workers by skills. Each category has distinct hours worked and is weighted by the share of compensation of the category relative to the overall compensation of the industry.
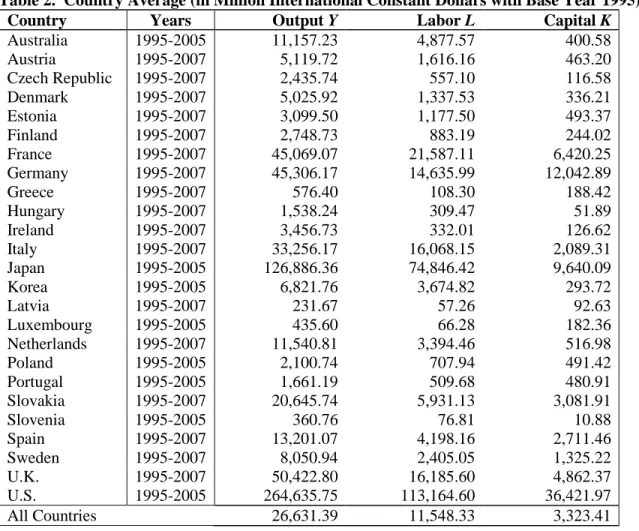
All the variables are converted to International Dollars using purchasing power parity (PPP). The measurement unit of K, L and Y is in 1995 International Dollars. Data availability includes 25 countries in our unbalanced panel data set: Australia, Austria, Czech Republic, Denmark, Estonia, Finland, France,
Germany, Greece, Hungary, Ireland, Italy, Japan, Korea, Latvia, Luxembourg, Netherlands, Poland, Portugal, Slovakia, Slovenia, Spain, Sweden, the United Kingdom, and the United States. Table 2 presents each country’s descriptive statistics of the variables for the period from 1995 to 2007.
INSERT TABLE 2 ABOUT HERE
6. Results and Discussions
Since MPI and its three components are derived from output distance function do t
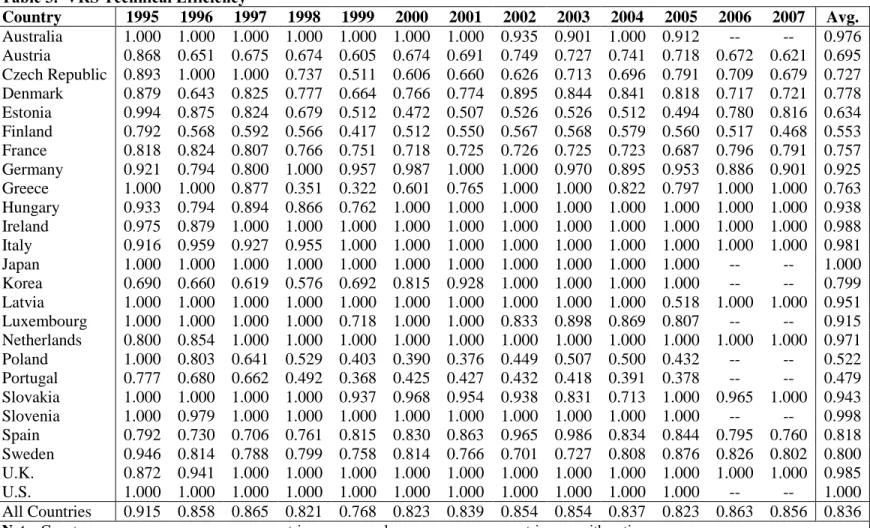
(xt, yt) whose value is identical to Farrell’s technical efficiency, we first present such technical efficiency based on the VRS DEA model (13) for every country across the years in Table 3. A higher ratio shows that a country’s IT services industry has higher technical efficiency in a given year. Consistent with the definition of MPI, country averages across years are expressed in geometric means while yearly averages across countries are calculated as arithmetic means.
INSERT TABLE 3 ABOUT HERE
In a given year column in Table 3, countries with a technical efficiency score of 1 are the most efficient countries identified by the DEA model to construct the piece-wise, linear, convex and non-parametric production frontier for that year. For example, in 1995, Australia, Greece, Japan, Latvia, Luxembourg, Poland, Slovakia, Slovenia and the U.S. are the nine frontier countries with perfect technical efficiency scores. Hence they are identified as the most efficient countries in providing IT services and are used to create the DEA frontier against which the other 16 countries are compared. It is noted that Japan and the U.S. are the frontier countries in every year throughout the study period. That is, both countries had consistently been the best practice countries in IT services production when compared with other countries. This observation of Japan and the U.S. on their efficiency performance is helpful for our later analysis of their MPI performance. On the other hand, countries like Austria, Estonia, Finland, Korea, Poland and Portugal are identified as less efficient during the study period because their average technical efficiency scores are below 0.800 and hence on the low end of the distribution.
After obtaining the value of output distance function do t
(xt, yt) for each country in each year, we present geometric means of technical change (TCH), pure efficiency change (PEC), scale change (SCH), and Malmquist productivity index (MPI) in Table 4. For the sake of interpretation, decimal figures for each index can also be viewed as their equivalent percentage changes. For example, 1.106 for TCH can be construed as an increase of 10.6% in technology innovation and 0.962 for MPI can be interpreted as a decrease of 3.8% in total factor productivity in IT services provision.
INSERT TABLE 4 ABOUT HERE
Overall, the total factor productivity of IT services industries in these countries grew at an average annual rate of 1.9% from 1995 to 2007. This TFP growth rate observed for the IT services
industry is notably strong when compared with other services industries, the services sector as a whole, and the economy at large. Triplett and Bosworth (2004) show that the TFP of the U.S. services sector grew at 1.5% from 1995 to 2001. Luhnen (2009) reports that the German insurance industry showed a TFP decrease of 8.2% from 1995 to 2006. Wheelock and Wilson (2009) analyze the data for the U.S. banking industry from 1985 to 2004 and find except for the few largest banks with more than $1 billion in total assets, the rest of the industry experienced TFP declines from 3.9% to 16.9%. Langabeer and Ozcan (2009) survey the U.S. cancer centers and find they showed a drop of 10.6% in TFP from 2002 to 2006. Bassanini et al. (2009) find that 16 OECD countries’ economies registered a sluggish TFP growth of 0.6% from 1982 to 2003. O’Mahony and Timmer (2009) also calculate TFP growth for 15 E.U. countries over the period of 1995 to 2005 and show that the average growth was lethargic at 0.4%. Jorgenson et al. (2007) find that the overall TFP growth for the U.S. economy during the period of 2000 to 2005 was 1.3%. These comparisons suggest that the IT services industry’s productivity grows more quickly than many other industries in a country’s economy.
Table 4 also presents the three constituent components of MPI and hence identifies the contributors and inhibitors to total factor productivity of the IT services industry. TCH represents the degree to which MPI growth is caused by the shift in the production frontier, hence reflecting the capability of a country’s IT services industry to innovate its production process. PEC refers to the extent to which MPI growth is attributed to the catch-up ability of a country’s IT services industry to mimic the most efficient IT services industries in other countries as identified by the DEA production frontier. SCH captures the adjustment a country’s IT services industry makes to its output volume in responding to the demand fluctuations of the market. It is noted that PEC in Table 4 is derived from technical efficiency in Table 3, but these measures represent two different performance metrics. Technical efficiency in Table 3 measures how close an IT services industry’s actual output level is to its ideal output level, and it has a maximum efficiency score of 1; instead, pure efficiency change PEC in Table 4 tracks the variations in technical efficiency over time, resulting in an index value that can be greater than, equal to, or less than 1, representing an enhancement, stagnation, or decline in technical efficiency, respectively.
Overall, these IT services industries in the 25 OECD countries are found to enjoy decent productivity growth. As can be seen in Table 4, technical change TCH (1.089) based on innovation contributes proportionally more at 8.9% to MPI (1.019) while the effect of pure efficiency change PEC (0.987) drags down MPI by 1.3%. However, an even more significant inhibitor is scale change SCH (0.947) that exerts a quadric-magnitude unfavorable impact at 5.3% on MPI. Therefore, TFP growth observed for IT services industries during the study period was mainly driven by technological
innovation, and the effects of efficiency change and scale change were both negative while the latter is significantly greater than the former. Our breakdown analysis suggests that the IT services industry is an
adept innovator at making technological progress that becomes the key driver for the observed
productivity growth; efficiency change exerts a relatively small negative impact; and scale change being mainly determined by volatile market demands diminishes productivity.
Across countries, there are interesting observations that can be identified from Table 4. First, technical change TCH consistently plays a pivotal role in enhancing TFP for almost every country’s IT services industry. The only exception is Australia with TCH = 0.994 that made little change in its production process. This country-level observation again reaffirms that IT services industries are skilled innovators at improving their production processes. Such technological progress serves as the major force for enhancing their productivity. This finding is insightful, as the IT services industry provides IT services typically used by other industries and hence this innovation-based productivity improvement can have a spillover effect on the productivity of other sectors and the economy at large. Moreover, since the IT services industry relies on ICT as the means of production and delivery, it is a heavy user of ICT goods as well as the knowledge embedded within them. This heavy usage of ICT goods makes the IT services industry an important channel for knowledge transfer across sectors and economies.
In terms of pure efficiency change PEC, only six countries (i.e., Hungary, Ireland, Italy, Korea, Netherlands, and the U.K.) show an improvement in their technical efficiency that also contributes to their respective TFP. On the other hand, four countries (i.e., Japan, Slovakia, Slovenia, and the U.S.)
demonstrate no change in average technical efficiency. A cross-look at Table 3 finds different reasons for these countries. Japan and the U.S., as mentioned earlier, had consistently been the best practice countries throughout the years, so both experienced no change in efficiency when there was no room for further efficiency improvement. Slovakia started as a best practice country, went through some up-and-down changes in technical efficiency from 1999 to 2006, and in the end these changes averaged out to have PEC equal to 1. Slovenia was consistently a best practice country, except for year 1996 with technical efficiency score of 0.979, so the drop to and the comeback from this lower efficiency cancelled out and rendered its PEC equal to 1. Finally, the other 15 countries all have average PEC lower than 1 and hence experienced deterioration in their efficiency over time. One reason for the propensity of efficiency to go down is that the IT services industry, being technology-enabled and innovation-driven, advances so rapidly that it is difficult for those lagging behind to catch up with their leading peers, and hence the gap between leaders and followers widens over time.
Scale change SCH in Table 4 shows that only two countries (i.e., Estonia and Slovenia) had benefited from the change in their production scale levels during the study period, which in turn helped with their MPIs. Two other countries (i.e., Hungary and Ireland) with SCH equal to 1 neither gained nor lost productivity from scale change. Apart from these four countries, the majority suffered from the change in their economies of scale, which then led to a negative impact on the productivity of their IT
services production. As discussed in Section 3, most IT services industries did not benefit from their production scales due to volatile market demands incurred by the sensitivity resulting from the
inseparability of production and consumption of IT services as well as by the new services paradigms of on-demand and cloud computing that shift more bargaining power to buyers. IT services vendors bear the risks and face subsequent consequences of either overcapacity due to demand uncertainty or penalties imposed by SLA. As a result, the IT services industry tends to produce at a level decided more by the volatile client demands and less by its own strengths and competitiveness. These external market factors explain why most of these countries did not benefit from their production scales.
For the seven countries that did not show productivity growth in their IT services industries, the decomposition of their MPIs assists in revealing the causes of problems and identifying the particular weaknesses that different countries can improve upon. Greece, Latvia and Luxembourg suffered more from scale change than from efficiency change, so their target for improvement should be a better mechanism to cope with demand fluctuations and uncertainties. Australia was in a similar situation but it also lacked innovation-driven technological progress, so another focus for Australia should be more aggressive adoption of innovations for the production process of its IT services. Poland, on the other hand, received more negative impact from efficiency change than from scale change, and thus its effort should be more geared toward improving its technical efficiency by catching up with other best practice countries. A cross-examination of Table 3 also notes that Poland had the second lowest average efficiency score (0.522), which means there was ample room for efficiency improvement. Finally, from Tables 3 and 4, Japan and the U.S. are identified as the best practice countries for IT services production throughout the period, so the only way for them to enhance productivity further is the relentless search for and
continuous adoption of innovations.
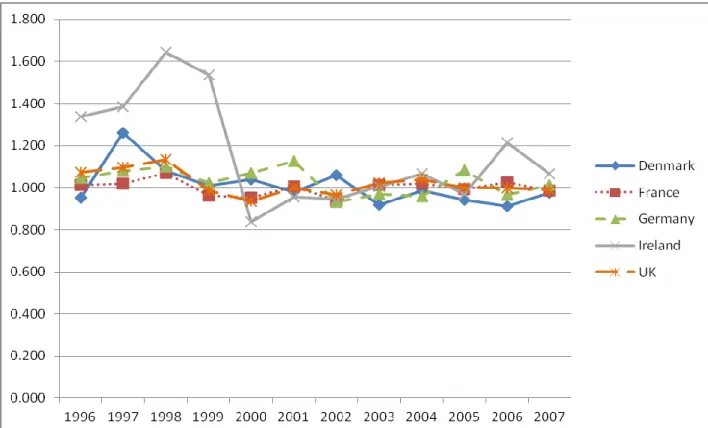
We next consider the performance of individual countries. Table 5 presents MPIs for each country over the entire period from 1996 to 2007. Among the 25 countries, 17 exhibit an increase in their MPIs. The best performing group includes Hungary, Ireland and Slovenia, each enjoying a productivity growth more than 8%. The second best group includes Czech Republic, Estonia, Korea, Spain and Sweden, each of which shows a growth rate of at least 3%. The moderate growth group consists of Finland, Germany, Italy, Netherlands, Portugal and the U.K. with productivity growth rate of 1-3%. The least growth cohort consists of Austria, Denmark and Slovakia with a growth rate less than 1%. Among the remaining countries, France shows almost no productivity change in its IT services provision (0.999), while the other 7 countries experience decreases in their MPI, albeit with varying degree. Greece and Luxembourg show minor drop in their productivity (0.998 and 0.993, respectively); the U.S., Poland and Japan experience moderate decline (0.985, 0.983 and 0.962, respectively); and Australia and Latvia suffer the most (0.936 and 0.920, respectively). Figure 3 displays MPIs for five representative countries (i.e.,
Denmark, France, Germany, Ireland and the U.K.) over the study period. INSERT TABLE 5 AND FIGURE 3 ABOUT HERE
In summary, Table 6 shows another view of our empirical results by ranking the countries in terms of their MPIs and three respective components. Several distinct groups can be identified among the countries examined in our study. First, for many countries like Austria, Finland, France and Portugal, Table 3 shows that they are not as efficient as the frontier countries. Consequently, they should first make endeavors to become more efficient by producing more IT services with the same amounts of inputs and to catch up with their leading peer countries like Japan and the U.S. This efficiency-focused effort usually costs less and is more straightforward to implement. They can look for the lessons learned on efficiency improvement by Korea, Netherlands and the U.K. that have pure efficiency change great than 1 and hence know how to catch up with the frontier countries on this efficiency front. After acquiring more efficiency, these countries can adopt innovations for their production technologies with the aim to further boost their productivity. On the other hand, these less efficient countries can try to both improve their efficiencies and innovate their production processes at the same time, although such simultaneous moves are normally more expensive and complex for monitoring and tracking respective progresses.
INSERT TABLE 6 ABOUT HERE
For the few countries like Estonia and Slovenia that benefit from scale change, they should realize that this scale-based source of productivity growth largely depends on external market factors and hence may not be sustainable. It is likely that they happen to be expanding in the production region of increasing returns to scale or contracting in the region of decreasing returns to scale. Since the provision of IT services is greatly influenced by fluctuating client demands, competitors’ actions and changing market dynamics, it is sensible to not rely on this transient scale advantage but still concentrate on more malleable means of efficiency improvements and technological innovations to enhance their productivity.
Finally, Japan and the U.S. are consistently the best practice countries identified by the DEA models throughout the study period. Both countries have technical efficiency scores of 1 and thus experience no efficiency change. The implication is that, compared with other countries, Japan and the U.S. are already best at what they are doing, meaning they are able to employ a given combination of inputs to produce the highest output level of IT services. Therefore, for consistently best practice frontier countries like Japan and the U.S. to increase productivity, the best way is to strive for persistent
innovation in advancing its production technology of its IT services industry.
7. Overall Industry-Level Implications
The decomposition of Malmquist productivity index into technical change for technology innovation to improve production process, efficiency change for catch-up effort to utilize capacity, and
scale change for production volume to respond to market dynamics offers insightful overall implications for the IT services industry. Unlike the country-specific findings discussed in the preceding section, these industry-level implications are based on the overview of the breakdown of MPI into technical change, efficiency change, and scale change across all the 25 countries examined and hence they are descriptive in nature and at a high aggregate level.
First, our results suggest that unlike many other services industries, the IT services industry is highly innovative in introducing new services as outputs (i.e., product innovations) as well as new ways of producing and delivering these services (i.e., process innovations). These technological changes based on innovations have led to notable improvements in productivity. Innovations in the IT services industry differ in characteristics from those in other services and manufacturing sectors, as it is more geared towards co-development of IT applications to deliver services. Innovations in the IT services industry tend to follow the “reverse product cycle” (Barras, 1986) where an IT services firm adopts IT to improve the production process and seeks significant improvements in the quality and delivery of the IT services provided which then form the basis for entirely new subsequent IT services (Gallouj, 1998).
Given the reliance of the IT services industry on ICT for their innovation endeavors, governments should implement regulatory reforms to help reduce ICT costs, establish ICT standards, and allocate resources to ICT skill development through STEM (science, technology, engineering and math) education and training. Also, governments can be active in building and enhancing the IT infrastructures on which IT services are developed and delivered or in facilitating the development of new IT products and services in an innovative way. For example, more deregulation in the telecommunication industry to enable high-capacity broadband and mobile communications can help promote easier and quicker access to IT services provided by the IT services industry for both e-commerce and m-commerce activities.
At a higher level, IT services play a critical role in innovation networks that help disseminate innovations and technology use through the economy by facilitating innovation adoption of client firms and by serving as an important source of knowledge for them (Pilat, 2001). The utility of IT services depends greatly on close interaction between IT services providers and customers. In this case,
governments through regulatory reforms can provide incentives to help both providers and customers to adopt best practices in innovation and business management. They can design effective technology diffusion programs to promote firm-level capabilities of adopting new knowledge and technologies. They can also remove administrative and legislative barriers that hinder the emergence and growth of
innovative startup firms in the IT services industry.
The quality of IT services hinges on IT services workers’ expertise and skills in creativity, critical thinking, communication, and resourcefulness. These highly specialized skills are necessary for
customers are also essential to the development of new IT services products and processes. Effective use of human capital and the capacity for organizational learning are key factors that distinguish the best and most productive IT services firms from the rest. Thus, investment in human capital should be a priority on the government’s agenda for innovation initiatives to promote continuous training, updating of skills, and learning programs (Pilat, 2001). Governments should have a broad-based education policy that stresses the importance of lifelong cross-disciplinary learning to develop a common talent pool that can be tapped into for future innovations. Governments should also enhance training incentives like tax break for IT services firms to help improve the skills of existing IT services workers.
Next, our analysis shows that 15 lagging countries operate inefficiently over time. Due to the rapid advance of technology and innovations in the IT services industry, it is found difficult for laggards to catch up with leaders. Just as laggards are able to inch closer to best practice performers, the relentless push for the next wave of new products and processes again raises the bar of benchmarking. Being a follower in the IT services market not only relinquishes the right to make the rules for the game but it also subjects laggards to a possible outcome of being on the productivity-losing end of fierce competition. The implication from this observation on the relative ineffectiveness of catch-up efforts means that in the rapidly advancing industry of IT services, playing defense may not be the ideal strategy. The
decomposition of MPI suggests that continuous innovation and technical domain knowledge are more effectual means to become productive and competitive in the IT services market.
Finally, our results show that the IT services industry faces the challenge of effectively managing the fluctuations in client demands, which leads to an unfavorable effect reflected in the productivity measurement. On-demand utility and cloud computing paradigms shift the bargaining power from vendors to buyers and increase operational risks and competitive pressure for IT services providers. As these innovative IT services offer flexibility and bargaining power to clients, providers end up in the suboptimal production scale regions when overinvesting in capital, experiencing labor shortage, or organizing activities ineffectively. This negative effect of scale change turns out to be the primary inhibitor to the productivity performance of the IT services industry.
To address this issue, firms can develop and use more powerful demand forecasting tools with business intelligence capabilities to make better demand predictions and thus have a better planning horizon. This technology solution is again based on innovations and will be enabled and further enhanced by the amount of big data being automatically collected and parsed (Mayer-Schönberger and Cukier, 2013). Moreover, the industry as a whole should be willing to adapt the quality and mix of IT services to meet changing client needs of different market segments. This finer-grained menu of IT services offerings entails a strategic thinking of the long tail (Brynjolfsson et al., 2010). To develop absorptive and adaptive capacity, IT services firms have to be creative and think outside the box by, for example, forming
strategic alliances to develop common industry IT services standards that allow resources to be pooled and shared. Governments can also help by reducing trade barriers and hence make IT services more tradable across national borders. Global electronic commerce can open the door for global delivery of IT services. The globalization of IT services evidently will also increase the competition for providers and make productivity performance an even more critical success factor for them.
8. Conclusion
The services sector has historically been regarded as having slow productivity growth with a limited ability to innovate (Gallaher et al., 2006). Additionally, the sector has been characterized as providing low-paying jobs, adopting insufficient technology, and requiring low skill and little knowledge to perform the tasks. However, not every services industry fits this profile description. Taking a multi-theoretical perspective, we study total factor productivity growth in the IT services industry. Based on the theories of production, innovation and competition, we have employed DEA and Malmquist TFP index to investigate the productivity performance and competitiveness of IT services industries in 25 OECD countries over the modern e-commerce era of 1995 to 2007. Overall, these IT services industries enjoy decent productivity growth at an average annual rate of 1.9%, which is higher than most other services sectors. A further step is taken to decompose productivity index into three components that represent different aspects of performance: technological change (for innovation), efficiency change (for catch-up effort), and scale change (for demand fluctuations).
Our breakdown analysis finds that observed productivity growth is mainly driven by innovation-based technological progress made to the production processes in the IT services industry; efficiency change exerts a small negative effect; and the change in scale economies adversely affects productivity for a majority of the countries. Technology innovations introduced in the production processes, however, are strong enough to compensate for negative effects incurred by efficiency change and scale change. Practical implications for IT services management are drawn from our results to provide suggestions for policy and strategy formulation.
Our study represents the first attempt to empirically analyze productivity growth, technical change, efficiency change, and scale change of IT services industries in a cross-country context. By addressing the four research questions raised in Section 1 to fill the void in the literature, we find that IT services industries in OECD countries show relatively high productivity growth; technology innovation is the primary source of productivity growth being measured, and the inhibitors are efficiency change and scale change; IT services industries are highly innovative and agile; and their productivity performance is greatly influenced by the changing demands of the IT services market due to novel services paradigms.