行政院國家科學委員會補助專題研究計畫成果報告
※※※※※※※※※※※※※※※※※※※※※※※※※
※ ※
※ 跨國製造業廠商供應鏈改變對實體物流之影響 ※
※
※
※※※※※※※※※※※※※※※※※※※※※※※※※
計畫類別:þ個別型計畫 □整合型計畫
計畫編號:NSC 89-2415-H-009-004-SSS
執行期間: 89 年 8 月 1 日至 90 年 7 月 31 日
計畫主持人:馮正民教授
共同主持人:
本成果報告包括以下應繳交之附件:
□赴國外出差或研習心得報告一份
□赴大陸地區出差或研習心得報告一份
□出席國際學術會議心得報告及發表之論文各一份
□國際合作研究計畫國外研究報告書一份
執行單位:國立交通大學交通運輸研究所
中
華
民 國
90
年
8
月
15
日
行政院國家科學委員會專題研究計畫成果報告
跨國製造業廠商供應鏈改變對實體物流之影響
計畫編號:NSC 89-2415-H-009-004-SSS
執行期限:89 年 8 月 1 日至 90 年 7 月 31 日
主 持 人:馮正民 國立交通大學交通運輸研究所
計畫參與人員:賈凱傑
國立交通大學交通運輸研究所博士候選人一、中文摘要
隨著產業全球化的發展以及顧客消費 習慣的改變,許多製造業廠商在降低成本 以及行銷的考慮下,紛紛調整其原有的供 應鏈作業與流程,以期獲得企業經營的最 大利潤並快速滿足顧客的需求。本研究之 目的即希望藉由對廠商供應鏈變化的瞭 解,進而探討供應鏈改變對實體物流的影 響。 本研究選擇台灣地區的資訊電子廠商 進行問卷調查及面訪,深入瞭解廠商供應 鏈的變化情形、國際分工的原因、及其調 整製造與物流作業的作法。根據問卷調查 及實際訪談所得資料的分析,本研究發現 (1)我國資訊電子廠商專業化垂直分工及 國際分工的情形相當明顯,(2)廠商隨著 產品生命週期的不同階段,而有不同的供 應鏈調整作法,(3)就引申的貨物運輸需 求而言,在廠商改變供應鏈的過程中,對 於運輸服務速度的要求提高,換言之,對 於航空貨運需求有增加的趨勢,而對海運 需求則趨於減少,(4)一個地區的運輸服 務的確會影響廠商利用「時間」上的「延 後」策略進行供應鏈的調整。 關鍵詞:供應鏈、物流、產品週期、資訊 電子產品Due to the globalization of industry, the explosion in customer services, and product life-cycle compression, most manufacturers have been adjusting the processes and activities of their supply chains in order to remain competitive and optimize profit. The objective of this study is to explore the issues surrounding the changes in manufacturing supply chains and the consequential impact on freight transportation demand. A
questionnaire to survey Taiwanese IT firms was designed and conducted, to recognize in detail the changes in supply chains of manufacturers, tends in the international division of labor and the strategic adjustment of manufacturing and logistics. Surveys and interviews lead to the conclusions that 1) vertical integration and international division of labor are very conspicuous among Taiwanese IT firms, 2) there are different strategies of supply chain adjustment at various stages of the product life cycle, 3) with the transformation of the supply chain, manufacturers require faster transportation services, that is, the demand for air transportation may increase and the demand for sea transportation may decrease, 4) those firms who apply the postponement strategy to adjust their supply chain might be restricted to the availability of transportation services in the factory location area.
Keywords: supply chain management, global logistics, product life cycle, information technology.
二、緣由與目的
近年 來, 由於 全 球經 濟環 境變 化快 速,廠商面對的競爭愈來愈激烈,許多廠 商都希望藉由適切地調整供應鏈的流程與 作業(processes and activities),以強化廠 商的競爭力。另一方面,在全球化與自由 化 的 環 境 下 , 廠 商 基 於 各 地 要 素 稟 賦 (factor endowment)的不同而前往海外不 同地區設廠生產的情形日漸普遍。在上述 主客觀環境的改變下,不但個體廠商運輸 需求的起迄點(O-D)以及對運具的選擇將 改變,整體而言,也可能進一步影響國際 間貨物運輸的流向。 本研究回顧相關文獻發現雖然以往在
供應鏈管理、運輸、空間經濟等領域均已 分別有研究探討廠商產銷活動,惟對於供 應鏈與貨物運輸相互影響的討論,則較為 少見。然而,由於運輸需求是一種引申需 求,在廠商全球分工的過程中,供應鏈的 調整究竟將對運輸需求造成何種影響?影 響的程度如何?都是令人關切的。因此, 本研究希望藉由對台灣製造業(資訊電子) 廠商全球分工及供應鏈變化的調查,探討 影響廠商供應鏈調整的因素,並希望進一 步了解供應鏈調整對運輸需求特性的影 響,研究的發現可作為後續「量化」分析 之基礎。
三、研究內容與成果
(一)、研究內容 本研究首先重新釐清「供應鏈」的定 義,其次,說明一般廠商進行供應鏈作業 調整的目的與作法,並由以往的研究歸納 產品特性與供應鏈調整模式間可能存在的 關係。主要的研究內容包括: (1) 我國製造業廠商供應鏈是否進行「空 間」上的調整?進行空間調整時,是 否會受到產品特性(生命週期)的影 響而有所差異? (2) 製造業廠商的供應鏈是否進行「時間」 上的調整?是否會受到產品特性的影 響而有所差異? (3) 供應鏈的調整是否會改變廠商運輸需 求的起迄點,以及運具的選擇? (4) 在不同區位對於運輸服務的提供,是 否會影響廠商供應鏈的調整? (5) 運輸成本對廠商供應鏈調整決策的影 響。 本研究基於以下三項準則選擇資訊電 子業作為調查的對象,分別為:(1)該項產 業的產值相對於我國整體製造業的產值, 佔有重要的地位;(2)該項產業的廠商供應 鏈具有較佳的調整彈性,足以反映在經濟 全球化環境下廠商供應鏈的變化情形,以 及其對貨運需求之影響;(3)與其它產業相 較,該項產業之產品具有短生命週期的特 性,易於反映產品在生命週期不同階段的 特性,並希望藉由對資訊電子廠商供應鏈 調整模式與作法的瞭解,推估其對貨運需 求可能產生的影響。同時,再以資訊電子 產品國際分工製造的發展歷程,作為後續 分析整體產業全球化趨勢下,對運輸需求 及運輸產業衝擊的基礎。 本研究以台灣地區資訊電子產業已獲 准於資本市場公開發行股票籌集資金的廠 商,合計 152 家,作為調查的對象。調查 期間自 1998 年 7 月起至 1999 年 9 月底完 成。 (二)、研究成果 由本研究的調查資料分析發現,我國 資訊電子廠商的生產活動的確存在明確的 國際分工現象,即廠商對其供應鏈中的生 產活動的確有進行「空間」上的分散調整。 同時,有相當比例的廠商前往海外設廠生 產的原因在於尋求較便宜、較具比較利益 的生產投入要素。 其次,廠商供應鏈的調整作法的確會 因產品在生命週期的不同階段而有所差 異。基本上,廠商供應鏈隨著產品生命週 期不同階段而有「空間」上的調整,由「集 中」於國內製造逐漸調整「分散」至不同 地點製造。在「時間」上的調整,則因產 品所處生命週期階段的不同而可歸納出四 種類型。 (1) 處於「推廣期」階段的產品,在製造 與物流作業上,傾向於採「提前」或 維持不變的策略; (2) 處於「成長期」階段的產品,在製造 上多採「提前」或維持不變之策略, 在物流上亦採「提前」或維持不變之 策略; (3) 處於「成熟飽和期」階段的產品,在 製造上多採「提前」策略,少部分廠 商採維持不變之策略,在物流上則多 採「延後」策略; (4) 處於「衰退期」階段的產品,在製造 上多採「延後」策略,在物流上亦多 採「延後」策略。 此外,廠商供應鏈活動在空間上的調 整的確會影響運輸需求的起迄點,同時, 若廠商採取時間上的延後策略,則必須利 用速度較快的運輸服務,始足以滿足交貨 的需求。 關於不同區位運輸服務的提供是否會影響廠商供應鏈的調整方面,首先,在廠 商考慮是否對供應鏈活動進行「空間」調 整的階段並不受到該區位是否具有充分的 運輸服務所影響,惟一旦決定進行「空間」 調整時,設廠地點的運輸服務供給條件的 確是廠商考慮的因素之一;另一方面,當 廠商採取「時間」上的「延後」策略時, 廠商也會將運輸服務的供給納入考慮。 最後,本研究也發現對於資訊電子廠 商而言,運輸成本並不是其調整供應鏈時 的重要考量因素。 (三)討論 整體而言,本研究發現在電子廠商供 應鏈的調整作法上,的確隱涵了空間上「集 中」 「分散」以及時間上「延後」 「提 前」之概念,祇是目前尚未形成模式化, 如何經由更大規模的調查深入瞭解不同產 業的供應鏈特性,在廠商供應鏈的調整與 運輸需求之間,建立量化分析模型,將是 後續研究的課題。 此外,許多台灣電子廠商採用的「代 工製造」模式,由於利用此種模式製造的 產品多半已進入「飽和期」以後的生命週 期階段,在此階段廠商除了必須降低製造 成本外,加強運輸效率以提昇對顧客的服 務水準,將是必然的作法。任何產品,當 進入「飽和期」或「衰退期」階段,隨著 製造地點的外移對運輸服務速度的要求將 會提高,再加以廠商「延後」策略的應用, 接單後急迫的交貨時間,均更需結合快速 運輸服務始足以滿足整個供應鏈的運作。 就台灣資訊電子廠商供應鏈調整對運輸需 求的影響而言,我國廠商供應鏈在「空間」 上的「分散」將減少我國的總體貨物運輸 需求;在「時間」上的「延後」則將使高 速運輸服務需求大為增加。 在後續研究的建議方面,除了構建量 化模型說明廠商供應鏈調整對運輸需求之 影響外,若能針對其它產業進行類似的調 查分析,亦將有助於尋求一個一般化的原 則,供業者及政府部門參考。
四、研究成果發表
本研究成果部份已發表或投稿於國內 外相關學術期刊,茲臚列如下。1. Feng, C.M. and K. C. Chia, “Logistics Opportunities in Asia and Development in Taiwan,” Transport Reviews, Vol. 20, No.2, pp.255-263, 2000.
2. Chia, K.C., C. M. Feng and C. J. Chang, “The Effects of Global Logistics Strategies on International Freight Transportation Demand,” submited to the Journal of Eastern Asia Society for Transportation Studies (EASTS), 2001.
3. Feng, C. M., C. J. Chang and K. C. Chia, “A survey analysis of supply chain adjustment for Taiwanese information technology firms,” Transport Reviews,
五、參考文獻
1. 王立志,系統化運籌與供應鏈管理,滄海 書局,民國88年。 2. 行政院經濟建設委員會,「知識經濟與臺 灣產業結構轉變」,民國89年。 3. 賈凱傑、馮正民,「企業產銷需求變遷下 之物流競爭策略— 以資訊電腦業為例」, 1999 國 際 物 流 研 討 會 論 文 集 , pp.333-342,民國88年。4. Beamon, B.M., “Supply Chain Design and Analysis: Models and Methods,”
International Journal of Production Economics, Vol. 55, pp.281-294, 1998. 5. Birou, L.M., Fawcett, S.E. and Magnan,
G.M., “The Product Life Cycle: A Tool for Functional Strategic Alignment,”
International Journal of Purchasing and Materials Management, pp.37-51, Spring 1998.
6. Bowersox, D. and Daughery, P., “Logistics paradigms: the impact of information technology,” Journal of Business Logistics,
16(1), 65-80, 1995.
7. Chikan, A., “Integration of production and logisitcs – in principle, in practice and in eduction,” International Journal of Production Economics, Vol. 69, pp.129-140, 2001.
8. Christopher, Martin, Logistics and Supply
Chain Management, 2nd edition, Practice Hall, 1998.
9. Cooper, J.C., “Logistics Strategies for Global Businesses,” International Journal of Physical Distribution and Logistics Management, 23:4, pp.12-23, 1993.
10. Cooper, M.C., D.M. Lamber, and J.D. Pagh, “Supply Chain Management More Than a
New Name for Logistics,” The Internal Journal of Logistics Management, pp.1-14, Vol. 8, No. 1, 1997.
11. Crainic, T.G. and Laporte, G., “Planning Models for Freight Transportation,”
European Journal of Operational Research, 97, pp.409-438, 1997.
12. Curry, J. and Kenney, M., ”Beating the clock: Corporate responses to rapid change in the pc industry,” California Management Review, Vol. 42, No. 1, 8-36, 1999.
13. Dicken, P., Global Shift – The Inter nation-alization of Economic Activity, The Guilford Press, 1992.
14. Dornier, P. P., Ernst, R., Fender, M. and Kouvelis, P., Global Oper ations and
Logistics, John Wiley & Sons, Inc, 1998.
15. Feng, C. M. and K. C. Chia, “Logistics Opportunities in Asia and Development in Taiwan, Transport Reviews, Vol. 20, No.2, pp.255-263, 2000.
16. Ganeshan, R., Jack, E., Magazine, M.J. and P. Stephens, “A Taxonomic Review of Supply Chain Management Research,”
Quantitative Models for Supply Chain Management, pp.841-879, Kiuwer Acada-mic Publishers, 1999.
17. Garrido, R. A. and Mahmassani, H. S., “Forecasting freight transportation demand with the space - time multinomial probit model,” Transportation Research part-B, 34, 403-418, 2000.
18. Gustin, C., Daugherty, P. and Stank, T., “The effects of information availability on logistics integration,” Journal of Business Logistics,16(1), 1-21, 2000.
19. Healey, M.J. and Ilbery, B.W., Location
and Change – Per spectives on Economic Geogr aphy, Oxford University Press, 1990.
20. Higashi, N. and Okawa, M., “Strategic Alliances in the Electronics Industry,” NRI Quarterly – Spring 1994, pp.62-85, 1994. 21. Lambert, D., “Developing a customer
focused logistic strategy,” International Journal of Physical Distribution & Logistics Management, 22(6), pp.12-19, 1993.
22. Langevin, A., Mbaraga, P. and Campbell, J. F., “Continuous Approximation Models in Freight Distribution: An Overview,”
Transportation Research Part B, Vol. 30, pp.163-188, 1996.
23. Langevin, A., Mbaraga, P. and Campbell, J.F., “Continuous Approximation Models in Freight Distribution: An Overview,”
Transportation Research – B, Vol. 30, No. 3, pp.163-188, 1996.
24. Lehmusvaara, A., “Transport Time Policy
and Service Level as Components in Logistics Strategy: A Case Study,”
International Journal of Production Economics, 56-57, pp.379-387, 1998.
25. McGinnis, M. and Kohn, J., “Logistics strategy, organizational environment, and the time competitiveness,” Journal of Business Logistics, 14(2), 1993.
26. Novack, R., Rinehart, L. and Wells, M., “Rethinking concept foundations in logistics management,” Journal of Business Logistics, 13(2), pp.233-267, 1992.
27. Ortuzar, J. de D. and Willumsen, L.G.,
Modeling Tr anspor t, John Wiley & Sons
Ltd., 1990.
28. Pagh, J.D. and Cooper, M.C., “Supply Chain Postponement and Speculation Strategies: How to Choose the Right Strategy,”Journal of Business Logistics, Vol. 19, No.2, 13-33, 1998.
29. van Hoek, R. I., van Dierdonck, R., “Postponed manufacturing supplemen-tary to transportation services?” Trans-portation Research Part E, Vol. 36, pp.205-217, 2000. 30. Wyland, B., Buxton, K. and B. Fuqua,
“ Simulating the Supply Chain,” IIE Solutions, pp.37-42, January 2000.
31. Zinn, W. and Bowersox, D.J., “Planning Physical Distribution with the Principle of Postponement,” Journal of Business Logistics, Vol. 9, pp.117-136, 1998.
32. Zlatoper, T.J. and Austrian, Z., “Freight Transportation Demand: A Survey of Recent Econometric Studies,” Transportation, 16, pp.27-46, 1989.
TRANSPORT REVIEWS, 2000, VOL. 20, NO. 2, 257-265.
Logistics Oppor tunities in Asia and Development in Taiwan
CHENG-MINFENG**and KAI-CHIEHCHIA
Institute of Traffic and Transportation, National Chiao Tung University, 4F, 114, Sec. 1, Chung Hsiao W. Rd., Taipei, Taiwan
The economy in Asia is growing rapidly. As a consequence, transportation and communication technologies and the changing needs of customers and shippers have resulted in Asian and Taiwan’s logistics being in transition. This paper discusses why logistics changes, and explores the opportunities for Asian logistics development. The issues of logistics perspectives of private sectors in Taiwan are then raised. Finally, logistics development in Taiwan is described.
1. Why does logistics change?
Logistics has rapidly changed as a result of the growing globalization of business, changing technologies, organizational patterns, deregulation policies and governmental infrastructure. For example, the multinational company, which is engaged in multinational production, is the typical organization in the free enterprise world of today. Also multiple-site manufacturing and assembly is the usual practice.
There are a variety of reasons for the needs of production dispersal. One main reason is the existence of comparative advantage, which leads to trade between two regions. Trade is generally beneficial if transport costs are relatively small compared with production cost. If the net gains from trade are considered to be positive, specialization in production will occur. Global trade, based on factor endowment and government regulations, covers the transfer of resources, including capital, labour, technology, management and know-how, as well as raw materials, semi-manufactures, components and end-products, from one nation to the other. The supply-chains and the movements of all those materials and products are the subject matter of logistics.
2. Oppor tunities for Asian logistics
Some indicators (CEPD 1998; IATA 1997) used to show the growing Asian markets are as follows.
• Gross Domestic Product (GDP) for Asia-Pacific will be higher than that for either North America or Europe by 2010. Among these three regions the market share of Asia-Pacific will be 37.1% by 2010.
• Relaxation of government regulations on trade and transportation has resulted in free flow of cargos, passengers, information and capital.
• According to the IATA, the Asia air cargo market accounted for well over one-half the world market (59%) in 1992, and is expected to continue to grow.
• According to Boeing World Air Cargo forecast (Boeing 1998), the air cargo growth rate in 1992-2010 is 9.3% for Intra-Asia, 7.9% for USA-Asia and 7.4% for Europe-Asia, all of which are above the world average of 6.8%. Intra-Asian growth has been the most rapid, due to the rapid market development in Japan, Hong Kong, Taiwan, and China during 1980-90.
• Asia air express cargo is also growing very fast, with volume at least double that of other
**
major markets. For example, the express cargo growth rate in 1991-93 was 25% in Asia, 12% in Europe and 8% in North America. The customers in Asia rely heavily on the services of express carriers, especially on those of the integrated carriers.
• Between 1995 and 2010, Asia-Pacific international scheduled passenger traffic will grow at a projected average annual rate of growth of 7.4%. At the same time, international scheduled traffic for the rest of the world is forecast to grow by 4.4% per annum on average.
• By 2010, Asia-Pacific traffic will amount to 393 million passengers. This is an almost three-fold increase in the 15-year forecast period.
• The global share of Asia-Pacific international scheduled passenger traffic increased from 26.2% in 1985 to 35.2% in 1995. It will increase to nearly 50% by 2010.
• Europe was and will remain the most important world region for long-haul international passenger traffic to and from Asia-Pacific. By 2010, there will be 57.8 million passenger between Europe and Asia-Pacific. The main region-pairs, within North-east Asia, between North-east-South-east Asia and within South-east, will remain within the Asia-Pacific Area.
• Asia is particularly attractive in container shipping because return on sales was 5.7% in 1992 for transpacific routes, the only profitable long-haul routes, while it was -22.3% for transatlantic routes and -6.8% for North Europe-Far East routes.
According to the above indicators, opportunities for Asian logistics development are as follows: (1) strong economic growth in Asia Pacific area, (2) increasing disposable income, (3) intensification of inter- and intra-Asia-Pacific trade, (4) continuing deregulation and liberalization policies and (5) significant development of transportation infrastructures.
3. Per spectives of pr ivate sector in Taiwan
The total area of Taiwan is 36,300 square kilometers (14,000 square miles), which is slightly smaller than The Netherlands and Switzerland. Since the island is largely mountainous, Taiwan is the second-most densely populated country in the world, with a population of over 21 million, or 582 persons per square kilometer. The change in industrial structure in Taiwan has been accompanied by sustained economic growth. Table 1 reflects the growth of both GDP and GNP over the last few years.
Taiwan’s economy is highly dependent on foreign trade. Accordingly, most major industries are export-oriented or are suppliers for export industries. The appreciation of the New Taiwan dollar and increasing wage costs mean that labor-intensive industries are facing fierce competition from neighboring lower-cost countries. Consequently, Taiwan is focusing increasingly on higher-value quality products and on high-technology industries for domestic production and is moving labour-intensive industries to South-east Asia and Mainland China.
International trade is the mainstay of Taiwan’s economy. Table 2 summarizes major import and export commodities and trading partners. Taiwan has since the end of the 1980s embarked on a policy of reducing or removing controls on imports and reducing import tariffs.
Below is a summary of the report of the Council for Economic Planning and Development (CEPD) of Taiwan, where Taiwan’s existing strengths and weaknesses in developing into a regional center in the Asia-Pacific area are assessed through interviews (CEPD 1994). The selected managers of local and foreign private sectors are grouped into two categories: transportation logistics companies and production logistics companies. The former category represents companies whose core business is freight transportation, and with which the multinational has established a long-term relationship. Federal Express (FedEx) and United Parcel Service Inc. (UPS) are two examples of these companies. The latter category
represents companies whose core business is supply chain-related manufacturing and assembly, and the logistics function in these companies may be operated by an in-house department. Examples are the computer companies of ACER and Compaq.
Table 1 GNP, GDP, NI, and the economic growth rate of Taiwan from 1991-1997
1997 1996 1995 1994 1993 1992 1991 GNP (Million USD) 285,300 274,600 263,000 243,900 226,200 216,300 185,600 Per capita GNP (USD) 13,233 12,838 12,396 11,579 10,852 10,470 8,982 GDP (Million USD) 283,636 272,307 260,175 240,986 222,604 212,150 179,370
Economic Growth Rate
(%) 6.81 5.67 6.03 6.54 6.32 6.76 7.55
Per Capita National Income (USD)
12,019 11,635 11,276 10,566 9,872 9,536 8,189
Source: Directorate-General of Budget, Accounting and Statistics, Taiwan (1998).
Table 2 The major trading commodities and partners Major Import
Commodities
Oil, Machinery, Electrical products, Chemicals, Steel, Steel work, Beverages, Tobacco, Motor vehicles, Delivery equipment, Metal products, Electrical machines
Major Export Commodities
Electronic products, Garments, Yarns, Shoes, Toys, Sporting goods, Base metal, Metal products, Machinery, Motor vehicles, Delivery equipment, Plastics.
Major Trading Partners
USA, Japan, Hong Kong, Germany, Singapore, UK
Source: CEPD (1994).
The comments on the perspectives of private sectors in Taiwan are as follows. (1) Transportation logistics companies
• An air hub is needed in Taiwan to cope with the strong growth of the Asian market. • A regional hub in Asia is needed to serve the rapidly growing Intra-Asia volumes. • There is a growing opportunity in express air cargo for Taiwan to meet the needs of
just-in-time (JIT) delivery.
• Since the logistics business is very sensitive to time, the less time the transportation takes the better.
• Airports serving the express cargo business and providing efficient operations are needed. Those airports that have strict regulations will be significantly less attractive. • Customs services in airports operating on a 24-h basis are needed. Customs
paperwork should be replaced with EDI (Electronic data interchange), which can immensely accelerate customs clearance.
• A good network of flights would help provide flexibility in scheduling and goods delivery. It is better to have direct access to Mainland China, which has a
• Current regulations and restrictions constrain shipping operations in distribution activities and in utilizing berth and warehouse capacity.
• Foreign ocean carriers demand to extend their marine transport to the inland trucking market on condition of reciprocity.
To improve company competitiveness, the Taiwan and foreign managers of express carriers call for their own facilities to get control over their cargo handling, efficient customs procedures and 24-h operations for fast throughput time, and frequent flights to many regional destinations, including China.
(2) Production logistics companies
• Products can be developed quickly enough without a good industry infrastructure and supplier network.
• A more open trade relationship is needed, especially with mainland China. • Partnerships with foreign multinational companies are needed.
• Attracting more foreign direct investment will help Taiwan to further improve productivity.
• Low cost of land and labour for manufacturing our products are required. • Language barriers exist, as English is not sufficiently used in many situations. • An advanced information and telecommunications infrastructure is required. • Entering the global trade economy and in particular joining the World Trade
Organization (WTO), is essential.
The Taiwan and foreign managers of production firms require a good industry infrastructure and supplier network to manufacture competitive products, fewer restrictions on trade with mainland China, extensive partnerships with foreign companies, low costs for land and labour for manufacturing, an advanced information and telecommunications infrastructure, and membership in the global trade economy.
4. The development of logistics in taiwan
Taiwan is an export-oriented country. Along with the increase of international trade and economic development, the volume of logistics has increased rapidly. According to the 1996 survey of the Institute of Transportation, Ministry of Transportation and Communications, the total amount of the logistics flow, including sea transport, ground transport and air transport, is nearly 13% of the total GDP with 973 billion NT dollars (nearly US$35.40 billion) annually (Institute of Transportation, MOTC 1998).
4.1 The problems
Facing the quickly changing environments, some problems of Taiwan’s local logistics firms arise as follows:
(1) Infrastructure. Traffic congestion is an obstacle to the growth of logistics. The loading and unloading of cargos during normal working hours is considered to be the main cause of congestion in urban areas. A lack of parking space and traffic congestion in urban area has become a common phenomenon and leads to rapidly
increasing transport costs. Consequently, as far as cost is concerned, the domestic transport system may not support the JIT delivery requirements.
(2) Economic and Financial. Mounting demand and international competition have influenced the structure and location of industry as well as the local and international division of labour. Some advanced large companies in Taiwan could adopt new organizational structures and use advanced logistics services to maximize profit. However, most middle-sized and small logistics firms in Taiwan cannot react quickly to the changing market and new technologies. As a result, their competitiveness will not be based on efficiency but rather on drastically reduced prices.
The high land prices and land-use limitations are hindering the development of the logistics industry. The high cost of labor and labor shortage had resulted in increasing logistics costs.
(3) Legal and Administrative. The current land-use regulations do not give enough incentives to the establishment of a distribution center. The current regulations in the areas of Aviation and Harbour are outdated. The result is that airport and harbour pricing are less attractive and customs procedures are not efficient.
To enhance efficiency and competitiveness, the logistics firms have focused on the following areas:
l making smart investments on infrastructure equipment;
l supporting the usage of new technologies such as EDI to rationalize their distribution channels;
l encouraging multi-modal and cooperation between international logistics firms; l developing joint distribution centers in the vicinity of metropolitan areas;
l improving the existing distribution channels to achieve an advanced logistics system; and
l enhancing the safety of distribution process.
4.2 Governmental actions
In addition to supporting a well-developed distribution and manufacturing center in Asia-Pacific region, Asia-Pacific Regional Operation Center (APROC) plan has been in place for 3 years. However, government agencies have spared no effort in carrying out market liberalization and internationalization. The current logistics-related actions taken by governments are described as follows.
(1) Transportation infrastructure construction. The infrastructure projects of air, sea and ground transport have been continuously undertaken and government agencies are engaged in the introduction and operation of new transport technologies to improve the service level of the transportation systems.
(2) Developing Taiwan as the Operation Center of Asia-Pacific Region. The purpose of developing Taiwan as an Asia-Pacific operation center is to attract enterprises to use Taiwan as their production, logistics and marketing bases for delivering high value-added goods to this region. The APROC plan will develop six specialized centers. In these, “software” programs are being re-engineered for the purpose of revamping the legal and macro-economic environment on Taiwan. Of these six centers, three will be aimed at developing the air transport, sea transport and telecommunications, which will lead to providing high quality infrastructure services to logistics firms.
(3) Civil Aviation Law amended. Revisions involving 117 articles of the Civil Aviation Law were adopted by the Legislative Yuan of Republic of China on 30 December 1997, with two revisions directly affecting foreign airline companies. First, the new provisions stipulate that for air cargo-forwarding companies, ground stations and cargo distribution companies, foreign capital shares and the number of foreign board members may represent 50% of the total shares or board seats, compared with only one third in the previous regulations. Second, airline companies can adjust their international flight fares on their own and later file a report with the authorities. This dispenses with the prior-approval system on pricing schedule for international flights. (4) Customs surcharge reduced. The Ministry of Finance (MOF, 1998), under a customs
regulation revision finalized in February 1998, drastically reduced the customs surcharge on export inspections to save time and to reduce costs of exporters.
(5) EHU (Express Handling Units) clearance limitations relaxed. Efficiency of customs clearance should be improved. Reducing the present customs clearance down to a par with Singapore’s 2-4h or Hong Kong’s 2-6h customs clearance is planned under which the average clearance time for air cargo will be reduced to 4h from 3 days.
New clearance regulations which became effective in August 1997 scraped the old rules that stipulated that EHU cargoes could not exceed NTD20,000 for non-export-and-import-controlled goods. The new regulations only prescribe that EHU cargoes shall not exceed 70 kg compared to 40 kg in the old regulations. The value requirement has also been scrapped. Goods that are subject to import and export control can also go through the EHU.
After the establishment of EHU at the CKS airport in December 1995, incoming cargoes into the units increased by nine times and outgoing ones jumped by 30 fold, representing 1.3% of the cargo handling in the airport. Adding those handled in the on-board-courier handling units (OBC), cargoes handled at OBC and EHU accounted for 3.3% of the total air cargo volume of CKS airport.
(6) Twenty-four-hours customs clearance at CKS International Airport. The CKS international airport announced that 24-h cargo claims would be expanded to general commodities, which had been inspected and checked in the past. Those eligible for 24-h claim include cargoes which do not require paper verification and inspection, cargoes which have passed paper verification and inspection, cargoes which have passed paper verification and inspection, and those imported to export processing zones and science-based industrial parks. The 24-h cargo claim operation is open 7 days a week.
(7) Pre-clearance system for air cargo. The implementation of preclearance system will significantly improve the efficiency of import clearance. Under the new system, airline companies can send through a computer network the manifest, declaration paper, and other documents to customs before the arrival of cargo. Customs may inform the customs agents whether those cargos must proceed for inspection. If not, cargo can be cleared within 24 h of arrival.
(8) Harbour charges lowered and foreign investment limitation reduced. The government finalized the revision of relevant rules in September 1997 and reduced the harbour construction fee from the previous 0.5% of cargo value to 0.4%. Also, the government raised the foreign investment ceiling in container yards.
In September 1997, the MOTC adjusted many tariff charges at international ports. The tugboat charge was reduced to 30% from 50%. Warehousing and container yard rental fees will be given a 20% discount. Warehousing charges will be voided for bulk carrier goods which stay in warehouses no more than five days. The loading cost of refrigeration boats will be reduced by 10%, while the rental of cranes and
other machinery will be reduced by 20%.
(9) Warehousing centers in Kaohsiung, Taichung launched. The Taiwan Export Processing Zone Administration formally established a branch office in Taichung Harbour and two branch offices in Kaohsiung Harbour in December 1997 to promote the transforming of processing zones into warehousing centers.
The warehousing center will attract high-tech manufacturing enterprises, warehousing and distribution companies, and other related service firms.
(10) Airport city development plan. The airport city development plan was approved in October 1997, and the local government started land acquisition. This marked the beginning of constructing a large-scale airport city, covering a total of 63 hectares of land around the CKS international airport, and accommodating a projected cargo volume of 1.2 million tons per year, up 10.4% from the present 732,000 tons.
The government plans the construction of the bonded warehouse, value-added operations and distribution centers. The primary construction plan will be finished by 1999. Private participation will be encouraged.
(11) Federal Express, UPS and DHL expand operations. The UPS Logistics Center in Taiwan began operation in November 1997 to provide value-added distribution, inventory management and warehousing services to customers all over the Asia-Pacific region. This could drastically reduce the time and cost of inland transport and warehousing.
The Federal Express CKS transport center covering 1,700 square meters began operations on 11 November 1997. The transport center provides 24-h customs clearance services. Its speedy sorting system can process 3,000 pieces of cargo per h. The new center will be able to provide more streamlined services.
DHL has upgraded its competitiveness by enhancing its point-to-point international courier services with distribution functions. It is constructing its distribution and inventory center near the CKS Airport.
The integrated logistics firms, e.g. UPS, FedEx and DHL, combine distribution, transport and advanced electronic-data-interchange (EDI) know-how to serve industries in inventory management, warehousing, sorting or assembling, and overnight handling to provide fast delivery service for manufacturing and high-tech industries.
(12) Air cargo terminal privatized. Privatizing the cargo terminal in CKS airport is the government policy. It is expected that privatization and integrating the upstream and downstream delivery services will make proper adjustments in hardware installation and will streamline procedures to upgrade clearance efficiency.
(13) New highway law takes effect. The revised Highway Law took effect on 1 November 1997, opening the market for the leasing of small passenger cars, automobile cargo transport, and automobile container transport to foreign investors. (14) Land use release. Some farm and open land will be released for use such as car
parks and distribution operation centers by logistics firms.
5. Conclusion
With the growth of globalized business, advanced technologies development, international specialization of labor, continuing deregulation and liberalization policies and governmental infrastructure improvement, the logistics market opportunities in Asia are attractive. But the logistics services required by customers have also become increasingly more complex and demanding. Faster and more sophisticated logistics for companies are needed to meet the changing needs of customers and shippers.
within transportation logistics companies recommended that government authorities continuously improve infrastructure facilities and develop regional hub operations to serve the rapidly growing freight demand. The express carriers’ managers call for efficient cargo handling and 24-h operations in airports to improve company competitiveness.
On the other hand, the managers in production logistics companies focused on the macroscope recommendations of Taiwan’s logistics development, such as gradually eliminating political barriers with mainland China, establishing partner-relationships with multinational companies, and entering the international World Trade Organization (WTO).
Following the perspectives of local and foreign logistics companies and reviewing the existing difficulties of logistics development in Taiwan, government agencies in Taiwan have taken several logistics-related actions to deal with aspects of the infrastructure, finance, legal regulations and administration to reduce the obstacles such as tariffs, import restrictions, etc. that the private sector encounters in conducting international business. Confronted with a fierce and constantly changing competitive environment, even with numerous opportunities, the government still has to improve the hardware and software performance to enhance the competitiveness of the logistics industry.
Refer ences
Boeing Co. Commercial Airplane Group, 1998, World Air Cargo Forecast: Significant World Airline Trends-1998 (Seattle: Boeing Co.).
CEPD (COUNCIL FOR ECONOMIC PLANNING AND DEVELOPMENT), 1994, Developing Taiwan
into a Regional Operations Center (Taiwan: CEPD).
CEPD (COUNCIL FOR ECONOMIC PLANNING AND DEVELOPMENT), 1998, Taiwan Statistical
Data Book— 1998 (Taiwan: CEPD).
DIRECTORATE-GENERAL OF BUDGET, ACCOUNTING AND STATISTICS, 1998, Statistical Abstract of National Income in Taiwan Area of the Republic of China (Taiwan: CEPD).
INSTITUTE OF TRANSPORTATION, MINISTRY OF TRANSPORTATION AND COMMUNICATIONS,
1998, A Survey on the Origin – Destination Data of the Export – Import Commodities in Taiwan Area (Taiwan: MOTC).
INTERNATIONAL AIR TRANSPORT ASSOCIATION, 1997, Asia-Pacific Air Transport Forecast
(1980-2010) (IATA).
MOF (MINISTRY OF FINANCE), 1998, Monthly Statistics of Exports and Imports, Taiwan Area,
THE EFFECTS OF GLOBAL LOGISTICS STRATEGIES ON
INTERNATIONAL FREIGHT TRANSPORTATION DEMAND
Kai-Chieh CHIAPh.D Candidate
Institute of Traffic and Transportation National Chiao Tung University
4F, No.114, Chung Hsiao W. Road, Sec. 1 Taipei, Taiwan
Fax: +886-2-2382-2278 E-mail: [email protected]
Cheng-Min FENG Professor
Institute of Traffic and Transportation National Chiao Tung University 4F, 114, Sec. 1, Chung Hsiao W. Road Taipei, Taiwan
Fax: +886-2-2382-2278
E-mail: [email protected] Chia-Juch CHANG
Vice Minister of Transportation and Communications & Professor of National Chiao Tung University and National Taiwan University
2, Chang Sha St., Sec. 1, Taipei, Taiwan
Fax: +886-2-2371-7990
Abstr act: For years, researchers and practitioners have investigated growing business
globalization trends and international freight transportation forecasting. However, there are few discussions of the interrelationships between globalized business and its effects on international freight flow. This study reviews the experiences of multinational companies and surveys 152 Taiwanese IT firms to provide a detail picture of existing global logistics operations. It was found that the logistics strategies of the manufacturing supply chain will affect a firm’s modal choice, and that the multiple-site of the multinational production logistics strategies will affect the trip generation and distribution. This paper also seeks to highlight gaps in the literature and issues for future research.
Key Wor ds:global logistics strategy, multinational companies, international freight
transportation, information technology industry
1. INTRODUCTION
Logistics has been rapidly transforming as a result of the growing globalization of business and changing technology. The globalization of the manufacturing industry refers to the internationalization of the manufacturing supply chain. Changes in geographical location or customers’ expectations continually transform the nature of markets, applying pressures that in turn, cause the redirection of product flow within a firm generate. Advanced technologies allow for methods of adjusting the flow of raw materials, semi-finished goods, products, and spare parts. In this process, the demand of freight transportation services that support the delivery of goods also changes. Traditional freight transportation studies assumed that manufacturing activities were concentrated at a single manufacturing location, therefore these studies are inadequate at describing the operations of today’s multi-national manufacturing supply chain.
Information-technology (IT) manufacturing firms in Taiwan have realized the changing dynamics of the global market, adjusting their logistics strategies to meet the needs of multiple-site and multinational production and assembly. The adjustment of logistics strategies in Taiwanese IT firms has contributed to the change of international freight transportation demand to and from Taiwan. This study aims to explore the effects of logistics strategies on international freight transportation demand, examining the change of trip generation, trip distribution and modal choice.
This study first explore and categorize the logistics strategies, taken by Taiwanese IT firms. One Taiwan firm that is worth discussing is the Acer Corporation. This company has set up multiple manufacturing sites in Southeast Asian countries and Mainland China to exploit the comparative advantages of lower land and labor costs. The supply-chain and the movement of all these materials and products lead to the change of transportation demand among Taiwan, offshore factories and marketplaces. Secondly, this study analyze how logistics strategies affect the international freight transportation demand pattern and by what degree. For this analysis, a questionnaire was designed to survey executive managers of 152 IT firms in Taiwan to better understand the approaches that these companies take to implement logistics strategies and the impact of these logistics strategies on transportation demand.
This article is organized as follows. Section 2 briefly examines the literature on logistics strategies and freight transportation demand given an overview of previous research. Section 3 describes logistics strategies as related to Taiwanese IT firms. Section 4 presents the impacts of various logistics strategies on international freight flow. Conclusions and prospects for future research follow.
2. LITERATURE REVIEW
There has been extensive research on logistics and freight transportation. This research has primarily focused on traditional logistics issues, which develop solutions only for implementation at a central location. The Council of Logistics and Management (1993) defines logistics as “the process of planning, implementing, and controlling the efficient, effective flow and storage of goods, services, and related information from a point of origin to a point of consumption for the purpose of conforming to customer requirements.” The components of a logistics system may include some or all of the following: suppliers, production facilities, transshipment points, and demand points. Distribution of freight from origin to destination is the core of logistics (Langevin, 1996). Moreover, as industry globalizes, logistics will involve more material flows through a supply chain that extends beyond national borders. The global company seeks to achieve a competitive advantage by identifying world markets for its products and developing a manufacturing and logistics strategy to support its marketing strategy. A successful company in the global marketplace will disperse production and assembly facilities across multiple regions to meet the needs of overseas markets using global logistics channels to supply these facilities (Christopher, 1998). The cost-efficient arrangement of transportation and storage is a major issue when planning a logistics strategy. Before the first half of the 1990s, the function of logistics was to minimize total distribution costs and maximize profits, while achieving desired levels of service performance (Lambert, 1993; CLM, 1986; Gustin et al., 1995; Langevin, 1996). Today the aim focuses on maximizing manufacturing flexibility both inside and outside the firm towards customization at the minimum cost (Bowersox and Daugherty, 1995a; Novack et al., 1992). This means that logistics is now directed towards supply chain issues. Moreover, the aim of a firm’s logistics strategy is to exploit the firm’s unique product assembly and delivery features, to maximize profit and service, thus leading to competitive performance (Bowersox and Daugherty, 1995b).
Behind the expanding trend of globalization in logistics, there are several factors reshaping logistics operations and strategies. These factors are (Cooper, 1993): the globalization of markets, cheaper communications, removal of barriers to trade and foreign investment, achieving economies of scale in business, innovation in logistics, and decreasing transportation unit costs. These factors tend to increase world trade and the worldwide specialization of production. This means that freight transportation between continents and between countries will not necessarily increase with the growth of the world economy, but instead grow and diversify with the specific demands of the various regional markets (Lehmusvaara, 1998).
These operations can not only be measured by the yardstick of a nation’s gross national product (GNP), but must also be evaluated by the increasing influence that the transportation and distribution of goods have on the performance of almost all other economic sectors (Croinic et al., 1997).
On the other hand, Qrtuzar (1990), Langevin (1996), Crainic et al. (1997), Feng et al. (2000) and Garrido et al. (2000) all provide reviews on the solution approaches in freight transportation. They indicate that current freight transportation research tends to emphasize the role and importance that freight transportation plays in the overall manufacturing/ distribution processes. However, some of these previous analyses of freight transportation have suffered from a variety of shortcomings. First, most of these studies assume that product manufacturing is done at the factories in a concentrated area. Under the trend of globalized production, firms manufacture their products at diversified multiple-sites. The previous freight transportation studies are incapable of reflecting current manufacturing realities and the demands that firms currently placing on freight transportation services to meet their needs. Second, earlier studies were based on only a limited amount of data, and may not have captured all the effects of the international division of labor. Lastly, part of these previous studies underestimated the transportation demand incurred by the internationalization of production activity, since they do not take into account the dynamics of the interaction between a firm’s freight demand, and adjustments in the manufacturing supply chain.
While previous studies have highlighted characteristics of logistics strategy and freight transportation, to the best of our knowledge, none of the previous academic work has researched the influences of global logistics on international freight transportation demand.
3. LOGISTICS OPERATIONS OF TAIWANESE IT FIRMS
Logistics has rapidly changed as a result of the growing globalization of economies. The IT firms in Taiwan have realized changing needs, adjusted their logistics operations and engaged in multiple-site and multinational production and assembly. This study applied Taiwanese IT firms’ experiences to categorize the manufacturing firms’ logistics operations.
3.1 Types of Logistics Oper ation Str ategy
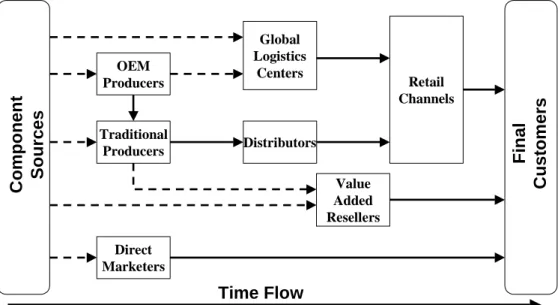
To establish an efficient international division of labor, Multinational Companies (MNCs) have created a network that addresses various needs when implementing value-added logistics. The experiences of IT industries supply the best cases to illustrate the evolution of logistics. The IT industry in this study refers to the manufacturing activities of firms involved in the following area: information hardware manufacturers (computer systems, peripheral equipment, important precision parts and components), consumer electronic manufacturers (audio products, video products, and other consumptive products) and semiconductor manufacturers (semiconductor manufacturing, semiconductor’s raw materials). The IT production supply chain begins with a variety of component producers, each of which specializes in a particular component, usually distributed on the open market or supplied on an Original Equipment Manufacturer (OEM) basis to assemblers. The various components provide different levels of value to the completed system.
Curry et al. (1999) summarized the four types of logistics channels of the PC industry and their possible interactions from component sources to final customers. See Figure 1. Firms often utilized more than one method depending on the products or the markets, and there is much variation from firm to firm.
The first type of logistics strategy is found in the conventional supply chain, parts and components are delivered to warehouses and stored until required for assembly. The finished products are then shipped through conventional distribution channels (i.e. to distributors), and on to value-added resellers (VARs) or to retail stores.
The second type of logistics operation is global logistics. In dealing with global logistics strategies are designed to meet globalized sourcing and distribution. Global logistics strategies are based on the recognition that system assembly is a low value-added, but time-sensitive, segment of the supply chain. Global logistics systems have been developed to manage the higher-value-added portions of the supply chain involving distribution, marketing, original design manufacturing (ODM), OEM manufacturing, and distribution as a complete service. The majority of the practitioners of global logistics are based in Taiwan. The distance between final markets and manufacturers has created a need for a system that would protect components from depreciation risks. The global logistics system pioneered by Taiwanese firms is a response to opportunities that arose in the mid-1980s to supply U.S. assembly firms with inexpensive components and even finished PCs on an OEM basis.
In an attempt to reduce inventory exposure, a number of the largest PC assemblers are shifting some final assembly operations to distributors, thereby completing the finished product closer to the final customer. Their aim is to decrease inventory and increase responsiveness. The firms handling this work are part of a broad and amorphous category called value-added resellers (VARs). VARs complete the final stage in the third type of logistics operations, which is a delivery-oriented approach. VARs include distributors of relatively large parts, components, and systems and they may perform specialized system integration, partial system assembly services, or even whole system contract assembly for large PC marketers. Channel assembly through VARs resembles the global logistics system, but the critical difference is that the VARs often perform a wider range of downstream functions. Channel assembly has two features that make it superior to the traditional model. First, it shortens inventory-holding periods. Second, once the contract is concluded and the PC specifications are agreed upon, the contractor need not be concerned about value erosion because the final agent in the VAR chain deals directly with the customer’s needs.
Direct marketing is the fourth type of logistics operation. The most serious competitive challenge to the established PC companies comes from direct marketers such as Dell Computer. These companies receive customer’s orders before they actually build a computer. This means they do not need to hold any inventory, thereby eliminating most inventory and concomitant risk (Curry et al., 1999). As Figure 1 indicates, the direct marketing model reduces the number of activities from the factory to delivery of the finished products to the customer to an absolute minimum.
Time Flow C o m p o n e n t S o u rc e s F in a l C u s to m e rs OEM Pr oducer s Tr aditional Pr oducer s Dir ect Mar keter s Distr ibutor s Global Logistics Center s Value Added Reseller s Retail Channels
Note: Broken lines indicate component flows, solid lines are finished systems.
3.2 Acer and Taiwanese IT fir ms’ exper iences
Acer Computer, founded in 1976, is the largest PC manufacturer in Taiwan. The company developed an order-based supply chain referred to as “Fast Food” operation and the “Client-Server” operating structure. Acer’s Fast Food model endeavors to establish an efficient international network of division of labor through its selective use of international freight transportation modal for the operation. Acer’s logistics strategy takes account of the rapid pace of change in customer needs using a logistics strategy that protects key parts with high added value from erosion. To eliminate this risk, parts are transported either by air or sea, depending on the degree of added value. Products with low added values, such as housing, power supply units, and floppy disk drives are normally carried by sea in order to reduce transportation costs. On the other hand, key parts with higher added value, such as CPUs, MPUs, hard disk drives, and memory chips are selected according to demand shifts and transported by air immediately prior to assembly if demand indicates the necessity. The selective choice of air or sea transportation services is common in the IT industry. The aim is to maintain the quality of parts used in finished products, ensure customer satisfaction, and at the same time, eliminate the risk of declines in the price of product inventory.
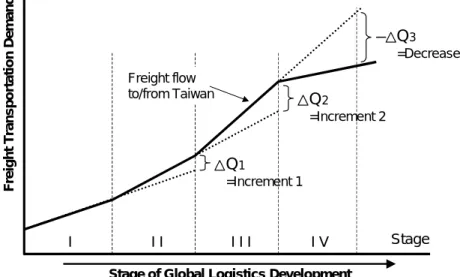
Because logistics strategies are dependent on a firm’s supply chain operation, we divided Acer’s logistics development into four stages in relation to changes in the supply chain. See Figure 2 and Figure 3. Before the late 1980s, during the first stage of Acer’s logistics development, the company concentrated all its production activities at a single geographical location and served its world markets through traditional logistics and marketing networks. At this stage, the main freight transportation demand was from Taiwan to the market countries. Moreover, the value density the value of a product in relation to its weight and volume --was low; as well as time --was not considered to be a critical business variable, leading to a large part of the finished products being transported by sea.
Since the 1990s, the second stage of Acer’s logistics development, Acer adjusted its supply chain as factories were relocated to Mainland China and Southeast Asian countries to utilize cheaper and cost comparative factors. Materials, semi-finished products, components and finished products were transported to the geographically dispersed manufacturing factories. In this stage, the output of a primary manufacturing factory in one country may simply be the input for a sub-assembly factory of Acer located in another country. The semi-finished products may be transported back to Taiwan for final assembly, then re-export to foreign markets. At this stage, the increment of transportation demand of semi-finished productsΔQ1, as illustrated in Figure 3, was generated along with the process of supply chain operation.
Stage I Area Factory Flow of finished products Flow of semi-finished products and components
Stage II Stage III
Stage IV
Taiwan
In the third stage, each of Acer’s offshore manufacturing factories performed an independent operation in the supply chain and ships output to a final assembly factory in Taiwan. After final assembly, the finished products were exported to the markets. Because the offshore factory was operated independently, the increment of transportation demand (ΔQ2) was fully reflected in the freight flow from Mainland China and Southeast Asian countries to Taiwan. But in recent years, the ability to respond to customers’ requirements in ever-shortening time-frames has become critical, has lead Acer to further adjust their supply chain operation. All of the outputs from each offshore factory are shipped directly to the final assembly factories in locations near the marketplace. This is the fourth stage of Acer’s logistics development, the physical flow of components and semi-finished products are not transported to Taiwan, freight flow between the offshore factory to the marketplace has increased and the freight flow to and from Taiwan has decreased (-ΔQ3). In the decision of modal choice, because the response time of IT industry operation has become shorter, air transportation services demand is increasing and sea transportation demand is decreasing.
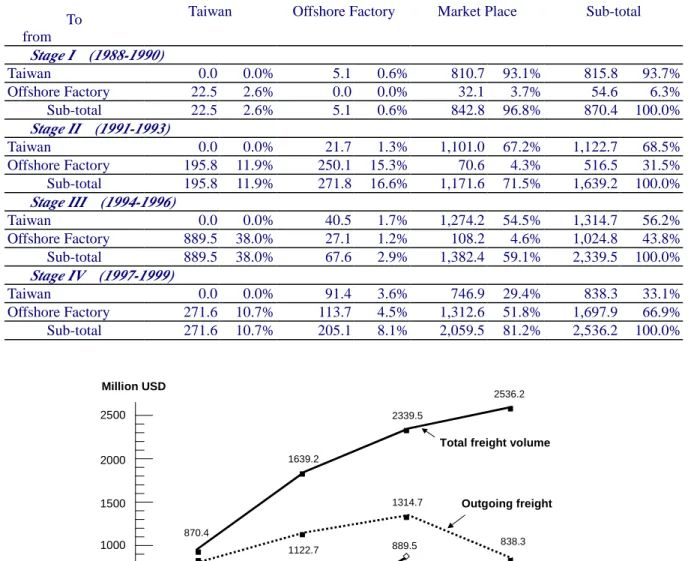
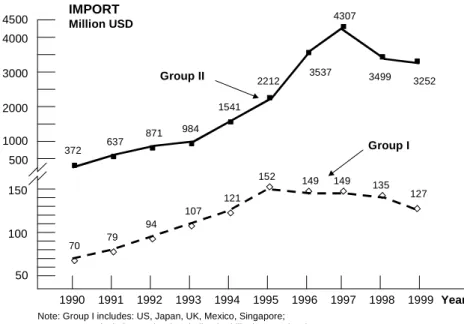
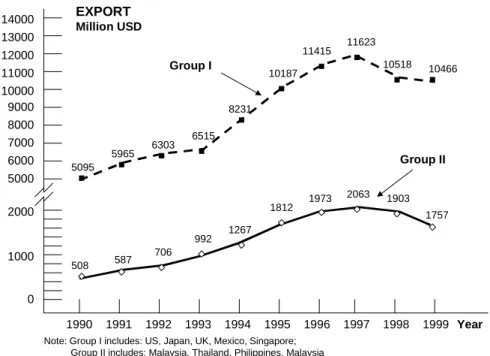
Because all of the movements of materials, semi-finished products, components and finished-products determine the freight transportation demand, the various stages of logistics development mentioned above will create different freight transportation demands in terms of trip generation and distribution. Table 1 compares the volume – measured in US dollar cost – of the Acer Group’s freight transportation between Taiwan factory, offshore factories (Mainland China and Southeast Asian countries) and market places over the years of logistics development from Stage I to Stage IV. The study found that the total freight movement of Acer Group increase in US dollars from 870.4 million USD at Stage I in the years of 1988 through 1990 to a total of 2,536.2 million USD at Stage IV (1997-1999). From Stage I to Stage III, the total freight volume of Acer Group to and from Taiwan increase from 838.3 million USD (815.8 million + 22.5 million), 1,318.5 million USD (1,122.7 million + 195.8 million) to 2,204.2 million USD (1,314.7 million + 889.5 million). In contrast, during Stage IV, freight volume to and from Taiwan decreased to 1,055.9 million USD (838.3 million + 217.6 million) since the products manufactured from offshore factories are shipped directly to the marketplace. Moreover, Table 1 and Figure 4 show that Acer Group’s outgoing freight share of Taiwan decreased from 93.7% at Stage I to 33.1% at Stage IV. The incoming freight share of Taiwan increased from 2.6% at Stage I to 38.0% at Stage III but decreased to 10.7% at Stage IV. Considering the changes in Acer’s international division of labor and supply chain arrangement in recent years, the flow of freight from Acer’s offshore factories to their market places expanded and accelerated from Stage III (4.6%) to Stage IV (51.8%). In Acer’s experience, the freight transportation demand to and from Taiwan will indeed fluctuate according to the firm’s international division of labor as well as the various supply chain operation models. Q1 =Increment 1 Q2 =Increment 2 Q3 =Decrease F re ig h t T ra n s p o rt a ti o n D e m a n d Stage I I I I I I I V
Stage of Global Logistics Development
Freight flow to/from Taiwan
Table 1. The changes in freight movement of the Acer Group: Stage I (1988-1990) -- Stage IV (1997-1999)
Unit: million US$
To from
Taiwan Offshore Factory Market Place Sub-total
Stage I (1988-1990) Taiwan 0.0 0.0% 5.1 0.6% 810.7 93.1% 815.8 93.7% Offshore Factory 22.5 2.6% 0.0 0.0% 32.1 3.7% 54.6 6.3% Sub-total 22.5 2.6% 5.1 0.6% 842.8 96.8% 870.4 100.0% Stage II (1991-1993) Taiwan 0.0 0.0% 21.7 1.3% 1,101.0 67.2% 1,122.7 68.5% Offshore Factory 195.8 11.9% 250.1 15.3% 70.6 4.3% 516.5 31.5% Sub-total 195.8 11.9% 271.8 16.6% 1,171.6 71.5% 1,639.2 100.0% Stage III (1994-1996) Taiwan 0.0 0.0% 40.5 1.7% 1,274.2 54.5% 1,314.7 56.2% Offshore Factory 889.5 38.0% 27.1 1.2% 108.2 4.6% 1,024.8 43.8% Sub-total 889.5 38.0% 67.6 2.9% 1,382.4 59.1% 2,339.5 100.0% Stage IV (1997-1999) Taiwan 0.0 0.0% 91.4 3.6% 746.9 29.4% 838.3 33.1% Offshore Factory 271.6 10.7% 113.7 4.5% 1,312.6 51.8% 1,697.9 66.9% Sub-total 271.6 10.7% 205.1 8.1% 2,059.5 81.2% 2,536.2 100.0% 1000 1988 1989 1990 1991 1992 1993 1994 1995 1996 1997 1998 1999 Incoming freight 22.5 195.8 889.5 Million USD Year 500 2000 2500 271.6 1500
Stage I Stage II Stage III Stage IV
Outgoing freight 815.8 1122.7 1314.7 838.3 870.4 1639.2 2339.5 2536.2
Total freight volume
Figure 4. Acer Group’s outgoing/incoming freight movement to Taiwan
4. THE EFFECTS ON INTERNATIONAL FREIGHT FLOW
Since many of the pervious studies are quite limited by a lack of available data, this study designed and conducted a questionnaire to survey the Taiwan IT manufacturing industry in order to learn the firms’ logistics strategies. This section explains the rationale that was used in selecting respondent Taiwanese IT manufacturing industry, empirical research methodology, and the characteristics of the sample.
4.1 Resear ch methodology
In order to explore issues of global logistics in Taiwan business, a survey instrument was sent to 152 IT firms listed on the Taiwan Stock Exchange (TSE). In-depth interviews, desk and
file research, cost and quantitative studies of logistics, and logistics strategies were also conducted. The objective of the interview process was to clarify the related details of firms’ logistics operations and to validate findings from the survey analysis. The survey was conducted from July 1998 to June 2000. Before mailing the questionnaire, two companies were asked to pre-test the survey and to provide comments regarding the level of clarity and objectivity of the questions, the accuracy and applicability of the answer options, and the amount of time spent on the questionnaire. Suggestions were used to refine some of the questions and to add new answer options. The survey instrument was comprised of three sections. The first section contained questions asking respondents for basic information. The second section included questions regarding the manufacturing activities of the supply chain, including, the respondents’ opinions concerning, the reasons driving the decision to establish offshore factories and the number of the factories of the respondents. The final section of the instrument questioned respondents as to the strategies of manufacturing and logistics, including identification of products’ characteristics and cost of logistics.
4.2 Sample Analysis
A total of 45 usable surveys were returned each representing a unique firm for an effective overall response rate of 29.61 percent (i.e. 45/152). The low response rate may have been due to the very detailed nature of the survey. Despite the low response rate, it should be noted that the total number of surveys returned represented a very large database for Taiwanese IT industry supply chain research. Table 2 and Table 3 summarized the basic information regarding the respondents.
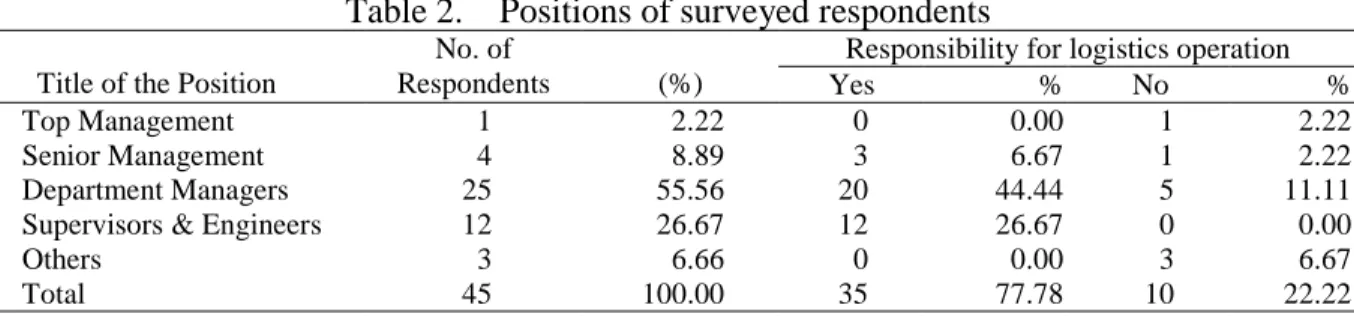
Table 2. Positions of surveyed respondents
Responsibility for logistics operation Title of the Position
No. of
Respondents (%) Yes % No %
Top Management 1 2.22 0 0.00 1 2.22
Senior Management 4 8.89 3 6.67 1 2.22
Department Managers 25 55.56 20 44.44 5 11.11
Supervisors & Engineers 12 26.67 12 26.67 0 0.00
Others 3 6.66 0 0.00 3 6.67
Total 45 100.00 35 77.78 10 22.22
Table 3. Questionnaire survey response profile
Annual Sales
(million USD) No. of Respondents (%)
Less than 500 million 31 68.89
$501 million – 1 billion 7 15.56
$1 – 1.5 billion 5 11.11
$1.5 – 2.0 billion 1 2.22
Greater than $2 billion 1 2.22
Total 45 100.00
As shown in Table 2, the positions held by the people who completed the questionnaire varied from top management to supervisors and engineers. The top management positions (2.22%) included chief executive officers, whereas the senior management positions (8.89%) included general and assistant general managers, technical directors, operations managers, and plant managers. The department managers (55.56%) were derived from control and logistics engineering; product engineering; and marketing and administration personnel, while the supervisors and engineers (26.67%) included those with the responsibility of handling manufacturing activities. Finally, the title of executive assistant and executive secretary are included in the last category (6.66%). Based on the profile of the respondents, it is assumed the sample provides a representative profile and can be used to analyze the general practices and views within the Taiwanese IT manufacturing industry. Subsequent to completing the