國
立
交
通
大
學
環境工程研究所
碩
士
論
文
鋯離子摻雜與金沉積對中孔洞二氧化鈦微結構與光
催化還原二氧化碳研究
Microstructures and photoreductive behavior of the mesoporous TiO
2photocatalysts: Effect of Zr
4+doping and Au deposition
研 究 生:胥穎亞
指導教授:張淑閔 副教授
中文摘要
近年來全球暖化的影響日趨嚴重,光催化還原CO2被視為最理想的解決技術之一, 其靈感來於自然界植物的光合作用,不但處理溫室氣體的同時,也提供可利用的碳氫化 合物做為能源。本研究成功利用蒸發誘導自組裝法(evaporation-induced self-assembly)合 成中孔洞鋯離子摻雜二氧化鈦,並另以沉積沉澱法(deposition-precipitation)在材料表面 沉積奈米金顆粒。此中孔洞材料以三區段共聚高分子(triblock copolymer)作為孔洞模 板,具有高的比表面積(103-217 m2 g-1)及較集中的孔徑分部。分析結果顯示,鋯摻雜濃 度決定鋯離子在二氧化鈦結構中的分佈,以致影響二氧化鈦結構與物化特性,當 Zr/Ti 整體元素比為0.02-0.04 時,鋯離子傾向摻雜於 TiO2晶粒表面,除提高孔洞熱穩定性外, 也使TiO2晶粒由9.6nm 增加至 11.6 nm,能隙由 3.09 提高至 3.15 eV,然而鋯離子在高 濃度時傾向摻雜於內部晶格,除抑制TiO2結晶外,也致使光催化氧化RhB 的活性變差,當Zr/Ti 比例為 0.03 與 Au 負載量為 1.0 wt.%時,TiO2有最高的光催化氧化活性。CO2
光催化還原實驗以水氣作為還原劑,以批次反應槽中進行,而甲烷為反應唯一的偵測產
物。相較於修飾的光觸媒,單純二氧化鈦擁有較高的還原活性,於第一小時可產生0.73
mole g-1甲烷量,並在第四小時達最高累積量1.03 mole g-1,隨後甲烷氧化速率提升,
於第八小時降低為0.45 mole g-1。摻雜鋯離子與沈積Au 奈米顆粒雖使 TiO2初始甲烷
產率降低為0.23 與 0.33 mole g-1,然而卻抑制CH4被氧化的逆反應速率,經8 小時反
應後,Zr-doped TiO2 (Zr/Ti=0.03)與 Au-TiO2樣品累積甲烷量可分別達0.81 與 0.54 mole
g-1。EPR 結果顯示電荷能有效於觸媒表面轉移至 CO2與 H2O,因此產生難還原的中間
產物是導致低還原效率的原因,Au 奈米顆粒為電荷再結合的媒介,對光催化反應會造
Abstract
Photocatalytic reduction of CO2 that mimics natural photosynthesis is a promising
technology to both reduces the greenhouse gas emissions and provides alternative energy sources. In this study, mesoporous TiO2 and Zr-doped TiO2 photocatalysts were
successfully synthesized using an EISA process. In addition, Au nanoparticles were loaded through a deposition-precipitation (DP) method. These mesostructured materials possess large surface areas of 103-217m2 g-1 and narrow pore size distributions. The concentration of Zr4+ ions determines the distribution of the doped ions in the TiO2 matrix, so as the
microstructures and physicochemical properties. When the Zr/Ti ratio was in the range of 0.02-0.04, the Zr4+ ions were doped within the boundaries. As the result, the thermal stability of the porous structure was improved. In addition, the crystallite size of the TiO2
increased from 9.6 to 11.6 nm, and the corresponding bandgap increased from 3.09 to 3.15 eV. When the Zr/Ti ratio was over 0.05, the Zr4+ ions tend to be doped within the TiO2
lattice, thus inhibiting crystallization and photocatalytic activity of the doped TiO2 samples.
The TiO2 samples exhibited the highest activity for RhB degradation when the Zr/Ti ratio and
Au-loading were 0.03 and 1.0 wt.%, respectively. Photoreduction of CO2 with water vapor
was carried out in a batch system. CH4 was the only detectable product in the reduction.
The pure TiO2 exhibited the highest activity over the modified samples. It generated 0.45
mole g-1 CH
4 in the first hour, while the Zr-doped TiO2 (Zr/Ti= 0.03) and 1.0 wt.%
Au-TiO2 produced 0.23 and 0.33 mole g-1, respectively. The pure TiO2 reached to the
highest CH4 yield of 1.03 mole g-1 at 4th hour. The yield subsequently reduced to 0.45
mole g-1 at the 8th hour because of increased reoxidation rate. The reoxidation of CH4 was
mole g-1 CH
4 after 8 hr irradiation. EPR results show that interfacial charge transfer from
the catalysts to the adsorbed CO2 and water is prompt. The formation of the intermediates
which have high reductive barriers determines the low reduction efficiency. The Au nanoparticles serve as the mediator to promote charge recombination, thus are detrimental for the photocatalytic activity. On the other hand, the impurities energy levels introduced by the doped Zr4+ ions within the bandgap dominate the reductive activity of the doped TiO2 and
謝誌
白駒過隙,歲月如梭,繁華終需落幕,三年的碩士生涯即將終了,研究歷程看似艱 辛,一路走來卻也甘之如飴,學海波瀾,蒼蒼茫茫不見彼岸,承蒙指導教授 張淑閔老 師敦敦教誨,所受心志之磨練與知識能力之訓練,兢兢業業看待每個任務,殫思極慮地 面對所有問題,竭盡全力擔負起自己責任。感謝同步輻射中心詹丁山博士的指導,亦師 亦兄,在專業領域上給我幫助,遇到挫折與瓶頸也在旁提供建議。無論在研討會亦或是 論文研究上,謝謝董瑞安教授不斷費心提點,受到刺激而時刻反視自己,在實驗中不迷 失應循的方向。也謝謝吳紀聖教授對論文悉心指正,在研究上不吝給予寶貴的意見及建 議,使本篇論文得以更瑧完整。此外感謝實驗室的大學姐們Evelyn、Claire 和Wes在研 究上無私的教導,學長Brad有如我的大兄長一般,不論是實驗或生活都照顧著我,在苦 悶的研究生涯帶來無限的歡樂,還有兩位像大姐般的Michelle和Joe,在我幾番波折的實 驗裡總是給予幫助和建議,大學長Steel也對我這小學弟毫無保留的指點迷津。學妹Jiphi 帶給這陽剛味十足的實驗室一點傻傻的氣氛,和學弟Welly和Jason短暫的相處,卻也留 下美好的記憶。而Ashley、Ian和小老弟Jeremy,是我實驗室最麻吉的三個好學弟,漫漫 長夜有你們的陪伴從來不覺得孤單,離開你們使我惆悵不捨。也謝謝重訓的夥伴,俊男、 台客、玉米頭和Jessica狗狗,研究之餘不忘強身健體。最後要感謝的是我的家人,給我 精神上的支持和衣食無虞的生活,親愛的爸媽和妹妹對我的包容,體諒我無法陪在你們 的身邊,卻也不過問在忙些什麼,讓我求學之路上沒有壓力。最後謝謝始終陪伴在身邊 的蘇小紅,任性的妳卻很貼心,時常聽我抱怨卻要忍受我的壞脾氣,對我的決定妳總是 無悔的支持和體諒,默默的幫我解決大小雜事,使我全心全意專注在研究上,辛苦妳了。 如果感謝的人太多了,那不如就謝天吧! 穎亞 謹誌 中華民國一百年八月Content Index
中文摘要... I Abstract ... II 謝誌... IV Figure Index ... VII Table Index ... IX
Chapter 1. Introduction ... 1
1-1. Motivation ... 1
1-2. Objectives ... 3
Chapter 2. Background and Theory ... 4
2-1. Photocatalysis ... 4
2-1-1. Principle of photocatalysis ... 4
2-1-2. Material properties of TiO2 ... 8
2-2. Sol-gel method ... 10
2-3. Mesoporous materials ... 13
2-3-1. Mechanisms and templates ... 14
2-3-2. Mesoporous TiO2 ... 17
2-3-3. Evaporation induced self-assembly (EISA) process ... 22
2-4. Surface modification ... 24
2-5. Photocatalytic reduction of CO2 ... 25
2-5-1. The mechanism of photoreduction of CO2 ... 27
2-5-2. The photocatalytic reduction of CO2 over TiO2 ... 30
Chapter 3. Materials and methods ... 35
3-1. Materials ... 35
3-2. Preparation of mesoporous Au-loaded and Zr-doped TiO2 samples ... 38
3-3. Characterization ... 41
3-3-1. High Resolution Transmission Electron Microscopy (HTEM) ... 41
3-3-2. Nitrogen adsorption and desorption isothermal ... 41
3-3-3. X-ray Powder Diffractometry (XRPD) ... 41
3-3-4. Electron Paramagnetic resonance (EPR) ... 42
3-3-5. Thermo Gravimetric Analysis and Differential Scanning Calorimetry (TGA/DSC) ... 42
3-3-7. UV-vis Spectrometer ... 44
3-3-8. X-ray Absorption Spectroscopy (XAS) ... 44
3-3-9. CO2 Adsorption Test ... 45
3-3-10. CO2 Photoreduction Test ... 45
Chapter 4. Results and Discussion ... 50
4-1. Thermal analysis ... 50
4-2. Chemical composition ... 52
4-3. Pore Structure ... 57
4-4. Crystalline structure ... 67
4-5. Local geometric structure ... 70
4-6. Optical property ... 78 4-7. Photodegradation of RhB ... 83 4-8. CO2 adsorption isotherm ... 86 4-9. Photoreduction of CO2 ... 88 4-10. EPR results ... 90 Chapter 5. Conclusions ... 102 References ... 103
Appendix A. Calibration curve ... 113
Appendix B. XPS patterns of catalysts ... 114
Appendix C. TEM images of catalysts ... 117
Appendix D. Zr K-edge XAS spectra of catalysts ... 118
Appendix E. CO2 adsorption-desorption isotherm of catalysts ... 120
Figure Index
Figure 2-1 Schematic photoexcitation in a solid followed by excitation events.[19] ... 6
Figure 2-2 Mechanism of photocatalysis on semiconductors exposed to light irradiation.[20] .. 6
Figure 2-3 Schematic of a Schottky barrier.[19] ... 7
Figure 2-4 Schottky barriers on the surface of metal-semiconductor particle.[19] ... 8
Figure 2-5 Energies of various semiconductors in aqueous electrolytes at pH= 1.[22] ... 9
Figure 2-6 Bulk structure of rutile and anatase TiO2.[24] ... 10
Figure 2-7 Gel-glass process sequence.[27]... 13
Figure 2-8 Two possible pathways for the liquid-crystal templating mechanism of MCM-41.[32] ... 15
Figure 2-9 Illustrations of mesoporous M41S materials: (a) MCM-41, (b) MCM-48, and (c) MCM-50.[32] ... 15
Figure 2-10 Schematic view of the mesoporous oxide prepared with polymeric template.[41] 16 Figure 2-11 Mechanistic schemes for mesoporous TiO2 with triblock copolymer.[59] ... 18
Figure 2-12 Schematic phase diagrams for the surfactant in solution.[77] ... 23
Figure 2-13 Formation pathways of TiO2/CTAB hybrid nanobuilding blocks.[52] ... 23
Figure 2-14 A schematic illustration of the energy correlation between semiconductor photocatalysts and redox couples in water.[1] ... 33
Figure 3-1 Flowchart of experimental design in this study. ... 37
Figure 3-2 Synthetic process of mesoporous TiO2 and ZrxTiO2 samples via an EISA method. ... 39
Figure 3-3 Synthetic process of Au-doped mesoporous TiO2 catalyst via a DP method ... 40
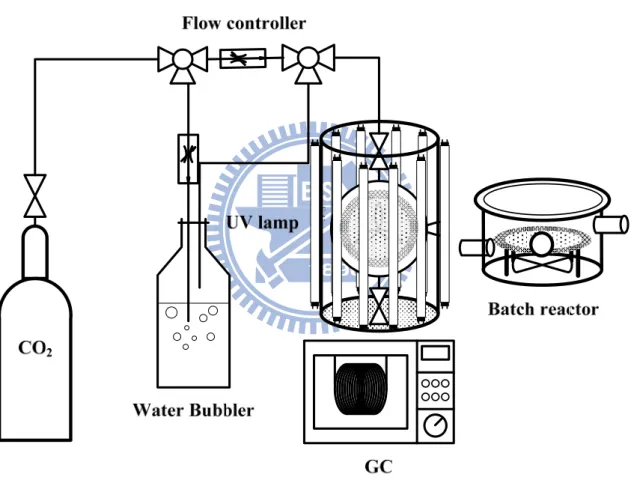
Figure 3-4 Schematic illustration of the experimental setup for photoreduction of CO2. ... 47
Figure 3-5 Photographs of the (a) photocatalytic reactor and (b) illuminated system. ... 48
Figure 4-1 The DSC and TG/DTG curves of the as-prepared TiO2 sample heated in air. ... 51
Figure 4-2 (a) The wide-ranged XP spectra and high resolution of (b) Ti (2p), (c) Zr (3d) and Au (4f) XP spectra of TiO2, ZrxTiO2 and Au-TiO2 samples. ... 54
Figure 4-3 The O (1s) XP spectra of TiO2 and ZrxTiO2 samples. ... 56
Figure 4-4 N2 adsorption and desorption isotherm and BJH pore size distribution of pure TiO2. ... 60
Figure 4-5 (a) N2 adsorption and desorption isotherm and (b) pore size distribution of ZrxTiO2. ... 62
Figure 4-6 (a) N2 adsorption and desorption isotherm and (b) pore size distribution of Au-TiO2... 64
Figure 4-7 TEM images of (a) mesoporous TiO2, (b) Zr0.03TiO2 and (c) 1.0% Au-TiO2, and HRTEM images of (d) mesoporous TiO2, (e) Zr0.03TiO2 and (f) 1.0% Au-TiO2. ... 66
Figure 4-9 (a) Complete Ti K-edge XANES spectra (b) and pre-edge region of crystalline anatase TiO2, mesoporous TiO2 and ZrxTiO2 samples. ... 73
Figure 4-10 (a) Ti K-edge EXAFS spectra and corresponding (b) FT-EXAFS spectra of anatase TiO2, mesoporous TiO2 and ZrxTiO2 samples. ... 74
Figure 4-11 Fitted FT-EXAFS spectra of (a) mesoporous TiO2, and (b) mesoporous ZrO2 and
ZrxTiO2 samples. Solid and symbolic lines represent the experimental and fitting
curves, respectively. ... 75 Figure 4-12 UV-vis spectra of mesoporous TiO2 and ZrxTiO2 samples. ... 79
Figure 4-13 UV-vis spectra of mesoporous TiO2 and x% Au-TiO2 samples. ... 81
Figure 4-14 The photodegradation of 0.01 mM RhB by mesoporous TiO2 and ZrxTiO2
samples. ... 84 Figure 4-15 The photodegradation of 0.01 mM RhB by mesoporous TiO2 and x% Au-TiO2
samples. ... 85 Figure 4-16 Time dependence on the production yield of CH4 over catalysts. ... 89
Figure 4-17 EPR spectra of mesoporus TiO2, Zr0.03TiO2 and 1.0% Au-TiO2 under UV
irradiation at 77K with vacuum system. ... 94 Figure 4-18 EPR spectra of mesoporus TiO2, Zr0.03TiO2 and 1.0% Au-TiO2 under UV
irradiation at 77K with N2/H2O... 95
Figure 4-19 EPR spectra of mesoporus TiO2, Zr0.03TiO2 and 1.0% Au-TiO2 under UV
irradiation at 77K with dry CO2 gas. ... 96
Figure 4-20 EPR spectra of mesoporus TiO2, Zr0.03TiO2 and 1.0% Au-TiO2 under UV
irradiation at 77K with CO2/H2O. ... 97
Figure 4-21 The concept of mesoporus TiO2, Zr0.03TiO2 and 1.0% Au-TiO2 under UV
irradiation at 77K with vacuum system. ... 98 Figure 4-22 The concept of mesoporus TiO2, Zr0.03TiO2 and 1.0% Au-TiO2 under UV
irradiation at 77K with N2/H2O... 99
Figure 4-23 The concept of mesoporus TiO2, Zr0.03TiO2 and 1.0% Au-TiO2 under UV
irradiation at 77K with dry CO2 gas. ... 100
Figure 4-24 The concept of mesoporus TiO2, Zr0.03TiO2 and 1.0% Au-TiO2 under UV
irradiation at 77K with CO2/H2O. ... 101
Table Index
Table 2-1 Examples of porous materials and showing the pore size domains.[30] ... 14
Table 2-2 Mesophases of silicate molecular sieves and synthesis parameters.[33] ... 15
Table 2-3 Mesophases and synthesis parameters of triblock copolymers.[37] ... 17
Table 2-4 Preparation of mesoporous TiO2 ... 21
Table 2-5 Conversion of CO2 with water into hydrocarbon.[95] ... 27
Table 2-6 Summary of the CO2 photoreduction on TiO2. ... 34
Table 3-1 The structural formula of materials used in this study. ... 36
Table 3-2 Preparation mesoporous of TiO2 and ZrxTiO2 samples and corresponding names. 39 Table 3-3 Preparation conditions of Au-loaded TiO2 samples and corresponding names. ... 40
Table 4-1 The surface chemical compositions of TiO2 and ZrxTiO2 samples. ... 55
Table 4-2 The chemical compositions of Au-TiO2 samples ... 55
Table 4-3 Hysteresis loop types, Specific surface area (SBET), pore volume (Vpore), mean pore size (Dmean) and major pore size (Dmajor) of catalysts. ... 65
Table 4-4 Crystallite sizes of mesoporous TiO2 and ZrxTiO2 samples. ... 69
Table 4-5 EXAFS fitting results at Ti K-edge of mesoporous TiO2 samples. ... 76
Table 4-6 EXAFS fitting results at Zr K-edge of mesoporous ZrO2 and ZrxTiO2 samples. .... 77
Table 4-7 Band gap energy of mesoporous TiO2 and ZrxTiO2 samples. ... 80
Table 4-8 Band gap energy of mesoporous TiO2 and x% Au-TiO2 samples. ... 82
Table 4-9 The adsorption constant (K) and saturated adsorbed amount (Xm) of catalysts toward CO2 at 273 K. ... 87
Chapter 1.
Introduction
1-1.
Motivation
At present, increasing of greenhouse gas (GHG) such as CO2, CH4, N2O, HFCs, PFCs,
and SF6 are the primary cause of global warming in an atmosphere. The GHG representing
the largest contribution of human activities is carbon dioxide (CO2), releasing from fossil fuel
combustion. Recently, many efforts are achieved to reduce CO2 emissions by two
approaches: (1) post-treatment of carbon capture and (2) geological sequestration of CO2
technology. Nevertheless, these process are requires significant energy further than generation and a long-term storage of CO2 undergroundis regarded as precarious[1]. A
replacement and more preferable method to reduce CO2 are as a fuel feedstock with energy
from free and abundant sources. Photocatalytic reduction of CO2 by using sunlight the
largest carbon-free energy source that is inspired by the natural photosynthesis of plants. It is not only to decrease the amount of green house gases but also to convert the available solar energy to supply energy.
The semiconductors utilize light energy as the excitation source; the photoexcited electrons reduce CO2 with reductant on the surface and form chemical bond energy. A
variety of photocatalysts are used such as TiO2, ZnO, SnO2, WO3, Fe3O4, CdS, and ZnS,
among them, titanium dioxide (TiO2) is considered the most convenient candidates because it
shows an excellent photocatalytic activity, large band gap (~ 3.2 eV) and specific oxidation-reduction power as well as it is cheap, harmless and stably. However, the rate of photoreduction and light utilization are still a major challenge for researchers.
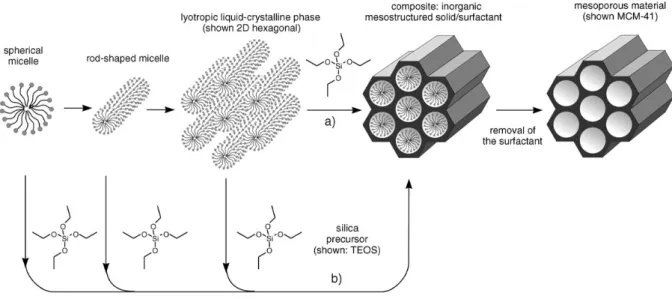
Since the discovery of mesoporous M41S materials by Mobil Oil Company using the ammonium surfactants as a template in 1992[2-3], many different methods have been developed to design and synthesize of silica and non-silica mesoporous materials for their
potential application[4-7]. Numerous synthesis strategies are reported, the evaporation induced self-assembly (EISA) is combined with sol-gel chemistry and self-assembly process to prepare highly ordered mesoporous oxide[8]. This method has been used to tailor the dimensions and shapes by adjusting precursor composition and relative humidity for tuning of hydrolysis-condensation rate, since slow self-assembly of the inorganic network around the template permits the formation of a well-defined mesoporous structure. The synthesis of mesoporous metal oxides with hexagonal structures was first adapted by Stucky’s group employing amphiphilic poly (alkylene oxide) block copolymers as structure-directing agents[9]. In particular, mesoporous TiO
2 materials have attracted extensive attention in
photocatalytic application or energy conversion in terms of high surface area of the mesoporous structure and three-dimensionally (3D) architecture contribute to high photocatalytic efficiency.
However, the thermal treatment causes the collapse of mesoporous framework and loss of surface area due to the crystallization and the subsequently growth, which strongly limited the extended applications of TiO2. Recently, the hybrid inorganic structure has proved more
flexible and stable as-synthesized because of incomplete inorganic polymerization. Among the various metal oxides coupling with TiO2-base catalysts, ZrO2-TiO2 composites are one of
the most promising materials[10-11] which have tunable construction and attractive photocatalysis properties. In addition, an improvement of CO2 conversion efficiency was
demonstrated that the surface modification of TiO2 with metals, which can inhibit the
recombination of electron-hole pairs, extend the range of wavelength and control the selectivity of products. An Au/TiO2 catalyst by deposition-precipitation (DP) method has
received increasing attention since the discovery by Haruta et al.[12], which gain a high dispersion of gold nanoparticle on any forms of support. To the best of our knowledge, some research reported that CO2 photoreduction using metal-doped TiO2 on silica framework
exhibit high activity and selectivity for production[13-15]. Whereas both advantage (surface modification by dopant or deposition and mesoporous structure as the framework can enhance photoreduction of CO2, it is necessary to develop the mechanism of surface
modification and mesopores on the photocatalytic reduction of CO2 over TiO2.
1-2.
Objectives
This study aims to investigate the photocatalytic behavior of mesoporous Au-loaded and Zr-doped TiO2 photocatalysts for reduction of gaseous CO2 with H2O in a gas-phase. The
mesostructural TiO2 and ZrO2-TiO2 samples were fabricated through an evaporation induced
self-assembly (EISA) process. Then, the Au-nanoparticles were then deposit on the mesoporous photocatalysts using a deposition-precipitation (DP) method. The physicochemical properties of Au-doped ZrO2-TiO2 catalysts were characterized by N2
adsorption and desorption isothermal analysis, Transmission electronic microscopy (TEM), Powder X-ray diffractometer (PXRD), X-ray photoelectron spectroscopy (XPS), UV-vis spectrophotometer and Thermo gravimetric analysis/Differential scanning calorimetry (TGA/DSC). The adsorption and photocatalytic reduction tests of CO2 were carried out in a
batch reactor with water vapor as the reactants under the UV irradiation. In addition, the charge trapping and transference were analyzed using electron paramagnetic resonance (EPR). X-ray absorption spectroscopy (XAS) was applied to correlate the microstructure and mechanism of photoreduction with several parameters, such as gold loading, support structure, pretreatment and condition of experiment (e.g. temperature and humidity).
Chapter 2.
Background and Theory
2-1.
Photocatalysis
2-1-1. Principle of photocatalysis
Since 1972, Fujishima and Honda discovered the phenomena of photocatalytic splitting of water on semiconducting TiO2 e1ectrodes under UV light[16], more attention has been
focused on this material as a practical photocatalyst. Semiconductors such as TiO2, ZrO2,
SnO2, ZnO, CdS and WO3 have been applied in energy and environmental fields for
photon-to-electricity conversion, water splitting, hydrogen storage, photocatalysis and sensing[17]. Unlike metals, which have a continuum of electronic states, semiconductors exhibit a void energy region (band gap) that extends from the top of the filled valence band (VB) to the bottom of the vacant conduction band (CB)[18]. Figure 2-1 illustrates the excitation of an electron from the VB to the CB initiated by the absorption of photons with energy equal to or greater than the band gap of the semiconductor. The separated electron and hole could migrate to the surface (pathway A and B) or undergo recombination in the volume and at the surface (pathway C and D)[19].
The detailed mechanisms of the photocatalytic oxidation or reduction reactions on semiconductors by UV illumination are shown in Figure 2-2 and presented below stepwise[20]: Photocatalysis involves the generation of electron-hole pairs by UV absorption and the charge carriers can migrate rapidly to the surfaces of catalyst where they are oxidized or reduced with suitable substrates (Step 1). The trapped hole can react with the chemisorbed OH group or the H2O molecular on the surface to produce OH radicals (Step 2) or accept
electrons from adsorbed organic compounds to convert them directly to radicals (Step 3). In addition, oxygen or other oxidants including CO2 can act as an efficient electron scavenger to
form superoxide radical (Step 4) or other reduced radicals (Step 5). The fundamental processes of photocatalysis involving with TiO2 can be summarized as following:[21]
Charge carrier generation:
hν h e
TiO2 (2-1)
Charge carrier trapping:
OH Ti OH Ti h OH Ti OH Ti e IV IV III IV (2-2) (2-3)Charge carrier recombination:
OH Ti OH Ti h OH Ti OH Ti e Energy e h IV III IV IV (2-4) (2-5) (2-6)Interfacial charge transfer:
Oxidant OH Ti Oxidant OH Ti Reductant OH Ti Reductant OH Ti IV III IV IV (2-7) (2-8)Figure 2-1 Schematic photoexcitation in a solid followed by excitation events.[19]
Contact between an n-type semiconductors such as TiO2 and metals generally involves a
redistribution of electric charges and the formation of a Schottky barrier as shown in Figure 2-3. The Schottky barrier formed at the metal-semiconductor interface leads the metal and the semiconductor exhibiting excess negative charges and positive charges, respectively. Separation of charge carriers from the barrier region can serve as an efficient electron trap to prevent the electron-hole recombination on photocatalysts. The height of the barrier (b is
given by:
x m b
E
(2-9)where b is the work function and Ex is the electron affinity. Figure 2-4 illustrates the
properties of Schottky barrier formed at a metal-semiconductor junction. After migration of the photoexcited electron to the surface, electron trapping suppresses the recombination.
Figure 2-4 Schottky barriers on the surface of metal-semiconductor particle.[19]
2-1-2. Material properties of TiO
2Semiconductors participate in a variety of photocatalytic reactions including oxidative degradation of organics, reduction of metal ions and evolution of hydrogen from water to remedy the problem of chemical waste and energy renewal. TiO2 is the most investigated
semiconductor which has large potential in photocatalysis, solar cells, sensor and photochromism because of its low cost, commercial availability, nontoxicity, chemical stability, ease of handling, high photocorrosion resistance and suitable optical/electronic qualities. This ability of TiO2 is related to its optical properties. TiO2 possesses a wide
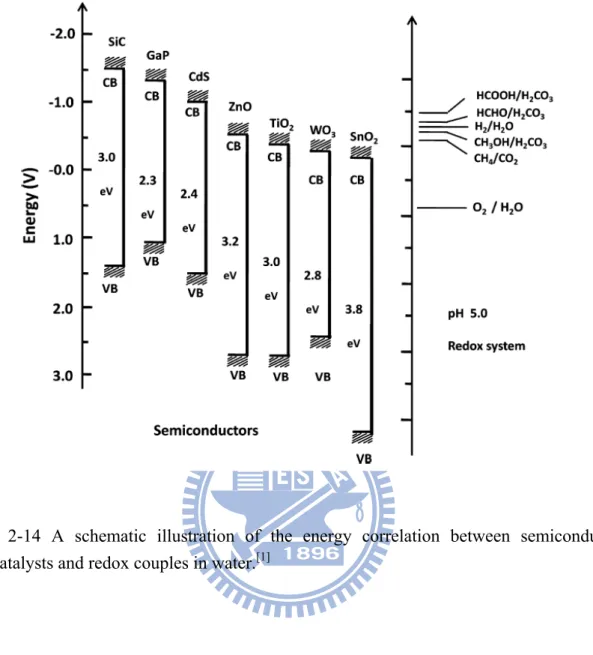
band gap (3.0 eV for the rutile phase and 3.2 eV for the anatase phase, as shown in Figure 2-5) that absorbs photons in the ultraviolet region, thus limiting its application under visible light.
Figure 2-5 Energies of various semiconductors in aqueous electrolytes at pH= 1.[22]
In addition, the photocatalytic activity of TiO2 is highly dependent on its porosity,
surface area, bulk structure, particle size, crystal phase and crystallinity. TiO2 has three
polymorphs: anatase, rutile and brokite, and anatase is the most active phase[17]. Figure 2-6 shows the unit cell structure of rutile and anatase TiO2 which are commonly used in
photocatalysis. The basic building block consists of a titanium atom surrounded by a more or less distorted octahedron of six oxygenatoms[23]. These differences in lattice structures cause different mass densities and electronic band structures between the two crystals of TiO2.
Figure 2-6 Bulk structure of rutile and anatase TiO2.[24]
2-2.
Sol-gel method
The sol-gel processing of inorganic ceramic materials refers to the hydrolysis and condensation of alkoxide-based precursors have been extremely investigated since the earliest study of Ebelman et al.[25]. TiO2 have been synthesized with the sol-gel method via an
acid-catalyzed hydrolysis with titania precursor followed by condensation[26]. Sol-gel process offers a facile and available method for synthesis of nanoparticle or thin film that are either unitary or hybrid metal oxides, offers many advantages including excellent control and
selective of precursor solutions, easily modification of composition, customizable microstructure, relatively low reaction temperatures, the practicability of coating deposition on substrates, and simple and inexpensive equipment. The processing procedures can be characterized by a series of distinct steps (Figure 2-7):[27-28]
Step 1: Mixing. Stabilized solutions of the alkoxide or solvated metal precursor (the sol),
and hydrolysis and condensation reactions were initiated by mixing with precursor and water.
Step 2: Gelation. At gelation, the formation of an oxide or alcohol bridged network (the gel) by a polycondensation or polyesterification reaction was increased in the
viscosity increases sharply of the solution.
Step 3: Aging. Aging of the gel (syneresis), the polycondensation reactions continue until
the gel transforms into a solid mass, follow by contracting of the gel and expulsion of solvent from the gel pores. The aging process of gels must develop to the prevention of cracks during drying because of Ostwald ripening and phase transformations may occur concurrently with syneresis.
Step 4: Dring. This process is complicated due to fundamental changes in the structure
of the gel during drying the water or solvent is removed from the gel pore network. If isolated by thermal evaporation, the resulting product is termed a xerogel. If
the liquid is dried under hypercritical conditions an aerogel has been prepared with
lower density.
Step 5: Dehydration or stabilization. The removal of surface-bound (M-OH) groups are
removed from the pore network by calcinations at temperature up to 800 °C results in a stabilizing the gel against rehydration.
Step 6:
Densification. Heating the porous gel at high temperatures (> 800 °C) causesdensification and decomposition to occur. The pores of the gel network are collapsed and remaining organic species are volatilized.
Hydrolysis: Cl Cl M Cl Cl
+
4H2O OH OH M OH HO+
4HCl (2-10) OR OR M OR OR+
4H2O OH OH M OH HO+
4HOR (2-11) Condensation: OH OH M HO OH OH M OH OH OH M HO O+
OH OH OH M HO OH+
H2O (2-12) Gelation: OH M OH+
OH M HO O OH OH M OH OH OH M HO O OH OH M OH OH OH M HO O+
OH O M OH OH O M HO O 2H2O (2-13)Figure 2-7 Gel-glass process sequence.[27]
2-3.
Mesoporous materials
Since the amazing discovery of zeolite with tailored pore structures and high surface areas, a variety of ordered porous materials have many applications in the areas of adsorption and catalysis[29]. According to the classical definition made by IUPAC, the porous structures can be divided into three categories: microporous (d < 2 nm), mesoporous (2 nm < d < 50 nm) and macroporous materials (d > 50 nm), based on their pore diameter. Some
Table 2-1 Examples of porous materials and showing the pore size domains.[30]
Pore size regimes Definition Example Actual size range macroporous d > 500 Å glasses > 500 Å
mesoporous 20 Å < d < 500 Å
aerogels > 100 Å pillared layered clays 10 Å, 100 Å (a)
M41S 16-100 Å
microporous d < 20 Å
zeolites, zeotypes < 14.2 Å activated carbon Å
(a) Bimodal pore size distribution
2-3-1.
Mechanisms
and templates
In 1992, the synthesis of mesoporous molecular sieves as aluminosilicate M41S was discovered by scientist in Mobil Oil Corporation. The synthesis involves the co-condensation of an anionic species with cationic surfactants (S+I-
)[3]. MCM-41, the remarkable one of the members of M41S, is prepared with a cationic surfactant, cetyltrimethylammonium (C16TMA+), as a template (as shown in Figure 2-8)[31]. It
possesses a highly ordered hexagonal arrangement of uniform pores whose dimensions can be confirmed with a varying channel (15-100 Å) and high surface area (> 1000 m2g-1). Other related phases such as MCM-48 and MCM-50 have a cubic and lamellar mesostructure, respectively (Table 2-2, Figure 2-9).
Figure 2-8 Two possible pathways for the liquid-crystal templating mechanism of MCM-41.[32]
Table 2-2 Mesophases of silicate molecular sieves and synthesis parameters.[33] Name Mesophase Space group Parameter MCM-41 hexagonal P6m [surfactant] / [Si] < 1 MCM-48 cubic I 3a d [surfactant] / [Si] < 1-1.5 MCM-50 lamellar P 2 [surfactant] / [Si] < 1.2-2
Figure 2-9 Illustrations of mesoporous M41S materials: (a) MCM-41, (b) MCM-48, and (c) MCM-50.[32]
Nonionic polymeric templates are later used in the synthesis of mesoporous silicas and other mesoporous oxides (as shown in Figure 2-10)[34]. The most useful groups of the surfactants are the triblock copolymers including poly(alkylene oxide)x-poly(propylene
oxide)y-poly(ethylene oxide)x, (PEO)x(PPO)y(PEO)x, (trade name: Pluronic)[35-36]. These
block co-polymers show excellent abilities on tailoring varied porous structure (Table 2-3), non-toxicity, specific interfacial character, commercial availability, biodegradability and low cost. The preparations of well-ordered hexagonal mesoporous material (SBA-15, Santa B Arbara No. 15) are achieved by using the amphiphilic block copolymers as structure-directing agents[37]. Compared to M41S and other silicates, SBA-15 exhibits high
thermal stability which is contributed by tunable large pore sizes (50-300 Å) and thick wall (31-64 Å). Moreover, it allows more remarkable applications for the preparation of mesoporous oxides, such as Al2O3, TiO2, ZrO2 HfO2, Nb2O5, Ta2O5, WO3 and SnO2[38-39], as
well as a variety of mixture (e.g., SiAlO3.5, SiTiO4, Al2TiO5, ZrTiO4 and ZrW2O8)[40].
Table 2-3 Mesophases and synthesis parameters of triblock copolymers.[37]
Name Mesophase Space group Example
EO/PO < 0.07 hexagonal (a) P6m EO5PO70EO5 lamellar (b) EO/PO =0.07-1.5 hexagonal P6m EO20PO70EO20 EO/PO > 1.5 cubic I 3 m m EO80PO30O80
(a) At low concentrations (0.5-1 wt %) and (b) higher concentrations (2-5 wt %)
2-3-2. Mesoporous TiO
2Recently, mesostructural metal oxides, which have high specific surface areas and pore volumes, as well as narrow pore size distributions where offer more active sites for catalytic reaction to occur, have attracted much attention. For the photocatalytic applications of TiO2,
anatase is necessary since this phase shows high photocatalytic activity. Unfortunately, synthesis of mesoporous TiO2 is much more complicated compared to silica because titania
precursor shows a high reactivity toward hydrolysis and condensation which leads a distorted structure. The preparation of mesoporous TiO2 powders and films using sol-gel
method[42-45], hydrothermal method[46-48], microwave method[49], sonochemical method[50-51] and evaporation induced self-assembly (EISA) method[52-54] have been extensively investigated. The first study of hexagonal arranged mesoporous TiO2 prepared via a
modified sol-gel method in the presence of alkyl phosphate surfactant as template was developed by Antonelli et al.[38]. Afterwards, they used dodecylamines as the template to prepare phosphorus-free mesostructured TiO2[55]. Yoshitake et al.[56] also used amine
precursor to stabilize the structure. Trong[57] used acetylacetone to control the condensation
of TiO2 and simply prepared lamellar and hexagonal mesoporous TiO2 in the presence of
cetyltrimethylammonium chloride (C16TMA+Cl-). Pure titania and silica incorporated
titania mesoporous materials have been successfully synthesized by Zheng et al.[58], who used urea as a template. Because ionic surfactants present strong interactions with inorganic walls, it is challenging to remove the surfactants from the metal oxides using extraction. And, the collapse of the inorganic structure may occur when the calcination is employed for surfactant removal. Thus, nonionic block copolymer appeared to be an excellent candidate for the formation of weak hydrogen bond with inorganic framework and surfactant composites. Uses of tripolymeric template to direct organization of mesoporous TiO2 with
worm-like distorted or hexagonal ordered structure are shown in Figure 2-11.
The nonionic block copolymers like (PEO)x(PPO)y(PEO)x have the additional advantage
of relatively thick inorganic pore wall, improving the thermal stability of the material. Stucky et al.[9] used amphiphilic poly(alkylene oxide) block copolymers as structure-directing agents and TiCl4 as the titania source to prepare mesostructral TiO2. Calleja et al.[42]
reported the synthesis of mesoporous TiO2 with highest specific surface areas (> 300 m2g-1)
of using the Pluronic P123 and titanium isopropoxide as the initial reaction agents to prepare a mesoporous TiO2. Recently, evaporation induced self-assembly (EISA) has been
investigated for the production of mesoporpous TiO2[52]. EISA process controls and
synchronizes the aggregation of micelles with the condensation of the inorganic framework, giving rise to well-defined porous structure. A succinct summary of some important works in this field are presented in Table 2-4.
However, pure TiO2 materials usually have poor thermal stability and relatively low
quantum efficiency, which strongly restricts its applications in photocatalysis. Combination with others metal oxides are the alternative approach for property tuning to enhance activity due to structural and electronic modification[60]. TiO2-SiO2 materials have been extensively
used at first as catalysts and supports for a wide variety of reactions[61]. These mixed materials are not only taken advantage of both photocatalysis and mechanical stability, but also generation of new acid sites. Thus, a great deal of TiO2-based binary metal oxides such
as TiO2-Al2O3, TiO2-SnO2, TiO2-ZrO2, TiO2-WO3 and TiO2-P2O5 have been reported, among
them, TiO2-ZrO2 is one of the most promising photocatalyst for tunable composition,
abundant phases and more attractive photocatalysis properties. In these works, Zr4+ ions were mainly doped in the surface of TiO2, the specific redox potential, higher surface area,
stronger surface acidity and creation of surface defects are proposed as the reason for the improvement in the photocatalytic performance[62-64]. Furthermore, the first synthesis of mesoporous Zr-TiOy using triblock copolymers as templates with hexagonal structure was
prepared by Stucky et al.[9]. Since then many efforts have been devoted to the fabrication of
mesoporous TiO2-ZrO2 materials and some dramatically applications have been
achieved[65-67]. Recently, Yuan et al.[68] published an efficient approach to fabricate ordered mesoporous TiO2-ZrO2 composites through evaporation induced self-assembly (EISA)
process by using amphiphilic triblock copolymer F127 and P123 as structure-directing agents. Overview of all mesoporous TiO2-ZrO2, it is a challenge to avoid entrance of Zr4+ ions into
bulk inside, which may facilitate the recombination of electron-hole pairs then reducing the photocatalytic activity.
Table 2-4 Preparation of mesoporous TiO2
Method Ti precursor Surfactant Surface area (m2/g)
Pore size (nm)
Ref
Sol-Gel
Tantalum ethoxide Octadecylamine Over 500 2.0-4.0 [55] Titanium isopropoxide Pluronic P123 166-381 6.3-2.8 [42] Titanium isopropoxide Pluronic P123 205 4.4 [43] Titanium isopropoxide Triton X-100 187-487 4.6-3.8 [45] Titanium ethoxide Pluronic P123 134-204 8.0-5.5 [44] Titanium isopropoxide Pluronic P123 210-260 5.6-5.2 [69] Titanium isopropoxide CTAB 123.8 12.6 [70]
Hydrothermal
Titanium isopropoxide Pluronic P123 98.7-152.3 8.01-6.19 [71] Titanium n-butoxide - 186.7-295.2 7.23-4.74 [46] Titanium sulfate PEG 200 172.4-234.1 9.94-6.31 [72]
Titanium sulfate CTAB 317.5 2.5 [48]
Titanium isopropoxide Pluronic P123 87-295 10.1-6.9 [73] Microwave Titanium isopropoxide Tetradecylamine 243-622 0.32-0.27 [49]
Sonochemical
Titanium isopropoxide CTAB 853 1.5 [50] Titanium isopropoxide Pluronic P123 112-128 6.7-9.3 [51]
EISA
Titanium isopropoxide CTAB 260-384 2.5-1.9 [52] Titanium n-butoxide Pluronic P123 115-151 14.0-8.3 [74] Titanium isopropoxide CTAB 573 2.5 [54]
2-3-3. Evaporation induced self-assembly (EISA) process
Self-assembly (SA) can be generally defined as the spontaneous and reversible organization of molecular materials through non-covalent interactions (e.g. hydrogen bonding, Van der Waals forces, electrostatic forces, π-π interactions) with no external intervention. Typically examples of SA in materials include the formation of molecular crystals, colloids, lipid bilayer and molecular polymers with periodic assemblies[75]. Above the critical micelle concentration (CMC) in liquid phase, the amphiphilic surfactant was assembled into micelles, spherical or cylindrical structures that the hydrophilic parts of the surfactant in contact with solution while the hydrophobic parts within the interior of micelle (Figure 2-12). Further increases the concentration of surfactant result in the self-organization of micelles into well-ordered hexagonal, cubic, or lamellar mesostructures[8].
Mann et al.[76] successful developed a versatile approaches to the synthesis of organized inorganic materials, which present arrays of pores of tailored dimensions and a great variety of shapes. This method was composed of four steps, including the (1) self-assembled templates (transcriptive synthesis), (2) cooperative assemblies of surfactant and inorganic block (synergistic synthesis), (3) spatially restricted reaction fields (morphosynthesis), and (4) combinations of these approaches (integrative synthesis) into sol-gel chemistry. For example, using cetyltrimethylammonium bromide as template (CTAB), Sanchez et al.[52] demonstrated the formation of titania nanobuilding blocks (NBB), which are self-assembled within a liquid-crystal-like mesostructure around the micelles (Figure 2-13).
Figure 2-12 Schematic phase diagrams for the surfactant in solution.[77]
2-4.
Surface modification
TiO2 is regarded as the most efficient and environmental friendly photocatalyst.
However, its large band gap (~3.2 eV) limits TiO2 only active in the ultraviolet region which
is lower than 10% of the overall solar intensity. Rapid recombination of the photoexcited electron-hole pairs at the surface also inhibits the quantum efficiency. To improve the photocatalytic activity, surface modification of TiO2 is employed. So far, three benefits of
the modifications to photocatalytic activity have been studied: (1) inhibiting recombination of electron and hole by increasing the charge separation, (2) increasing the wavelength response range and (3) changing the selectivity or yield of a particular product.
In recent years, the modification of TiO2 with transition metals[78-80] (V, Cr, Mn, Fe, Co,
Ni and Cu) and noble metals[81-82] (Au, Ag, Pt, Pd, Rh and Ru) for improved photocatalytic performance have been widely studied. The metal doped semiconductor exhibits a particular variation in the Fermi level to create the Schottky barrier. Kamat et al.[83] observed a greater photocatalytic reduction efficiency and higher photocurrent generation of Au/TiO2 nanocomposites by shifting the Fermi level. Since Haruta et al.[84] developed a
dramatic preparation method of golden titania catalysts by deposition-precipitation (DP) with NaOH as precipitating agent. The Au/TiO2 materials have received particular attention
owing to its peculiar properties which is sensitive to gold concentration, pH value, temperature of the solution and calcination temperature. Neither Au nor the TiO2 support is
catalytically active for CO oxidation at low temperature, but Au/TiO2 system shows a
synergetic effect for the reaction[85]. In the literature, these catalysts have been completely evaluated that the activity for CO oxidation is strongly dependent on the size of gold particles. Schüth et al.[86] investigated the influence of the synthesis condition on different supported
catalysts depends strongly on the pH value during precipitation between 8 and 9. For different supported materials used, the increasing catalytic activity of gold catalysts was obtained by optimization of the isoelectric point of the support lies between 6 and 9. Grunwaldt et al.[87] was presented the differences between these catalysts by gold colloids about 2 nm size on TiO2 and ZrO2 in aqueous solutions. Although the particle size on
different supports was comparable, the Au/TiO2 catalyst showed significantly higher activity
than the Au/ZrO2 catalyst corroborating that the support plays a key role in CO oxidation.
Recently, Petit et al.[88] revealed that the TiO2-ZrO2 was better than TiO2 or ZrO2 of CO
oxidation as a result of a relatively high BET surface area, high surface acidity, high thermal stability and great mechanical strength.
2-5.
Photocatalytic reduction of CO
2According to the Intergovernmental Panel on Climate Change (IPCC) assessment report in 2001, the global average surface temperature has increased by about 0.6 °C over the 20 th century, and most of the warming observed over the past 50 years is attributable to human activities. Emissions of greenhouse gases (GHGs) such as CO2, CH4, N2O, HFCs, PFCs,
and SF6 are the primary cause of global warming that continue to change in the climate
system and atmospheric composition throughout the 21st century. The primary contributor of human activities is carbon dioxide (CO2) emissions from fossil fuel combustion. Since
the beginning of the age of industrialization, the atmospheric concentration of CO2 was
increased about 35%, it was approximately more than 130 times greater than the quantity emitted by volcanoes, amounting to about 27 billion tonnes per year. Currently, a great amount of technologies have been developed to reduce CO2 by three approaches: (1) efficient
(3) use of a post-treatment carbon-capture technology and storage of the captured CO2[89].
The capture system refers to the removal of CO2 from industrial flue gas by chemical or
physical adsorption[90], cryogenic processes[91] and membrane separation process[92-93]. The captured CO2 can be stored in deep ocean and aquifer, or injected into geological formations
like depleted oil and gas wells for enhanced recovery of fossil fuel products. Furthermore, more attractive researches use CO2 as a raw material for chemical method, photochemistry,
reforming, electrochemical and biological transformation. However, the production of CO2-free fuel by direct conversion into supply energy is still a challenge. Because CO2 is a
relatively inert and stable compound, the Gibbs free energy (△G) indicated that the equilibriums are highly unfavorable to the expected product (Table 2-5).
There are four main methodologies to transform CO2 into useful chemicals: (1) use high
energy starting materials such as hydrogen and organometallics (2) choose oxidized low energy synthetic targets such as organic carbonates (3) shift the equilibrium to the product side by removing a particular compound and (4) supply physical energy such as light or electricity[94]. Hence, the photocatalytic conversion of CO
2 into more useful compounds is
one of the most promising method because use of solar energy is less energy-consuming than the conventional methods.
Table 2-5 Conversion of CO2 with water into hydrocarbon.[95] Reaction △H° (kJ/mol)(a) △G° (kJ/mol)(b) n (c) E (eV)(d) ) ( 2 ) ( 2 ) ( 2 O 2 1 H O H l g g 286.0 237 2 1.23 ) 2( ) ( ) ( 2 ) ( 2 O 2 1 HCOOH O H 2 CO g l l g 541.1 275 2 1.43 ) 2( ) ( ) ( 2 ) ( 2 H O HCHO O CO g l g g 795.8 520 4 1.35 ) 2( ) ( 3 ) ( 2 ) ( 2 2H O CH OH 21O CO g l l g 727.1 703 6 1.21 ) 2( ) ( 4 ) ( 2 ) ( 2 2H O CH 2O CO g l g g 890.9 818 8 1.06 ) 2( 6 12 6 ) ( 2 ) ( 2 H O 61C H O O CO g l g 467.3 480 4 1.25
(a) Enthalpy change at 298 K, calculated from enthalpy of formation (△H f°). (b) Gibb’s Free energy charge at 298 K.
(c) Numbers of electrons transferred.
(d) Potential energy stored per electron transferred. (e) Photosynthetic reaction.
2-5-1. The mechanism of photoreduction of CO
2The photocatalytic reduction of CO2 by water or hydrogen as a reductant is convenient
and efficient. Two important species involved in CO2 photoreduction are hydrogen atom (・
H) and carbon dioxide anion radical (・CO2-) produced by electron transfer from the
conduction band as follows[94] [96]:
Photoexcited electrons (e−) and positive holes (h+):
vb cb 2 h e TiO hν (2-14)
Excited state of TiO2:
O Ti O Ti4 2 hν 3 (2-15)Hole (h+) react with water or hydrogen:
2 O Ti vb 2 O Ti vb 2 O H 4 h 4 O H 2 H 2 h 2 H 3 3 hν hν (2-16) (2-17)Hydrogen atom (・H) formation:
He
H cb hνTi3O (2-18)
Carbon dioxide anion radical (・CO2-) formation:
cb Ti O 2
2 e CO
CO hν 3 (2-19)
It is expected that these radicals will form other stable substances:
Carbon monoxide (CO) formation:
2 3 O Ti 2 2 O Ti 2 CO CO e CO 2 O H CO H 2 CO 3 3 (2-20) (2-21)Formic acid (HCOOH) formation:
HCOOH H HCOO HCOO H CO O Ti O Ti 2 3 3 (2-22) (2-23)Formaldehyde (HCOH) formation:
HCOH H HCO O H HCO H HCOO O Ti 2 O Ti 3 3 (2-24) Methane (CH4) formation:
4 O Ti 3 2 3 O Ti 2 CH H CH O H 2 CH H 7 CO 3 3 (2-26) (2-27)Methanol (CH3OH) formation:
CH OH H O CH O CH O H CH 3 O Ti 3 3 O Ti 2 3 3 3 (2-28) (2-27)Ethylene (C2H4) or ethane (C2H6) formation:
6 2 O Ti 3 3 2 4 2 O Ti 3 3 H C CH CH H H C CH CH 3 3 (2-30) (2-31)Although the pioneering works on the mechanisms of CO2 photoreduction in aqueous
phase were suggested by Inoue[97] and some researchers have attempted to fully understand, the reaction yield and selectivity of desired products is indefinably. Several examples have pointed out that the activity of photoreduction generally depends on the light radiation, pressure, temperature, reductant and CO2/H2O mole ratio. Kaneco et al.[98] demonstrated
that the reaction rate varies with UV irradiation time. At low light intensities, the rate increases linearly with intensity; at intermediate light intensities, the rate is dependent on the square root of intensity; and at high intensities, the degradation rate is constant. Mizuno et
al.[99] reported an increase in pressure of CO
2 significantly accelerated the reduction in both
water and the caustic solution. This result can be attributed that increasing pressure increases the availability of CO2 adsorbed on the TiO2 surfaces, so that the selectivity of
photocatalytic reduction of CO2 in water is accelerated. In addition, the reaction rate can be
increased by raising the collision frequency and diffusion rate at high temperature. Anpo et al.[100] observed that the total yields of CH4, CH3OH, and CO are larger at 323 K than at 275
K under UV irradiation. It is clear that the photocatalytic reactions proceed more efficiently at higher temperatures. This research also shows the improvement of photocatalytic reactivity with an increase in the ratio of the H2O to CO2; however, an excess amount of H2O
suppresses the reaction rates. Yoneyama et al.[101] used various solvents including water, acetonitrile, 2-propanol, and dichloromethane for photoreduction of CO2 and found that the
CO decreased with the increase of the dielectric constant of the solvent. Such results are due to that the ・CO2- can be greatly stabilized by high dielectric constant solvent, thus
resulting in weak interactions with the photocatalytic surface. Tseng et al.[102] indicate that the methanol yield increases by adding NaOH. The caustic solution dissolves more CO2,
then OH− in aqueous solution also serves as a strong hole scavenger to prevent the
recombination of charge carriers.
2-5-2. The photocatalytic reduction of CO
2over TiO
2In 1979, Inoue et al.[97] have firstly reported that HCHO, HCOOH, CH3OH and a trace
amount of CH4 are produced by the photoreduction of CO2 with H2O under xenon- and
mercury-lamp irradiation of aqueous suspension systems containing a variety of semiconductor powders such as WO3, TiO2, ZnO, CdS, GaP, and SiC. In later years, many
of CO2 using variety of semiconductors. TiO2 catalysts are considered as the most suitable
candidates because of low cost and high stability. In particular, the wide band gap of TiO2
provides sufficient negative and positive redox potentials in conduction bands (CB) and valence bands (VB), respectively, as shown in Figure 2-14. Halmann et al.[103] concluded the summarized photoreduction of CO2 on TiO2 in aqueous suspension systems. Because of
the low solubility of CO2 in water, the photoreduction was performed in a gas-solid interface.
Since recent work in solid-gas systems were introduced by Anpo et al.[104], several researchers reported the photocatalytic reduction of CO2 by TiO2 with gaseous H2O.
Because the efficiency of CO2 reduction was negligible when water vapor was used as the
reductant, the enhancement of reaction rate, solar utilization and the selectivity of products become the most attractive issues in CO2 photoreduction technology.
Loading TiO2 with metals have been demonstrated to suppress recombination of charge
carriers, thus increasing CO2 conversion efficiency. Several researchers[102] used sol-gel
method derived Cu/TiO2 catalysts for photoreduction of CO2 in aqueous phase and found the
yield of methanol is much higher than those without Cu loading. They noted that the copper is an effective electron trapper with optimal loading. Yamashita et al.[105] reported that CH4 was formed from the photoreduction of CO2 with H2O in the presence of TiO2 and
additional yield of CH3OH was observed when Cu was incorporated into the TiO2. Mul et al.[106] investigated the mechanism of photocatalytic conversion of CO2 and H2O on Cu/TiO2
by means of in-situ DRIFT spectroscopy. Results show that the residual carbon which adsorbed on the catalyst surface is involved in photocatalytic CO2 reduction. Ishitani et al.[107] reported that CO2 photoreduction using Pd, Rh, Pt, Au, Cu, and Ru deposited on TiO2
photocatalyst produces CH4 and acetic acid, and the Pd/TiO2 exhibited high selectivity for
CH4 production. Zhang et al.[108] used a gas-solid heterogeneous system for photoreduction
the photocatalytic activity toward CH4 production, and Pt/TiO2 nanotube was more active
than Pt/TiO2 nanoparticle catalyst. Other studies have investigated the synergistic effect of
both metal loading and porous support to enhance photocatalytic reduction of CO2.
Sasirekha et al.[15] prepared the Ru-doped anatase TiO2, which is supported on silica by a
solid-state dispersion method, and tested its photoreduction behavior for CO2 in aqueous
phase. The TiO2/SiO2 catalysts exhibited higher photocatalytic activity than the powdered
TiO2 catalyst, but the Ru-TiO2/SiO2 has a detrimental effect due to the metal hinders the
formation of Ti-O-Si bond. Recently, Li et al.[14] prepared mesoporous silica supported Cu/TiO2 nanocomposites through a one-pot sol-gel method, and photoreductive experiments
were carried out in a continuous-flow reactor using CO2 and gaseous water as the reactants
under the irradiation of xenon lamp. This significantly enhancement of photoreduction rate of CO2 was attributed to the synergistic combination of Cu deposition and high surface area
of SiO2 support. A summary of the important literatures in photoreduction of CO2 by TiO2
Figure 2-14 A schematic illustration of the energy correlation between semiconductor photocatalysts and redox couples in water.[1]
Table 2-6 Summary of the CO2 photoreduction on TiO2.
Photocatalyst Reductant Light source Product Ref
TiO2 Water 75W high pressure Hg lamp, > 280 nm CO, CH4 and CH3OH [100]
TiO2 Liquid CO2 990 W Xe lamp HCOOH [109]
TiO2
0.2 M NaOH
solution 4.5 kW Xe lamp CH4 and HCOOH [99] TiO2
1 M 2-propanol
solution 4.2 kW Xe lamp Methane CH4 [110] TiO2/zeolite Water
75W high pressure Hg
lamp, > 280 nm CH4 and CH3OH [13]
TiO2/zeolite Water vapor
High pressure Hg lamp,
> 280 nm CH4 and CH3OH [111]
TiO2/SiO2
1 M 2-propanol solution
500 W high-pressure
Hg arc lamp Formate and CO [101] Rh/TiO2 H2
Hg lamp, > 280 nm, 370
nm, 450 nm CO and CH4 [112]
TiO2, Cu/TiO2
0.2 N NaOH
solution 8 W Hg lamp, = 254 nm O2 and CH3OH [102] Cu/TiO2
0.2 N NaOH solution
8 W Hg lamp,
= 254, 365 nm CH3OH [113]
Cu-Fe/TiO2 Water vapor
150 W high pressure Hg
lamp CH4 and C2H4 [114]
N3-dye Cu-Fe/TiO2
Water vapor Solar light CH4 and C2H4 [115]
TiO2/SiO2, Ru-TiO2/SiO2 H2 1000 W high-pressure Hg lamp, = 365 nm CH4, HCHO and HCOOH, [15]
Pt/TiO2 Water vapor
300W high pressure Hg
lamp, = 365 nm CH4 [108]
Chapter 3.
Materials and methods
Figure 3-1 shows the flowchart of the experimental design in this study. Catalysts are synthesized through the evaporation induced self-assembly (EISA) process. Their microstructures and physiochemical properties are characterized by means of TEM, TGA, UV-vis, XRD, XPS, XAS and N2 adsorption isothermal. The adsorption and photoreduction
experiments are employed to evaluate their photocatalytic activity, and EPR is carried out to clarify the mechanism of the photocatalytic reduction of CO2 with H2O.
3-1.
Materials
Poly(ethylene glycol)-block-poly(propylene glycol)-block-poly(ethylene glycol)
(Pluronic P123, EO20PO70EO20, M = 5800, Sigma-Aldrich) was used as the structure
directing agent. Titanium isopropoxide (TTIP, Ti(OC3H7)4, Acros, 98.0 %), Zirconium (IV)
tetra-propoxide (ZTP, Zr(OCH2CH2CH3)3, Acros, 70.0 %) and hydrogen tetrachloroaurate
(III) trihydrate (HAuCl4·3H2O, Aldrich, 99.9 %) were used as the precursor of titanium,
zirconium and gold, respectively. Absolute ethanol (CH3CH2OH, Sigma-Aldrich) was used
as the solvent to dissolve the precursors. Acetylacetone (Acac, CH3COCH2COCH3, Fluka,
99.5 %) was used as the chelating agent to control the hydrolysis and condensation of the TiO2 and ZrO2. Hydrochloric acid (HCl, J. T. Baker, 36.5 %) and sodium hydroxide (NaOH,
Riedel-de Haën, 99.0 %) were used to adjust the pH value of solution. They were shown in Table 3-1.
Table 3-1 The structural formula of materials used in this study.
Chemical Structural formula
Pluronic P123 x=20, y=70, z=20 Titanium isopropoxide O Ti O O O
Zirconium (IV) tetra-propoxide O Zr
O O
O
Hydrogen tetrachloroaurate (III)
trihydrate
Cl
Au
Cl
Cl
Cl
H
+OH
2OH
2OH
2 AcetylacetoneFigure 3-1 Flowchart of experimental design in this study.
Preparation of mesoporous Au-loaded and Zr-doped TiO
2Characterization
Chemical property Microstructure Electronic structure
UV-vis EPR XPS TGA BET TEM ICP-MS XRD XAS
Adsorption and photoreduction test
3-2.
Preparation of mesoporous Au-loaded and Zr-doped TiO
2samples
Mesoporous Zr-doped TiO2 samples were prepared via an evaporation induced
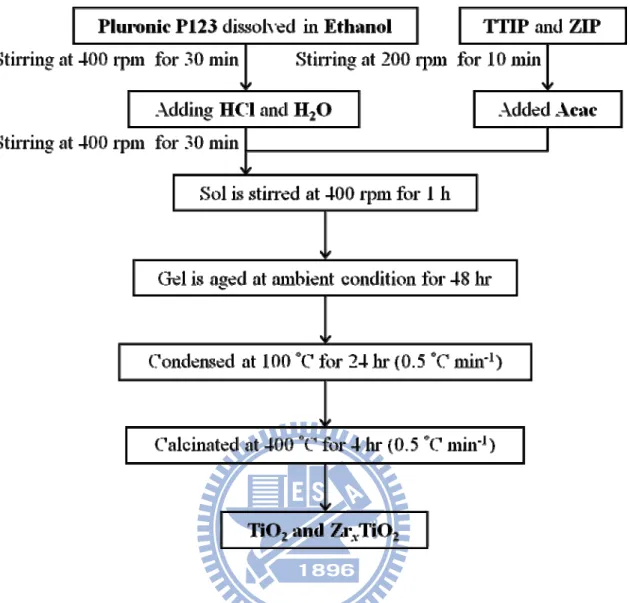
self-assembly (EISA) process. The preparation procedure is shown in Figure 3-2. Pluronic P123 (4.56 g, 0.786 mmol) was firstly dissolved in absolute ethanol (46.8 mL). Then, hydrochloric acid (0.14 m) and deionized water (4.16) were slowly added into the above mixture with vigorous magnetic stirring for 30 min. At the same time, titanium isopropoxide (12 mL), zirconium (IV) tetra-propoxide (x-y mL) together with acetylacetone (4.06 mL) were mixed in a brown glass vial form a reddish yellow complex solution. The complex was added to the surfactant solution to undergo hydrolysis under vigorous stirring for 1 hr. Subsequently, the gel was aged at ambient condition without any perturbation. After approximately 2 days, yellow translucent glasslike xerogel was obtained upon solvent evaporation. The xerogel was heated about at 100 °C for 24 hr (ramp of 0.5 °C min-1) to improve the condensation of the inorganic network, and the surfactant was removed through calcination at 400 °C (ramp of 0.5 °C min-1) for 4 hr in air. The mesoporous TiO2 is called
TiO2, and the Zr-doped TiO2 samples with various doping amount are named as ZrxTiO2,
where x = 0.01, 0.02, 0.03, 0.04, 0.05 and 0.10. The introduction of gold nanoparticles on
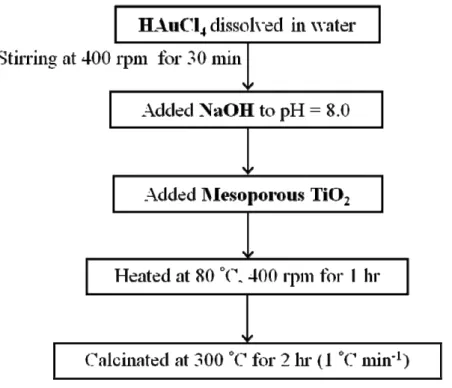
the mesoporous TiO2 support was achieved via a deposition-precipitation (DP) method,
which the procedure is as shown in Figure 3-3. A HAuCl4 aqueous solution (4.0 × 10⁻³ M)
was added to deionized water (20 mL) with vigorous stirring. The pH value was adjusted to 8.0 by dropwise addition of NaOH (1 M), and then 0.5 g of mesoporous TiO2 was dispersed
in the mixture. The resulting solution was heated at 80 °C with continuously stirring for 1 h and the precipitates were separated by centrifugation. As-synthesized samples were dried and finally calcined at 300 °C for 2 hr in air. Based upon synthesis stoichiometry, the Au-loaded TiO2 catalysts are called x% Au-TiO2 where the x resents0.1, 0.5, 1, 2, 4 and 8 wt
Figure 3-2 Synthetic process of mesoporous TiO2 and ZrxTiO2 samples via an EISA method.
Table 3-2 Preparation mesoporous of TiO2 and ZrxTiO2 samples and corresponding names.
Sample name TTIP ZIP P123 Acac HCl H2O EtOH
TiO2 1 0 0.02 1 0.04 6 20 Zr0.01TiO2 1 0.01 0.02 1.01 0.04 6 20 Zr0.02TiO2 1 0.02 0.02 1.02 0.04 6 20 Zr0.03TiO2 1 0.03 0.02 1.03 0.04 6 20 Zr0.04TiO2 1 0.04 0.02 1.04 0.04 6 20 Zr0.05TiO2 1 0.05 0.02 1.05 0.04 6 20 Zr0.1TiO2 1 0.1 0.02 1.1 0.04 6 20
Figure 3-3 Synthetic process of Au-doped mesoporous TiO2 catalyst via a DP method
Table 3-3 Preparation conditions of Au-loaded TiO2 samples and corresponding names.
Sample name TTIP Au(a) P123 Acac HCl H2O EtOH
0.1% Au-TiO2 1 0.1 0.02 1 0.04 6 20 0.5% Au-TiO2 1 0.5 0.02 1 0.04 6 20 1.0% Au-TiO2 1 1.0 0.02 1 0.04 6 20 2.0% Au-TiO2 1 2.0 0.02 1 0.04 6 20 4.0% Au-TiO2 1 4.0 0.02 1 0.04 6 20 8.0 % Au-TiO2 1 8.0 0.02 1 0.04 6 20
3-3.
Characterization
3-3-1. High Resolution Transmission Electron Microscopy (HTEM)
The inner structure of the catalyst was analyzed using a high resolution transmission electron microscopy (HRTEM, Philips TECNAI 20) working at a 200 keV accelerating voltage. The powders were dispersed into acetone with ultrasonication for 30 min, and then the suspension was dropped on a copper grid placed into the specimen stage.
3-3-2. Nitrogen adsorption and desorption isothermal
N2 adsorption and desorption isotherms at 77 K were obtained using a Micromeritics,
TriStar 3000 instrument. The Brunauer-Emmet-Teller (BET) equation and Barret-Joyner-Halenda (BJH) model were used to calculate the specific surface area and pore size distributions, respectively. Prior to the N2 adsorption experiment, over 0.2 g of catalyst
was degassed at 120 °C for 12 hr to remove physisorbed water.
3-3-3. X-ray Powder Diffractometry (XRPD)
X-ray diffraction (XRD) patterns of the catalysts were recorded with a X-ray powder diffractometer (XRPD, MAC Sience, MXP18) using Cu K radiation ( = 0.1546 nm) in the range of 20° to 70° (2θ) with a sampling width of 0.02° and scanning speed of X° min-1. The operating conditions of instrument were at an accelerating voltage of 30 kV and an emission current of 20 mA. The crystalline size (D) of all samples was calculated via a
cosθ λ K D (3-1) D: Crystalline size K: Scherrier constant (0.89)
: Wavelength of X-ray source (Cu K radiation, = 0.1546 nm) : Full width at half maximum (FWHM)
θ: Scatting angle
3-3-4. Electron Paramagnetic resonance (EPR)
The electron paramagnetic resonance spectrometer (EPR, Bruker EMX-10/12) was used to examine the photo-induced charge carriers at X-band frequency. The measurements were carried at 77 K in darkness and UV irradiation. A 250 W Hg lamp (Moritex ,MUV-250U-L) exhibiting a major output wavelength at 365 nm was positioned at a fixed distance from sample cavity. The conditions of the instrument were set at a center field of 3500 G and sweep width of 2000 G. The microwave frequency was 9.49 GHz and the power was 1.0 mW.
3-3-5. Thermo Gravimetric Analysis and Differential Scanning
Calorimetry (TGA/DSC)
The measurements of organic content and thermal transition of the samples were carried out thermo gravimetric analysis (TGA, TA 5100) and differential scanning calorimetry (DSC, Netzsch 404). The samples were heated from temperature to 900 °C with a heating ramp of
5 °C min-1 under an air flow at 60 mL min-1.
3-3-6. X-ray Photoelectron Spectroscopy (XPS)
The surface chemical compositions and speciation on the catalysts were examined by X-ray Photoelectron Spectroscopy (XPS, ESCA PHI 1600) using an Al K radiation (1486.6 eV). The photoelectron was collected into the analyzer with pass energy of 23.5 eV. The collection step size in wide range scan (survey) and high resolution analysis (multiplex) were 1.0 and 0.1 eV, respectively. All analytic process was controlled under ultrahigh vacuum at the pressure below 1.0 × 10⁻⁸ Torr. The binding energies were referenced to the Ti 2p peak at 458.8 eV of the catalyst framework. For the qualification and quantification of each element, curve fitting of XPS spectra was performed on program with appropriate parameters including the binding energy, doublet separation and full-width at half maximum. The atomic ratio was calculated from the integrated peak area which was normalized by sensitive factors. The equation for atomic ration calculation is shown below:
2 2 1 1 2 2 1 1 2 1 ASF A ASF A ASF I ASF I n n (3-2) nx: atomic number
Ix: intensity of species on XPS spectra ASFx: atomic sensitive factor of element Ax: peak area of XPS spectra

![Figure 2-4 Schottky barriers on the surface of metal-semiconductor particle. [19]](https://thumb-ap.123doks.com/thumbv2/9libinfo/8747770.205272/18.892.247.635.112.481/figure-schottky-barriers-surface-metal-semiconductor-particle.webp)
![Figure 2-5 Energies of various semiconductors in aqueous electrolytes at pH= 1. [22]](https://thumb-ap.123doks.com/thumbv2/9libinfo/8747770.205272/19.892.169.726.114.745/figure-energies-various-semiconductors-aqueous-electrolytes-ph.webp)
![Table 2-1 Examples of porous materials and showing the pore size domains. [30]](https://thumb-ap.123doks.com/thumbv2/9libinfo/8747770.205272/24.892.98.787.156.463/table-examples-porous-materials-showing-pore-size-domains.webp)
![Figure 2-10 Schematic view of the mesoporous oxide prepared with polymeric template. [41]](https://thumb-ap.123doks.com/thumbv2/9libinfo/8747770.205272/26.892.111.792.494.1091/figure-schematic-view-mesoporous-oxide-prepared-polymeric-template.webp)
![HPSH [ 氧化數平衡反應式係數 ]](data:image/gif;base64,R0lGODlhAQABAIAAAP///wAAACH5BAEAAAAALAAAAAABAAEAAAICRAEAOw==)