行政院國家科學委員會專題研究計畫 成果報告
貨幣政策法則與匯率波動程度於大小型開放性經濟體系之
差異:福利與景氣循環的數量分析
研究成果報告(精簡版)
計 畫 類 別 : 個別型 計 畫 編 號 : NSC 97-2410-H-004-014- 執 行 期 間 : 97 年 08 月 01 日至 98 年 07 月 31 日 執 行 單 位 : 國立政治大學經濟學系 計 畫 主 持 人 : 黃俞寧 計畫參與人員: 碩士班研究生-兼任助理人員:何佩螢 碩士班研究生-兼任助理人員:吳信毅 碩士班研究生-兼任助理人員:黃柏鈞 碩士班研究生-兼任助理人員:楊馥珉 碩士班研究生-兼任助理人員:陳建璋 碩士班研究生-兼任助理人員:賴建男 博士班研究生-兼任助理人員:陳冠璋 報 告 附 件 : 出席國際會議研究心得報告及發表論文 處 理 方 式 : 本計畫可公開查詢中 華 民 國 98 年 10 月 31 日
行政院國家科學委員會補助專題研究計畫
■ 成 果 報 告
□期中進度報告
(計畫名稱)
貨幣政策法則與匯率波動程度於大小型開放性經濟體系之差異:
福利與景氣循環的數量分析
計畫類別:
√ 個別型計畫 □ 整合型計畫
計畫編號:NSC 97 -2410 -H-004-014-
執行期間:
97 年 8 月 1 日至 98 年 7 月 31 日
計畫主持人:黃俞寧
共同主持人:
計畫參與人員:
研究助理:吳信毅,黃柏鈞, 楊馥珉, 陳建璋, 賴建男, 何
佩螢
, 陳冠璋
成果報告類型
(依經費核定清單規定繳交):√ 精簡報告 □完整報告
本成果報告包括以下應繳交之附件:
□赴國外出差或研習心得報告一份
□赴大陸地區出差或研習心得報告一份
√ 出席國際學術會議心得報告及發表之論文各一份
□國際合作研究計畫國外研究報告書一份
處理方式:除產學合作研究計畫、提升產業技術及人才培育研究計畫、
列管計畫及下列情形者外,得立即公開查詢
□涉及專利或其他智慧財產權,√ 一年□二年後可公開查詢
執行單位:政治大學經濟學系
華 民 國 98 年 10 月 31 日
附件一貨幣政策法則與匯率波動程度於大小型開放性經濟體系之差異: 福利與景氣循環的數量分析 摘要 本研究採取一不對稱之兩國模型, 針對國家規模對於最適貨幣政策法則與 匯率波動性的影響以模擬進行數量化分析。模擬結果顯示, 對於一由兩對稱國家 組成之經濟體系而言, 維持匯率穩定是較佳的; 相反的, 若兩國國家規模大小 不同, 則以通膨穩定為目標之利率法則, 並維持彈性匯率為最適。而不論在何種 政策之下, 小國難以避免地要承受較大的經濟波動。 中文關鍵字:貨幣政策、匯率制度、匯率波動性、泰勒法則、國家規模
The Implications of the Country Size on Optimal Monetary Policy
Rule and Exchange Rate Flexibility: a Quantitative Assessment of
Welfare and Business Cycles
Yu-Ning Hwang1
Department of Economics National Chengchi University
October 2009
Abstract
This study calibrates a model with asymmetrically-sized countries to investigate numerically the impacts of the country size on the optimal monetary policy rule, exchange rate flexibility and welfare. The calibration results demonstrate that an economy composed of two countries with equal size merits exchange rate stability, while the flexible exchange rate is more desirable when the country sizes diverge. Moreover, the smaller country unavoidably suffers from drastic rises in economic fluctuations under all policies.
Keywords: monetary policy, exchange rate regime, exchange rate flexibility, Taylor rule, country size
1
Department of Economics, National Chengchi University, 64, Sec. 2, Tz-nan Rd., Wenshan, Taipei 116, Taiwan. Tel.: 886-2-29393091 ext. 51041. Email: [email protected].
1. Introduction
The objective of this study is to investigate whether and how the optimal monetary policy rules, the exchange rate volatilities as well as macroeconomic fluctuations would differ with the country size. This study examines these issues quantitatively by calibrating a two-country dynamic stochastic general equilibrium model, composed of countries with different population sizes.
In the past decade, most of the researches on exchange rate regimes are conducted under the open-economy dynamic stochastic general equilibrium (DSGE) framework with nominal rigidity and monopolistic competition such as Bacchetta and van Wincoop (2000), Obstfeld and Rogoff (2000) and Corsetti and Pesenti (2001)). Equipped with microfoundation, this model has served as a good platform for the welfare assessment of policies. Among the calibrated works on monetary policy and exchange rate flexibility, many of them reach the same conclusion that the inflation stabilizing rule is the optimal policy, letting exchange rates fluctuate (Kollmann (2002) and Bergin, Shin and Templeton (2007)).
While the conclusion from quantitative studies is derived from models using a small open economy or two equally-sized countries, the effects that the country size may have on the policies and exchange rate fluctuations are neglected. Here comes the main reason that we conduct the research in a numerical way: although the effects of the country size on the business-cycle volatilities and exchange rate fluctuations have been shown significant by analytical and empirical studies (see Furceri and Karras (2007) and Sutherland (2005)), these issues that the magnitudes of these effects on the economy, and the implications of the relative size on the exchange rate and monetary policy have not been evaluated quantitatively by calibrations. Therefore, this research wants to fill in the gap between the quantitative examinations of optimal exchange rate flexibilities in a small open economy and two equally-large countries to examine the “size” effect on the macroeconomy and welfares.
Whether the country size matters is an issue that has been widely discussed in the literature of economic growth, particularly.2 It is known as the “scale effect”, which essentially states that a country of greater population size grows faster than a smaller country. There have been various debates over the presence of the scale effect in the literature. While the scale effects have been carefully examined in the economic growth literature, relatively few researches have examined the effect of the country size on business cycles. The empirical studies, such as Zimmermann (1997), Martin (1998), Furceri and Karras (2007) and Duarte and Wolman (2002)3, demonstrate the
2
For example, Rose (2006) reviews the literature and documents that this scale is significant in a number of studies, though not in the “social phenomenon” of his study.
3
significant relationship between the country size and cyclical economic fluctuations. Among all, Sutherland (2005) is the one that is closest to this research. He finds that the degree of pass-through, the country size and openness as well as other factors in production sectors are primary determinants of the optimal exchange rate volatility. While his research is conducted analytically subject to a great degree of simplifications, we follow the model setup of Bergin et al. (2007) and Bergin (2006) and run calibrations to numerically assess the optimal monetary policy, the cyclical behavior of the macroeconomic fundamentals, exchange rate fluctuations and the welfare that the policy entails. Whether and how these aspects vary with the size of a country is the focus of this study. By taking advantage of calibrations, the model in this research allows more realistic and general specifications such as the Calvo-type staggered pricing to capture the dynamics of macroeconomic variables.
The remainder of this paper is structured as follows. We present the specifications of the model in Section 2. Section 3 describes the model’s parameterization and Section 4 discusses the calibration results. Section 5 concludes.
2. The model
2.1 Production and price setting
There are two countries, Home and Foreign, each of which produces final goods and the intermediate goods for final goods production. The final goods are sold domestically and perfectly competitive, while the intermediate goods are produced on monopolistically competitive markets and traded internationally within the range
[ ]
0,1 . The production of final goods follows:(
)
1 -1 1 -1 -1 t H,t F,t Q = X + 1 - X σ σ σ σ σ σ σ σ α α ⎡ ⎤ ⎢ ⎥ ⎣ ⎦ (1) H,tX and XF,t are the home and foreign intermediate products, which are composed
of differentiated goods: ,
( )
1 -1 , 0 -1 H t H t X x i di η η η η =⎡⎢ ⎤⎥ ⎣∫
⎦ ,( )
-1 , 1 1 , 0 F t F t X x i di η η η η − =⎡⎢ ⎤⎥ ⎣∫
⎦ (2) Based on the composite product indexes, the price indexes can be defined as:
country size and cyclical economic fluctuations. Moreover, Martin (1998) finds that exchange rate volatility is a hump-shaped function of country size which holds both analytically and empirically in his study.3 Other studies showing that smaller countries are more sensitive to shocks include Zimmermann (1997) and Duarte and Wolman (2002).
(
)
1 1 1 1 t H,t F,t P =⎡αP −σ+ 1 -α P −σ⎤−σ ⎣ ⎦ , (3) where( )
1 1 , 1 1 , 0 H t H t P p i di η η − − =⎡⎢ ⎤⎥ ⎣∫
⎦ and( )
1 1 , 1 1 , 0 F t F t P p i di η η − − =⎡⎢ ⎤⎥ ⎣∫
⎦ .σ and η are the elasticities of substitution between the home and foreign goods and a variety of goods.
α
is the share of the expenditure on tradable goods in the total consumption spending and thus is the measure of the trade openness in this model. Given the goods and price indexes, the demand for each type of goods can be obtained: H t, H t, t, t X P Q P σ α − = ⎛⎜ ⎞⎟ ⎝ ⎠( )
( )
, , , , , H t H t H t H t X i P i X P η − =⎛⎜⎜ ⎞⎟⎟ ⎝ ⎠ (4) , , , F t F t t t X P Q P σ α − = ⎛⎜ ⎞⎟ ⎝ ⎠( )
( )
, , , , . F t F t F t F t X i P i X P η − =⎛⎜⎜ ⎞⎟⎟ ⎝ ⎠The foreign country follows the analogous forms which are indicated by asterisks. The population sizes of the home and foreign countries are n and 1 n−
respectively.
2.2 Intermediate goods
The intermediate goods markets are monopolistically competitive. Each of the firms produce goods by using the Cobb-Douglas technology by using capital and labor supply, Kt and Lt. The production function for a firm i is specified as follows:
y it
( )
=A K it t( ) ( )
γ L it 1−γ ,0< < . (5) γ 1 where A is the total factor productivity, subject to a stochastic process: t(
1)
1t a t t
a = + −a ρ a− +ε (6) Here, logat = At. The clearing condition for the good should hold as
( )
( ) (
(
)
)
*( )
, 1 ,
t H t H t
y i =x i + −n n x i . All the firms take the producer-currency pricing (PCP), following the Calvo-type staggered pricing strategies. Each of the intermediate goods producers maximizes its profit:
0 , ,
( )
0 t t h H t t Max E ξ i ∞ + = Π∑
(7) Where ξt t h,+ =βn(
Uc t h′,+ Pt h+) (
Uc t′, Pt)
. The profit ΠH t,( )
i can be stated as below:H t,
( )
i PH t,( )
i MC it( )
ACP t,( )
i xH t,( )
i 1 nxH t,( )
i n ∗ − ⎡ ⎤ ⎡ ⎤ Π =⎣ − − ⎦ ⎢ + ⎥ ⎣ ⎦ (8)The adjustment and marginal costs are defined as:
( )
( )
( )
( )
2 , , 1 , , 1 . , 2 H t H t P P t H t P i P i AC i P i φ − − ⎡ − ⎤ ⎣ ⎦ = (9)( )
(
)
( ) 1 1 1 t t t t t r P W MC α α α α θ α α − − = − (10) where φP characterizes the stickiness of price adjustments. r is the rental rate on tcapital and W denotes the wage. t
The optimal pricing strategy for each individual intermediate goods producer is:
( )
(
)
( )
( )
( )
( )
( )
( )
( )
( )
, , , , , 1 2 , 1 1 , , 1 2 , . 1 1 1 1 . 1 1 H t P H t t P t H t H t H t t P H t t t t H t t P i P i MC AC P i P i P i y i P i E P i y i φ λ λ λ φ ξ α λ − + + + ⎛ ⎞ = + + ⎜⎜ − ⎟⎟ − − ⎝ ⎠ ⎡ ⎛ ⎞⎛ ⎞⎤ + ⎢ ⎜⎜ − ⎟⎜⎟⎜ ⎟⎟⎥ − ⎢⎣ ⎝ ⎠⎝ ⎠⎥⎦ (11) where λ = − ∂(
y it( ) ( )
y it)
(
∂P P)
. 2.3 ConsumersThe optimization problem faced by each consumer is as follows:
0
( )
0 1 1 1-1 max 1 1 1 , , t t t t t t t t t t E U C M L C M H P P ψ ε ρ ω χ β ρ ψ ε ∞ = − + = − − + ⎡ ⎤ ⎛ ⎞ − ⎜ ⎟ − ⎢ ⎥ ⎣ ⎦ ⎝ ⎠∑
(12) s.t.(
)
(
)
( )
, , 1 , 1 1 1 , 1 , 1 0 1 1 t t t t t I t t H t t F t f t H t t t F t t t t t t t t t PC P I P AC M B e B i B e i B M W L P R Kπ
j dj T + + − − − + + + + + = + + + + + + +∫
+ (13) where L is the labor supply with t W as the wage. t β denotes the subjective timepreference, ω characterizes the utility from the money demand and χ is the disutility from the labor supply, ρand ψ are the curvatures of the utility functions associated with consumption and labor supplied respectively.
In the budget constraint, K is the capital that are used in the production of t
intermediate goods with the rental rate R . t I is the investment, which is subject to t
(
)
{
}
21, 1 2 1
t t I t t t
K K K K K
φ + = φ + − . The asset market is assumed incomplete.4 BH t,
and BF t, are two types of bonds which are denominated in the home currency and in
the foreign currency with the interest rates i and t i respectively. tf πt is the profit of the firm. e denotes the nominal exchange rate, defined as the home-currency t
price of one foreign currency.
The first-order conditions associated with the maximization problem of households are: t , t t t W H PC φ ρ = (14)
(
)
1 1 1 t t t t t M C P d ρ ε ε ε χ = − (15) where dt =1 1(
+it)
.2.4 Market Clearing Conditions
All the market should clear. Total demands for the home and foreign intermediate goods should equal to the supplies:
XH t, 1 nXH t, Yt, n ∗ − + = (16) , , 1 F t F t t n X X Y n ∗ ∗ + = − (17) Similarly, the final goods should clear when demand and supply are equal:
t t t 1
(
1)
t I t, B t, t. P t, t t AC AC Q C K K AC Y P P δ + ⎡ ⎤ = +⎣ − − ⎦+ + + (18)(
)
, , 1 1 , . B t P t t t t t I t t t t AC AC Q C K K AC Y P P δ ∗ ∗ ∗ ∗ ∗ ∗ ∗ ∗ + ∗ ∗ ⎡ ⎤ = +⎣ − − ⎦+ + +(19)
The sum of the bonds should equal zero:
BH t, 1 nBH t, 0 n ∗ − + = (20) 4
Obstfeld and Rogoff (2000) address that the incomplete asset market is a more reasonable assumption given that two market frictions exist in the goods markets: monopolistic competition and nominal rigidity.
, , 0 1 F t F t n B B n ∗ + = − (21) Therefore, the home balance of payments can be written as:
(
BH t, BH t, 1) (
S Bt F t, BF t, 1)
P YH t t, i Bt 1 H t, 1 S i Bt t 1 F t, 1 P Ft t ∗ − − − − − − − + − = + + − (22) 2.5 Monetary PoliciesThe monetary authorities adopt two types of monetary policies: the exchange rate peg and the Taylor rules as specified below. Under the fixed exchange rate regime, the exchange rate is fixed at a predetermined level:
et = (23) e
The monetary authorities in these two countries should cooperate to maintain the fixed exchange rate.
Under the Taylor rule, the interest rate reacts to the domestic inflation rate, the output gap and the percentage change in the nominal exchange rate:
ˆ
t t Y t e t
i = +Λ +Λ +Λ Δi π
π
Y e (24) where i is the steady state interest rate, πt is the domestic inflation rate,(
)
ˆ
t t
Y = Y −Y Y denotes the output gap (the output deviation from its steady state level) and Δ is the percentage change in the nominal exchange rate. et Λ , π Λ and Y
e
Λ are the policy parameters that govern the reactions of the monetary policy to the domestic inflation rate, output gap and the percentage change in the nominal exchange rate respectively. Note that, Λ measures the attempt of the central bank to e
control the exchange rate variability. Exchange rates are flexible, allowed to fluctuate if 0Λ = . On the other hand, this policy turns to fix the exchange rate if e Λ is e
large.
2.5 Welfare criteria
The welfare measure of the representative agent is given by the conditional expected lifetime utility function at time zero:
0 0 1-
( )
1 0 1 1 1 t t t t V E C ρ χ H ε ρ ε β ∞ + = − + ⎛ ⎞ = ⎜ − ⎟ ⎝ ⎠∑
(25)can be negligible. The initial state is specified as the deterministic steady state, according to Schmitt-Grohe and Uribe (2007). For a policy r , the welfare cost can be measured by the fraction u of the steady-state consumption which the households c
are willing to give up to be as well off as under the policy r . The welfare cost u of c
the policy r can be written as:
(
(
)
)
1-( )
1 0 0 1 1 1 1 t r c t t t u C ρ χ H ε V ρ ε β ∞ + = − + ⎛ − − ⎞= ⎜ ⎟ ⎝ ⎠∑
(26)Higher value of u indicates greater welfare loss that the policy entails. c
3.
ParameterizationThe calibration is conducted by using the Dynare for Matlab. We take the second-order Taylor expansion around the deterministic steady state where the inflation and shocks are absent. We assess three monetary policies as discussed above and rank their welfare implications with the welfare costs that each of them incurs. The model parameter values are calibrated as below, primarily following the specification of Bergin et al. (2007). Each period is identified as a quarter. First, following conventional settings, we set the quarterly discount factor β as 0.99, and
0.025
δ = for the quarterly depreciation rate. ε is specified as 1 to characterize the unity elasticity of labor supply. Both ρand ψ are set at 4. α =0.8 to reflect the 20% of import in the aggregate goods for G7 countries during the 90’s. The elasticity of individual goods is specified as 7 such that the market up of the goods is equal to 16%. The elasticity between home and imported goods is set at 5. The adjustment cost of investment is specified as φI =φI* = . 4 φB =φB* = ×4 10−6 to characterize the friction on the international asset market, while φP =50 implying 95% of prices adjust four periods after a monetary shock. Technology shocks take the persistence
*
1 1 0.9
ρ =ρ = with the volatility var
( )
ε1 =var( )
ε1* =0.01.4. Calibration Results
Calibrations are conducted for two cases: the baseline model is the equally-sized countries with n=0.5 and the scenario with n=0.3. In the latter case, the home country is the country with smaller size for the discussion which centers on the optimal monetary policy of a small economy.5 Three policies are examined. Firstly,
5
Instead of setting up a small open economy as in Kollmann (2002) or Sutherland (2005), we vary the value of n under the same framework.
we study the fixed exchange rate policy. The implementation of the fixed exchange rate is achieved by the small (home) country which abandons its freedom to adjust the interest rate, but adjusts with the monetary policy of the large (foreign) country to maintain the nominal exchange rate at one. That both countries conduct the Taylor rule, leaving the exchange rate flexible, is the second case. We borrow the optimal inflation targeting rule from Bergin et al. (2007).6 While the countries seem to benefit from the exchange rate stability, as shown below, we try another scenario where the home country implements the exchange rate stabilization policy.
Calibration results are listed in Table 1 and 2. In Table 1, we can see that the policies with exchange rate stabilization outperform the optimal Taylor rule under flexible exchange rates. There are significant welfare gains when moving from policy 2 to 3 for both countries. In particular, under policy 3, while the home country engages in the stabilization of exchange rate, the foreign country reaps the benefit by having greater output without experiencing significant rise in output fluctuations and the exchange rate fluctuation is lowered significantly. The welfare fain of the foreign country is 0.0045%. The gain from the exchange rate stabilization can be even more significant when the interest rate rule of the home country targets that of the foreign country.
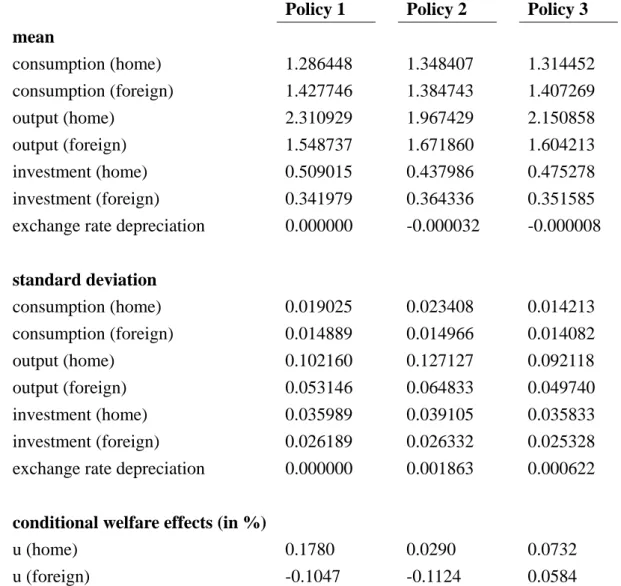
Table 2 shows the opposite results while the foreign country gets larger. The optimal Taylor rule is optimal for both countries with the lower welfare cost equals 0.029% for the home and -0.1124% for the foreign respectively. The small (home) country’s reaction coefficient to the exchange rate depreciation, which is equal to 5, seems ineffective to prevent itself from economic fluctuations.
The comparison of the standard deviation of macroeconomic variables in Table 1 and 2 further demonstrates the effects of the country size on the economy. Under all three policies, the home country suffers from significant rises in the fluctuations of consumption, output and investment when it is downsized. The foreign country, on the contrary, experiences relatively mild, or even lower, fluctuations of the macroeconomic variables.
In sum, the results show that the fluctuations of the economy are higher for the small country, but lower for the large country under same shocks. Exchange rate stabilizations seem to be more desirable in the environment with two equally-sized countries, but exchange rate flexibility is welfare superior when the country size diverges. This result is consistent with the finding by Sutherland (2005). He shows that the monetary policy rule of a larger country should place smaller weight on the exchange rate fluctuation.
6
The optimal monetary policy rule in Bergin et al. (2007) is it = +i 5.0πt .
5. Conclusion
In this study, we use a two-country model to examine the effects of country size on the optimal monetary policy, the exchange rate and macroeconomic fluctuations. Three monetary policies are examined: the fixed exchange rate regime, the Taylor rule and the exchange rate stabilizing policy rule. The calibration results show that the baseline case with two equally-sized countries may prefer exchange rate stability to the flexible exchange rate, while the exchange rate flexibility may be desirable for an economy composed of two unequally-sized countries. For all these policies, the smaller economy encounters greater macroeconomic fluctuations.
There are a number of issues that could be examined further in future studies. In this study, we have assumed that all the goods can be traded internationally. However, Sutherland (2005) finds that the economic openness may influence the exchange rate variability significantly. We may further use this model to analyze business cycles.
References
Bacchetta, P. and E. van Wincoop (2000) “Does Exchange Rate Stability Increase Trade and Welfare?” American Economic Review, 90(5), 1093-1109.
Bergin, P. (2006) “How Well can the New Open Economy Macroeconomics Explain the Exchange Rate and Current Account?” Journal of International Money and Finance, 25, 675-701.
Bergin, P., H. Shin and I. Tchakarov (2007) “Does Exchange Rate Variability Matter for Welfare? A Quantitative Investigation of Stabilization Policies” European Economic Review, 51(4), 1041-1058.
Betts, C. and M. Devereux (2000) “International Monetary Policy Coordination and Competitive Depreciation: A Reevaluation” Journal of Money, Credit and Banking, 32(4), 722-745.
Clarida, R., J. Galí and M. Gertler (1998) “Monetary Policy Rules in Practice: Some International Evidence” European Economic Review, 42, 1033-1067.
Clarida, R., J. Galí and M. Gertler (1999) “The Science of Monetary Policy: A New Keynesian Perspective” Journal of Economic Literature, 37, 1661-1707.
Clarida, R., J. Galí and M. Gertler (2000) “Monetary Policy Rules and Macroeconomic Stability: Evidence and Some Theory” Quarterly Journal of Economics, 105(1), 147-180.
Clarida, R., J. Galí and M. Gertler (2001) “Optimal Monetary Policy in Open vs. Closed Economies: An Integrated Approach” American Economic Review, 91(2),
248-252.
Clarida, R., J. Galí and M. Gertler (2002) “A Simple Framework for International Monetary Policy Analysis” Journal of Monetary Economics, 49(5), 879-904.
Corsetti, G. and P. Pesenti (2001) “Welfare and Macroeconomic Interdependence”
Quarterly Journal of Economics, 116(2), 421-446.
Corsetti, G. and P. Pesenti (2004) “International Dimensions of Optimal Monetary Policy” Journal of Monetary Economics, 52, 281-305.
Devereux, M. (2004) “Should the Exchange Rate be a Shock Absorber?” Journal of International Economics, 62, 359-377.
Duarte, M. and A. L. Wolman (2002) “Regional Inflation in a Currency Union: Fiscal Policy vs. Fundamentals” International Finance Discussion Papers No. 746.
Furceri, D. and G. Karras (2007) “Country Size and Business Cycle Volatility: Scale Really Matters” Journa of Japanese International Economies, 21, 424-434.
Galí, J. and T. Monacelli (2005) “Monetary Policy and Exchange Rate Volatility in a Small Open Economy” Review of Economic Studies, 72(3), 707-734.
Hau, H. (2002) “Real Exchange Rate Volatility and Economic Openness: Theory and Evidence” Journal of Money, Credit and Banking, 34(3), 611-630.
Kollmann, R. (2002) “Monetary Policy Rules in the Open Economy: Effects on Welfare and Business Cycles” Journal of Monetary Economics, 49, 989-1015.
Martin, P. (1998) “The Exchange Rate Policy of the Euro: a Matter of Size?” Journal of the Japanese and International Economies, 12(4), 455-482.
Obstfeld, M. and K. Rogoff (1995) “Exchange Rate Dynamics Redux” Journal of Political Economy 103(3), 624-660.
Obstfeld, M. and K. Rogoff (1998) “Risk and Exchange Rates” NBER Working Paper
No. 6694.
Obstfeld, M. and K. Rogoff (2000) “New Directions for Stochastic Open Economy Models” Journal of International Economics, 50(1), 117-153.
Parrado, E. and A. Velasco (2002) “Optimal Interest Rate Policy in a Small Open Economy” NBER Working Paper No. 8721.
Rose, A. K. (2006) ”Size Really Doesn’t Matter: In Search of a National Scale Effect”
J. Japanese International. Economies, 20, 482-507.
Schmitt-Grohe S. and M. Uribe (2007) “Optimal Simple and Implementable Monetary and Fiscal Rules” Journal of Monetary Economics, 54, 1702-1725.
Sutherland A. (2005) “Incomplete pass-through and the welfare effects of exchange rate variability” Journal of International Economics, 65, 375-399.
Woodford, M. (1999) “Optimal Monetary Policy Inertia” NBER Working Paper No.
7261.
Woodford, M. (2001) “Inflation Stabilization and Welfare” NBER Working Paper No.
8071.
Zimmermann, C. (1997) “International Real Business Cycles among Heterogeneous Countries” European Economic Review, 41(2), 319-356.
Table 1: Baseline model: n=0.5
Policy 1 Policy 2 Policy 3
mean consumption (home) 1.381497 1.359316 1.380172 consumption (foreign) 1.373544 1.392631 1.365992 output (home) 1.749299 1.827900 1.722975 output (foreign) 1.783252 1.699013 1.806013 investment (home) 0.385595 0.400008 0.380172 investment (foreign) 0.391916 0.374959 0.395901
exchange rate depreciation 0.000000 0.000013 -0.000000
standard deviation consumption (home) 0.012861 0.013102 0.014242 consumption (foreign) 0.013812 0.012420 0.015277 output (home) 0.057675 0.056748 0.066142 output (foreign) 0.059010 0.058856 0.063487 investment (home) 0.026492 0.026979 0.026925 investment (foreign) 0.027957 0.027490 0.027221
exchange rate depreciation 0.000000 0.001924 -0.000634
conditional welfare effects (in %)
u (home) 0.0108 0.0108 -0.0058
u (foreign) -0.0061 -0.0013 -0.0058
Note: Policy 1: fixed exchange rate policy; Policy 2: flexible exchange rate under the Taylor rule 5.0
t t
i = +i π ; Policy 3: The home country conducts the exchange rate stabilizing rule:
3.0 5.0
t t t
i = +i π + Δe while the foreign country implements the inflation-stabilizing rule:
5.0
t t
i = +i π
Table 2: Unequally-sized countries: n=0.3
Policy 1 Policy 2 Policy 3
mean consumption (home) 1.286448 1.348407 1.314452 consumption (foreign) 1.427746 1.384743 1.407269 output (home) 2.310929 1.967429 2.150858 output (foreign) 1.548737 1.671860 1.604213 investment (home) 0.509015 0.437986 0.475278 investment (foreign) 0.341979 0.364336 0.351585
exchange rate depreciation 0.000000 -0.000032 -0.000008
standard deviation consumption (home) 0.019025 0.023408 0.014213 consumption (foreign) 0.014889 0.014966 0.014082 output (home) 0.102160 0.127127 0.092118 output (foreign) 0.053146 0.064833 0.049740 investment (home) 0.035989 0.039105 0.035833 investment (foreign) 0.026189 0.026332 0.025328
exchange rate depreciation 0.000000 0.001863 0.000622
conditional welfare effects (in %)
u (home) 0.1780 0.0290 0.0732
計畫成果自評
1. 研究內容與原計畫相符程度: 本研究內容與原計畫主題相符。除了結案報告中所討論之國家規模對於貨幣 政策造成之影響外, 本人亦正與學生在不對稱兩國之模型架構下, 研究國際 通貨對於貨幣政策之影響, 後者將涉及匯率轉嫁程度的探討。因此本計畫大 致維持原計畫案中所提出之想法逐步進行相關研究。 2. 達成預期目標情況: 本研究約達成原計畫預計目標之 90% 3. 研究成果之學術或應用價值: 本研究是以一兩國模型架構,探討國家規模對於最適貨幣政策、匯率與總體 經濟波動性之影響為何。過往匯率相關研究普遍是在一小型開放經濟體系或 是兩規模相等之大國的模型架構下進行探討, 因此可能忽略了國家規模對於 最適貨幣政策與其效果之影響, 此為本研究主要之學術貢獻。本研究成果可 作為政府單位制定貨幣政策之參考。 4. 是否適合在學術期刊發表或申請專利: 本人亦在此兩規模大小不同之國家的模型架構下進行國際通貨 (international currency) 之研究。本計畫預計於國際期刊上發表 1-2 篇文 章。 5. 主要發現或其他有關價值等: 模擬結果顯示, 對於一由兩對稱國家組成之經濟體系而言, 維持匯率穩定 是較佳的; 相反的, 若兩國國家規模大小不同, 則以通膨穩定為目標之利率法 則, 並維持彈性匯率為最適。而不論在何種政策之下, 小國難以避免地要承受較 大的經濟波動。出席國際學術會議心得報告
計畫編號 NSC 97 -2410 -H-004-014- 計畫名稱貨幣政策法則與匯率波動程度於大小型開放性經濟體系之差異:
福利與景氣循環的數量分析
出國人員姓名 服務機關及職稱 黃俞寧 國立政治大學經濟學系助理教授 會議時間地點 2009 年 7 月 15 日~7 月 17 日 澳洲雪梨會議名稱 The 15th International Conference on Computing in Economics and Finance 發表論文題目 The Credit Channel of Monetary Policy and Exchange Rate Flexibility in a
Small Open Economy
一、參加會議經過
7 月 13 日晚間與本系陳樹衡老師與國貿系山本童市老師同時抵達雪梨。於 7 月 15 日下午發 表”The Credit Channel of Monetary Policy and Exchange Rate Flexibility in a Small Open
Economy”一文。13 日晚間參與歡迎茶會, 遇見多位共同參加會議的台灣老師與學生, 並得與 一知名的經濟學家, Michel Juillard (為目前廣為 computational economics 學界使用的套裝軟體 Dynare 之主要作者) 相識。16 日晚間在會議安排下前往雪梨歌劇院觀賞歌劇, 並於 17 日晚間 參加會議晚宴, 與多位知名經濟學家同席, 交換許多對於當今金融海嘯的看法。18 日上午即 啟程返回台灣。 二、與會心得 參與此次會議使我獲益良多, 除了遇見國際經濟學界之知名教授之外, 還得以與多位各國央 行的研究員進行學術與實務上的討論。其中一位是德國央行的 Felix Hammermann, 他與我在 相同的模型架構下進行不同主題的研究; 另一位則是加拿大央行的 Ali Dib, 他以另一模型進 行信用傳遞管道的相關研究。我與他們除了在會議與晚宴中很快地針對彼此的研究交換意見 之外, 於會議結束後並彼此以 email 聯繫, 交換論文與相關意見。此外, 並與舊金山聯準會的 Kevin Lansing (他為 UC Riverside 郭建廷老師長期以來的合作者) 交換了許多對於當今金融海 嘯的看法。整體來說,因此一會議與我的研究有高度相關, 參與此一會議,不論是對於目前 的學術研究或是未來的研究規劃,皆有相當的助益。而對於此次在研討會上所認識的國際學 者,更期能與其有更進一步的交流與討論,以在學術研究上有更深更廣的發展。
The Credit Channel of Monetary Policy and Exchange Rate Flexibility
in a Small Open Economy
Yu-Ning Hwanga Fu-Min Yangb
Department of Economics National Chengchi University
Abstract
The objective of this study is to highlight the role of the banking sector in a small open economy. By including the banking sector in a dynamic stochastic general equilibrium (DSGE) model with the small-open-economy setting, this study examines the significance of the banking sector in a small open economy and the implication of economic openness for the credit market. The steady state analyses show that the inefficiency of the banking sector in a small open economy drives substantial movements of the EFP, same as its role in a closed economy, but higher openness raises the EFP. Furthermore, in line with the current worldwide financial crisis, this study stresses the shock to the collateral effectiveness for the loan services. In face of the financial shock, consumption and output drop as they do in a closed economy, accompanied by the appreciation of the home currency. Thereby the home currency appreciation results in lower export as well as production, and thus exacerbates the impacts of shocks on the economy.
Keyword:Credit Channel; External Financial Premium; Flexible Exchange Rate; Financial Crisis
JEL Classifications: F31; F41; F51
a Department of Economics at National Chengchi University, 64, SEC. 2, Tz-nan Rd., Wenshan, Taipei
116,Taiwan. Tel.: 886-2-29393091 ext. 51641. Email: [email protected].
b Department of Economics at National Chengchi University, 64, SEC. 2, Tz-nan Rd., Wenshan, Taipei
1. Introduction
In the past decade, there are considerable quantities of studies on the monetary policy under open economies, particularly using the DSGE framework. However, most of these studies neglect the banking sector whose importance has been well recognized in a closed economy. On the other hand, although the role of the banking sector in an economy has been examined extensively, these studies are conducted under a closed economy framework. Nevertheless, the ongoing worldwide financial crisis which originated from dysfunctional credit markets in the US has demonstrated how easily the credit market shocks can be spread to other countries under globalization of goods and capital markets. The crisis has cast strong doubt for globalization.
Therefore, it is crucial to investigate the role of the banking sector in an open economy. The objective of this study is to establish a small-open-economy DSGE model with money and banking to examine whether the openness of goods and asset markets alters the role of the credit market and helps dampen the macroeconomic impacts of the financial distress that originates from the credit market. Intuitively, globalization may not affect the role of the banking sector qualitatively, but exchange rate movements driven by the interest rate disparity on the global asset market due to financial shocks may influence the international trades, and thus may alter the impacts of shocks on the production and consumption in an economy quantitatively. By using the model in Goodfriend and McCallum (2007), we will conduct calibrations to examine the role of banking sector numerically. Equipped with the loan market, this study can also have some implications for the current global financial crisis.
The literature on credit channel such as Bernanke and Blinder (1988) and Bernanke and Gertler (1995), followed by many other studies places an emphasis on the implication of the banking sector for monetary policy transmission. Instead of lumping
up all the interest rates, they distinguish various interest rates on the market and show that the external finance premium (EFP), which is the spread between the loan and deposit rates, can be countercyclical and plays the role of the “financial accelerator” of monetary policy. The lower interest rates caused by expansionary monetary policy help improve the balance sheets of firms and thus firms can acquire more funds at lower loan rates. This will reduce the EFP and reinforces the effects of monetary policy on production. The credit channel has been examined extensively by Edwards and Vegh (1997), Kiyotaki and Moore (1997), Carlstrom and Fuerst (1997), Kocherlakota (2000) and others.
However, studies listed above neglect the role of money in the economy with banking sector. Goodfriend and McCallum (2007, henceforth GM (2007)) includes the banking sector in a prevailing DSGE model. They emphasize the quantitative importance of money for an economy with credit market instead, and show that money will be the “financial attenuator” of monetary policy, counteracting the effects of the financial accelerator. The rising demand for deposits which is driven by an expansionary monetary policy raises the EFP. Moreover, by including the loan production process in the model, they can discuss the financial distress that originates from the credit market. While these studies discussed above are conduced under closed economy frameworks and the examination of the credit channel under an open economy is absent, it is crucial to study this issue under a small open economy setting. Moreover, since the exchange rate movements may alter the effects of the credit channel, we have to include money in the model. Therefore, we extend the model with money and banking in GM (2007) by opening up the good and asset markets. All the goods are tradable across countries under a monopolistically competitive market structure. In addition to the home bond issued by the government and held by domestic households only, there is the foreign bond that can be traded internationally. Following the specification of GM (2007), the
loan production requires collaterals and monitoring. The collaterals consist of the home bonds and real capitals. The foreign bonds, however, can not serve as the collateral. Thus, the foreign bonds require a “liquidity premium” to compensate for the lack of the liquidity services that the home bonds can offer. Moreover, the loan process is subject to two shocks: the shock to the value of real capital as collateral for loans and to the monitoring. The credit shocks can characterize the current financial crisis starting from the credit market.
By using this framework, we can see that the banking sector does matter in an open economy and will play an additional role for monetary policy transmission, as the credit channel literature suggests. More efficient loan production does help reduce the EFP in the steady state analysis. On the other hand, in the dynamics, a positive unit shock to productivity causes the EFP to rise, which serves as the financial attenuator as in GM (2007) due to the presence of money. The financial shocks also drive the EFP movements. Furthermore, the calibration results show that higher degree of openness in the good markets raises the EFP in the steady state by inducing greater transactions in bonds, and exacerbates the impacts of the financial shock in dynamics.
The remainder of this paper is structured as follows. In Section 2, we present the specifications of the model and the endogenous determination of interest rates is listed in Section 3. The results of the steady state are listed in Section 4 to examine the quantitative importance of money and banking as well as the economic openness to the economy. In Section 5, we conduct the dynamic analyses to examine how the EFP may behave differently upon shocks in a small open economy, and how the openness may reinforce or dampen the impacts of shocks through exchange rate movements. Section 6 concludes.
2.1 The model
2.1.1 The goods market
Consider a small open economy operates under floating exchange rates and perfect capital mobility in a DSGE structure. There are households, firms, banks, and government. The typical household owns a monopolistically competitive firm and a perfectly competitive bank. All the goods are traded across countries by using capital and labor as inputs which are immobile across countries. The consumption bundle of the countries includes the domestic goods and imports.
The consumption bundle in the country consists of the domestic and imported goods:
( ) ( )
( )( ) ( )
( ) ( ) 1 1 1 1 1 d d m t m t t c c c ν ν ν ν ν ν ν ν α − − α − − − ⎡ ⎤ = ⎢ ⎥ ⎢ ⎥ ⎣ + ⎦The associated price index of the composite goods, and the associated demands for each type of goods are shown below:
( )
1 1 1 1 0 , i i t t P =⎡⎢ P s −ν ds⎤⎥ −ν i d m= ⎣∫
⎦ ,( )
( )
1 1 11 d d m m t t t P P = ⎢⎡α −ν α P −ν⎤⎥ −ν ⎣ + ⎦ ,(
/)
, , i i i t t t t c =α P P −θc i d m= (1) where α αd( )
m are the percentage of the domestic (import) good int
c , with
, 0
d m
α α ≥ , αd +αm = . 1 ν and θ are the price elasticity of each individual goods and each type of goods in the aggregate consumption. i
t
P is the price of goods
associated with the firms of the country. The goods of type d and m present the domestic goods and imported goods respectively.
The consumption demand and the price index in the rest of the world follow the similar fashion:
( )
(
( )
/)
*, x x x t t t t c s = P s P −ν c with *(
x/ *)
t t t c = P P −μ (1) where( )
( ) ( ) 1 1 1 0 x x t t c c s ν ds ν ν ν − − ⎡ ⎤ = ⎢ ⎥ ⎣∫
⎦ and( )
( ) 1 1 1 1 0 x x t t P P s ds ν ν − − ⎡ ⎤ = ⎢ ⎥ ⎣∫
⎦ Here, x tP is the home country’s export price index denominated in the foreign currency and *
t
P is the aggregate price index for the rest of the world. We assume that the law of one price holds for the home goods and thus d x
t t t
P =P e where et is the nominal exchange rate.
2.1.2 The representative household
The typical household’s preference is described by
( )
0 0 log (1 ) log(1 ) t s s t t t t E ∞ β ψ c ψ l n = ⎡ + − − − ⎤ ⎣ ⎦∑
(2)where β∈
( )
0,1 is the subjective discount rate , and c is the period t consumption tbundle.a The time that the typical household own is normalized to one, s t
l and s
t
n are
the labor supplied in the good production and banking sector separately. ψ characterizes the importance of the utility generated by consumption .
The typical household obtains income from the salary of working, revenue from production, receipt of financial assets, and net sales of capital goods. So the budget constraint can be written as
(
)
( )
( )
( )
(
)
* 1 * 1 * 1 1 * 1 1 ( ) ( ) 0 1 (1 ) d t s s A t t t t t t t t t d t t t t t x x t t t t t t t t t t t x t t t t t t t B B d d t t t t t t x t t P s M e B B q K w l n c P P P P e P P P P P s e P s M w l n q K T P P P e B B c P R P R ν θ ν μ δ α − − − − − + + ⎛ ⎞ − + + + + + + ⎜⎜ ⎟⎟ + ⎝ ⎠ ⎛ ⎞⎛ ⎞ − + − − − ⎜ ⎟⎜ ⎟ ⎜ ⎟⎜ ⎟ ⎝ ⎠⎝ ⎛ ⎞ ⎜ ⎟ ⎝ ⎠ ⎛ ⎞ ⎜ ⎟ ⎠ − − − + ⎝ ⎠ = + (3)Here, q is the value of the capital in terms of consumption goods, t δ denotes the
depreciation rate of capital, K represents the capital stock in the period t . t w is the t
real wage rate and is identical across sectors. l is the labor demanded by firms in the t
production sector, while n is the labor demand of banks. t M is nominal holdings of t
high-powered money at the end of t . T stands for the real lump-sum tax payment in t
the period t .
1
t
B+ is the bonds issued by the home government and B t
R denotes the associated
interest rate. We assume that the home bonds are circulated within the country only. On the world asset market, there is one internationally tradable bonds, *
1
t
B+ , with the interest rate B*
t
R . Following the specification in Kollmann (2002), we assume there is a
world interest rate that prevails on the global asset market and the relationship between the world interest rate and the bond rate paid by the individuals in the small open economy is stated as below:
(
*)
(
*) (
* *)
1 1 B 1 -φ / / t t t t R R B+ P χ + = + (4)Eq. (5) captures the friction in the global financial market with φ as the degree of capital mobility. Higher φ represents lower capital mobility and thus the bond rate faced by the home individual will be lower, closer to the world bond rate. χ is the steady-state value of exports
(
x/ *)
t t
2.1.2 The goods market clearing condition
Goods are sold in the domestic market or are exported to the rest of the world. Under monopolistically competitive markets, output is determined by the demand. Therefore, the market clearing condition holds as follows:
( )
1( )
( )
* 0 d x d t d x t t l A t t t d t x t t t t t P P P s P s K A l c P P P P ν ν μ η η θ α − − − − − ⎛ ⎞ ⎛ ⎞ ⎜ ⎟ ⎜ ⎟ ⎝ ⎠ ⎛ ⎞ ⎛ ⎞ − ⎜ ⎟ − = ⎝ ⎠ ⎜ ⎟ ⎜ ⎟ ⎜ ⎟ ⎝ ⎠ ⎝ ⎠ (5) where A t t t t c = +c δq K and l tA is the technology shock to the goods production.
To simplify the model, we will assume that the capital remains at its steady-state level all the time, following GM (2007). Therefore, in the following calibrations, the investment expenditure is completely reflected by the movements of the capital value,
t
q .
2.1.3 Banks
Aside from the real sector, there is a banking sector in the economy to supply the liquidity services, including deposits and loans, to the market. If the typical household wants to consume goods, they need to hold money in the period t for the payment. Therefore, the consumption is subject to the credit-in-advance constraint as follows:
t t t VD c P = (6)
where Dt is the nominal deposits, and V stands for the velocity of deposits.a
The bank as the financial intermediary receives deposits and creates loans. Thus the bank’s asset is composed of the total reserves Mt and loans Lt, while the liability
a The concept comes from the equation of exchange
(
MV =PY)
, similar to the turnover rate of moneyconsists of the demand deposit Dt. The balance sheet is shown below:
t t t
M +L =D (7)
where Mt =τDt with τ as the bank’s reserve ratioa.
To offer loans, the bank has to hire labor for the loan management (such as evaluating customers, monitoring loan repayments, and so on), as well as the acquisition of capital and the home government bonds as the collateral. The internationally traded bonds are not effective to serve as the collateral for loans. The loan production is assumed to follow the Cobb-Douglas form:
(
) ( )
1 1 k 1 n t t t t t t t t L Z b A Θq K A n 0< <1 P α α α − + + = + (8)where Z is the constant measure of the loan production efficiency.
(
1 k 1)
t t t tb+ +A q Kρ +
is the collateral with 1 1/
(
1 B)
t t t t
b+ =B+ P +R . k
t
A and n t
A are shocks to the efficiency of capital as the collateral and the effectiveness of monitoring respectively. The financial distress that originates from the credit market can be characterized by negative shocks to k
t
A and n t
A . Θ is a constant which manifests the inferiority of capital than the government bonds for collateral uses.b
2.2 First-order conditions
Before obtaining the first-order conditions, we let
(
1 1)
/ k
t αct bt+ A Θq Kt t t+
Ω = + (9)
Since all the agents are symmetric, prices of goods in the same category will be
identical. The first-order conditions with respect to *
1 1 , , , , , , s s t t t t t t t l l n K B+ B+ P are
a That is to say, τ is the reserve requirement plus excess reserves.
listed as follows: 1 1 t t t t w l n λ ψ − = − − (10)
(
1)
1 t t t t t c w c n α λ ψ − ⎛ ⎞ =⎜ − ⎟ ⎝ ⎠ (11)(
1)
l t t t l t t t K w A A l η ξ η λ ⎛ ⎞ ⎛ ⎞ =⎜ ⎟ − ⎜ ⎟ ⎝ ⎠ ⎝ ⎠ (12)(
)
1 1 1 1 1 1 1 1 k 1 t t t tl t 0 t t t t t t t t t t t t A l A Θq q E q E c K η λ λ ξ β βη λ λ λ λ ψ δ + + + + + − + ⎛ ⎞ ⎛ ⎞ ⎛ ⎞ ⎜ ⎛ ⎞ ⎟ − Ω − + − + = ⎜ ⎟ ⎜ ⎟ ⎜ ⎜ ⎟ ⎟ ⎝ ⎠ ⎝ ⎠ ⎝ ⎠ ⎝ ⎠ (13)(
)
1 1 1 1 t t 1 B 0 t t t t t t t P E R c P λ β λ λ ψ + + ⎛ ⎞ ⎛ ⎞ − Ω − + + = ⎜ ⎟ ⎜ ⎟ ⎝ ⎠ ⎝ ⎠ (14)(
*)
1 1 1 1 t t t 1 B 0 t t t t t Pe E R P e λ β λ+ + + ⎛ ⎞ − + ⎜ + ⎟= ⎝ ⎠ (15) 1 t t t t d P P ξ ν λ ν ⋅ − = (16)(
)
1 1/ 1 B t t t t b+ =B+ P +R (17)(
*)
* * 1 1/ 1 B t t t t t b+ =e B+ P +R (18) d x t t t P P e = (19)(
)
1 1 1 t t t t t t B t t t t t M M B B g T P P P R P − + − = − + − + (20)The difference between Eq. (15) and Eq. (16) is the liquidity service offered by the home bonds to serve as the collateral for loans. Therefore, the interest rate of foreign bonds has to be high enough to offset its failure to serve as the collateral for loans. Eq. (20) is the law of one price condition and Eq. (21) is the government budget constraint. The government does not hold any international traded bond, but finances its
expenditures by levying tax, issuing high-powered money and bonds. In the symmetric, flexible-price equilibrium, Eqs.(1), (2), (4) - (21) determine the values of twenty endogenous variables, , , , ,c l n w λ, , , , ,Ω L D q B B b e P, *, , , ,* Pd, cA, ,ξ T and *
, B B
R R
given the processes of exogenous variables and government policies M b, and g . For simplicity, we assume the government spending gt equals to zero throughout.
2.3 Exogenous variables
Now we turn to the exogenous variables. There are the world’s price index, import good price, and world interest rate for the rest of the world which have to be specified exogenously, because the small open economy does not have the power to affect the rest of the world. Following Kollmann (2002), we assume all of these exogenous variables follow the AR (1) process:a
* * * * * * * 1 (1 ) 0 1 t ρ ρ t εt ρ Π Π Π Π − Π = − Π + Π + , ≤ < (21) 1 (1 m) m m 0 m 1 m m m t ρ ρ t εt ρ Π Π Π Π − Π = − Π + Π + , ≤ < (22) * * * 1 (1 R) R R 0 R 1 t t t R = −ρ R +ρ π− +ε , ≤ρ < (23) where * * * 1 / t P Pt t− Π = and m m/ m1 t Pt Pt− Π = .
Moreover, the exogenous shocks also obey the AR(1) process:
(
1)
1 ε , 0 1 l l l l l t l l t t A = −ρ A +ρ A− + ≤ρ < (24)(
1)
1 ε , 0 1 k k k k k t k k t t A = −ρ A +ρ A− + ≤ρ < (25)(
1)
1 ε , 0 1 n n n n n t n n t t A = −ρ A +ρ A− + ≤ρ < (26) where *, m, R l, k, n t t tεΠ εΠ ε , ε ε ε are i.i.d. distributed.
In addition, we assume that the growth rate of high-powered money follows the similar evolution process:
1 ε ,h 0 h 1
t t t
h
h =ρ h− + ≤ρ < (28) where ht =logMt−logMt−1. By assuming the monetary policy as the control over the stock of high-powered money, instead of the interest rate rule, this model can generate the interest rates endogenously.
3. Interest rate
3.1 interest rate relationship
Various interest rates are determined endogenously in the model. To compare with the conventional models, we introduce an uncollateralized loan rate, RT, as the benchmark
interest rate. With the specification of the household optimization problem above, T t
R
must satisfy the condition below that resembles the Euler equation in the conventional literature: 1 1 1 T t t t t t t P R E P λ βλ++ + = (29) The link between T
t
R and the government bond rate B t
R could be obtained from Eq. (29) and Eq. (15)
1 1 1 1 B t t T t t t R R cλ ψ ⎛ ⎞ + = − − Ω ⎜ ⎟ + ⎝ ⎠ (30)
From the equation above, we can see that these two rates would be identical when 0
t
liquidity premium of bonds. The interbank rate IB
t
R is the most common tool of the central bank’s monetary policy. Equipped with the reserve market, banks can obtain funds at the cost IB
t
R and
loan them out to households without requiring the collateral at the uncollateralized rate
T t
R . So there must be a no-arbitrage condition between the interbank rate and loan rate for the competitive banks. The marginal cost of the loan making is equal to the wage divided by the marginal product of labor. The combination of Eqs. (7), (8), (9) yields the wage wt. The relationship between these two interest rates must satisfy the condition below:
(
) (
)
(
)(
)
1 1 1 1 1 T IB t t t t t Vw n R R c α τ ⎡ ⎤ + = + ⎢ + ⎥ − − ⎢ ⎥ ⎣ ⎦ (31)On the other hand, households can also obtain loans with collaterals. The relationship between IB
t
R and L
t
R should follow the similar fashion. Since the collateral can help reduce the monitoring effort by the share of α , the marginal cost of the collateralized loans can be multiplied by
(
1−α)
. Therefore, the difference between the collateralized loan rate and the interbank rate can be stated as below:
(
) (
)
(
)
1 1 1 1 L IB t t t t t Vw n R R c τ ⎡ ⎤ + = + ⎢ + ⎥ − ⎢ ⎥ ⎣ ⎦ (32)Lastly, since the bank holds the fraction τ of deposit as the reserve. It is natural for
IB t
R and D
t
R to differ in reserve ratio under the perfectly competitive setup. Thus, the relationship between the deposit and the interbank rate is:
D IB(1 )
t t
R =R − (33) τ
Here EFP can be determined by L IB t t
R −R which reflects the real marginal cost of managing and monitoring effort multiplied by the nominal wage of the loan production. Since the EFP would influence the bank loan strategy, the following analysis will emphasize its movements.
4. Steady state
4.1 Steady state
In this section, we will examine the deterministic steady sate with zero inflation. In the steady state, we assume that the price of capital q= and the nominal exchange rate is 1 equal to 1. Moreover, to simplify the analysis, we assume that P P= d =Pm =Px = 1 and the world price index for the rest of the world P* =0.67. The international interest
rates,RB* and R* are specified as 0.01, following Kollmann (2002). Moreover,
according to GM (2007), gb is the constant share of the government bonds to consumption and is assumed to be 0.6 in the steady state. As a result, Eqs. (1) & (2), (4) - (21) will be degenerated to nine equations for nine endogenous variables
*
,
, , , , , , , B
c l n w λ Ω K b R .
The steady-state conditions can be stated as below. Firstly, the combination of Eq. (7), (8), (9) 1 1 1 V qK n Z gb c c α α τ − ⎛ ⎞ ⎛ ⎞ = ⎜ + ⎟ ⎜ ⎟ − ⎝ ⎠ ⎝ ⎠ Θ (34) Then Eqs. (10) – (14), (6) can be stated as follows:
qK gb c α Ω = +Θ (35)
1 1 l n w ψ λ − = − − (36)
(
1)
( 1) c w cλ n ψ −α = − (37)(
1 1)(
)
K w l η ν η ν − − ⎛ ⎞ = ⎜ ⎟ ⎝ ⎠ (38)(
)
1 1 1 1 1 K 0 c l η ν ψ δ η λ β ν − ⎡ − ⎤ ⎛ − ⎞ Ω − + − + ⎛ ⎞ = ⎢ ⎥ ⎜ ⎟ ⎜ ⎟ ⎝ ⎠Θ ⎢⎣ ⎝ ⎠ ⎥⎦ (39) 1 * 0 x d A P K n c P μ η η α − − − −⎛ ⎞ = ⎜ ⎟ ⎝ ⎠ (40)After these seven steady-state variables are obtained from Eqs. (33) to (39), we can derive RB* and b from the Euler equations associated with the home and foreign *
bonds, and the current account balance by combining Eqs.(4), (6), and (21).
(
*)
1 B B 0 c R R ψ β λ Ω + − ⎛ ⎞ ⎜ ⎟ ⎝ − ⎠ = (27)(
)
* * B m Ac x/P* b R =α − P −μ (28)After solving the core model, we can easily solve the steady-state level of
, , ,
T IB L D
R R R R and the EFP from the interest rate conditions Eqs. (28) – (31).
4.2 Model Parameterization
Now we calibrate the model with the appropriate specification of parameter values. In particular, we will emphasize the importance of the banking sector and how much the economic openness matters.
Firstly, we set the quarterly discount factor β to 0.99, and δ =0.025 for the quarterly depreciation rate as the conventional setting. ψ is assumed to be 0.48 to generate the reasonable labor input in the production sector which is approximately