Factors influencing the usage of
3G mobile services in Taiwan
Chun-Hsiung Liao
Department of Transportation and Communication Management and
Institute of Telecommunications Management,
National Cheng Kung University, Tainan, Taiwan
Chun-Wang Tsou
Center for General Education, I-Shou University, Kaohsiung, Taiwan, and
Ming-Feng Huang
Department of Transportation and Communication Management and
Institute of Telecommunications Management,
National Cheng Kung University, Tainan, Taiwan
Abstract
Purpose – The purpose of this study is to analyse factors influencing subscribers’ usage of 3G mobile services in Taiwan.
Design/methodology/approach – The research model, based on a technology acceptance model (TAM) and added perceived enjoyment, was tested by means of a two-stage structure equation modelling approach. Data were collected from 532 respondents via a web questionnaire survey. Findings – The findings indicate that perceived usefulness, perceived ease of use and perceived enjoyment are positively related to attitude, and perceived enjoyment has a positive influence on perceived usefulness.
Practical implications – The findings suggest users of 3G mobile services need to be provided with more diverse and entertaining ways of communicating, which are at the same time easily accessible and convenient to use.
Originality/value – A new correlation from perceived enjoyment to perceived usefulness was found to have a significant effect. This finding indicates enjoyment as a key factor influences customers’ adoption of 3G services.
Keywords Mobile communication systems, Perception, User studies, Taiwan Paper type Research paper
Introduction
With the development of wireless technology, mobile phones are ubiquitous and have become a part of everyday lives, both in the business setting and at the home. Third generation mobile telecommunications (3G) systems are expected to support more multimedia services and provide improved quality and a higher data rate compared to global system for mobile (GSM (2G)) communications and general packet radio service
The first author appreciates the financial support of the National Science Council in Taiwan (NSC 95-2415-H-006 -002). All of the authors would like to thank the anonymous referees of Online Information Review for their constructive reports and very useful suggestions. Responsibility for any remaining errors is that of the authors.
(GPRS (2.5G)). Their features include the support of online services and the provision of information on demand for location-based and interactive services, not just voice calls. The 3G standard is able to support broadband services since its data transmission rates are about 2 Mbps in indoor communications and less than 1 Mbps in outdoor communications (Gandal et al., 2003; ITU, 2002). The integrated provision of personalised and enhanced multimedia services with secured and private data has been widely available in recent years in the forms of image and video (Lehr and McKnight, 2003; Cheng et al., 2003). In order to obtain a faster transmission rate via the wireless network, the GSM has been developed to include GPRS and EDGE (enhanced data for GSM evolution), but these technologies still do not compare favourably with the modulation technology of 3G, dominated with the wideband code division multiple access (WCDMA) and CDMA2000. There are five operators providing 3G wireless services in Taiwan; of these, three incumbent operators provide both 3G and GSM services and the other two entrants provide 3G services only. Up until the second quarter of 2005, a total of 22.2 million subscribers were using wireless network services for personal communication, including personal handy-phone system (PHS), GSM and 3G services. 3G services provide a broader bandwidth (data rates from 384 kbps to 2 Mbps) than GSM services (offering between 10 kbps to 20 kbps only) do. Because of the heavy burdens of licence fees (of NTD 48.9 billion) and infrastructure expenses, 3G operators would need to acquire new subscribers to achieve economies of scale within a reasonable time period.
The number of 3G subscribers increased significantly from 1.4 million to 2.3 million within the first half of 2006 (DGT, 2006). Such increase in the use of 3G services represents consumers’ willingness to adopt advanced wireless technology and engage in activities using systems where 3G can provide more comprehensive contents than other wireless services. Providing insight into those factors influencing acceptance of technology in the consumer context, the technology acceptance model (TAM), shown in Figure 1, has been considered the most useful for predicting the usage of such technology. This model, proposed by Davis (1989), is based on constructs and relationships in the theory of reasoned action (TRA). (Adams et al., 1992; Dishaw and Strong, 1999; Chau, 1996) In the original TAM are two “perceived” constructs which, it is posited, affect attitudes towards using a technology which in turn affect behaviour intention, and then actual use. In a subsequent TAM model, a link between perceived ease of use (PEOU) and behavioural intention (BI) towards use is included, although not present in the original TAM, because many empirical studies of the TAM have included this link and found a significant relationship between these two factors (Adams et al., 1992; Moore and Benbasat, 1991). Even though both perceived usefulness (PU) and PEOU have been reported to be significantly correlated with
Figure 1. The original TAM
usage, Davis’ findings suggested that PU mediates the effect of PEOU on usage. The model has been shown to have a good predictive validity for the use of several information technologies, including e-mail (Adams et al., 1992; Karahanna and Straub, 1999; Gefen et al., 2000); Word (Chau, 1996), the world wide web (WWW) (Lederer et al., 2000; Moon and Kim, 2001), online shopping (Shih, 2004; O’Cass and Fenech, 2003; Vijayasarathy, 2004), and online business management applications (Ortega et al., 2006). Since Davis’ elucidation of these constructs, numerous researchers have discovered that TAM theory yields consistently high explained variance for why users choose to utilise systems (Adams et al., 1992; Mathieson, 1991).
The TAM was mainly derived from the TRA, which posited that an individual’s willingness, rational decision-making, attitude and subjective norm will affect his/her bi. Subjective norm refers to an individual’s belief that s(he) should perform a certain behaviour because this is expected of him/her by others important to the individual (Fishbein and Ajzen, 1975). According to TRA, attitude and subjective norms independently affect intentions, whereas in the TAM, PU and PEOU are believed to directly affect a person’s attitude. Davis et al. (1989) found the subjective norm did not significantly affect intentions over and above PU and PEOU and therefore omitted it from the original TAM.
Although PU and PEOU are hypothesised and empirically supported as fundamental determinants of user acceptance of a given IT in the TAM, Chau’s (1996) study suggests that PU can be separated into two distinct types: near-term usefulness (i.e. improving job performance or enhancing job satisfaction) and long-term usefulness (i.e. improving one’s career prospects or social status). His results showed perceived near-term usefulness had more significant influence on the bi to use a technology than long-term usefulness, and PEOU had a significant effect on PU but not a significant effect on bis to use. In other words, no matter whether the technology is easy to use or not, the influence of PEOU on BI is not direct but via PU.
Figure 1 shows the original TAM, where external variables, such as an individual’s abilities, the type of IT, the task, and situational constraints, are important factors for evaluating the consequences of using an IT. Additional variables have been incorporated into the original TAM to produce an extended TAM for predicting consumer adoption of emergence of technology and include computer playfulness (Moon and Kim, 2001), cognitive absorption (Agarwal and Karahanna, 2000), and product involvement and perceived enjoyment (PE) (Koufaris, 2002). More recently, Bruner and Kumar (2005) have added perceived fun to their c-TAM model of the consumer context, which has been successfully tested and found to provide a higher explanation of consumers’ adoption of internet devices. In their quest to achieve increased predictive power, Burton-Jones and Hubona (2005) have introduced to the original model additional constructs as external variables, such as individual differences between users, for example, staff seniority, age, and educational level, in order to assess their influence on usage behaviour. From a theoretical perspective, TAM theory needs to be extended to incorporate the aforementioned aspects to achieve greater understanding of the user acceptance process. Nevertheless, Ortega et al. (2006) have empirically tested the basic constructs of TAM without any external variables to apply on the acceptance of online business management and industry effect. With the help of 3G wireless technology, operators can provide 3G services associated with a variety of entertaining and enjoyable service contents (Lehr and McKnight, 2003). Thus, the objective of this study is to provide a theoretically justified research model
that extends TAM by proposing the addition of PE to the use of 3G services, and to empirically test factors influencing usage of 3G mobile services in Taiwan.
Theoretical model and hypotheses
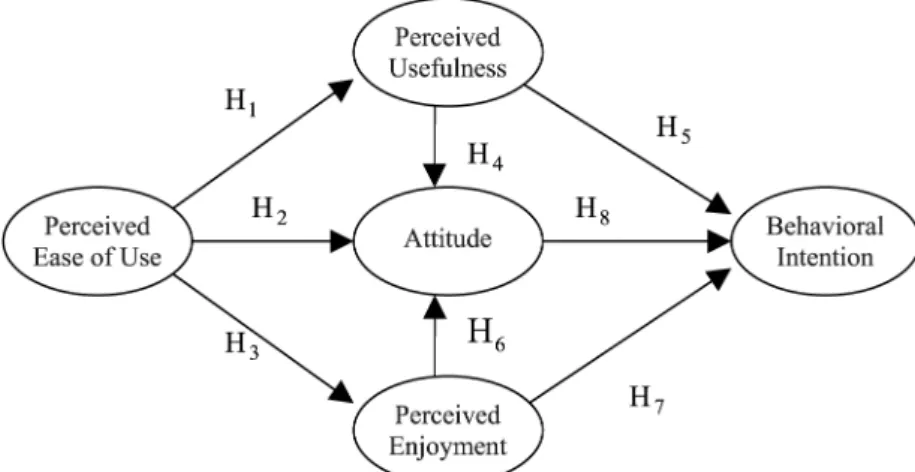
Figure 2 illustrates our research model. It demonstrates that, in addition to salient beliefs (PU and PEOU) in the TAM, PE should be considered in relation to the behaviour of interest. There are two main differences between the original TAM and the current model. First, incorporating PE as an external variable in the research model makes sense because its primary purpose is to adequately elucidate customers’ traits while using 3G services. Second, we chose to use behaviour intention as a surrogate for actual behaviour in order to achieve a parsimonious model that can characterise actual usage.
PEOU
Linkages between PEOU, PU and attitude in TAM theory have been empirically verified in the IT literature. Several studies have employed different usage measures and found them consistent with original TAM results, that is, its two beliefs have a close correlation to attitude (Adams et al., 1992; Igbaria et al., 1997; Burton-Jones and Hubona, 2005) Many studies have also tested the effects of external variables on PEOU (Hong et al., 2002; Igbaria et al., 1997), and found such effects fully independent of PEOU (Compeau et al., 1999; Venkaetesh and Davis, 2000). Recently, researchers have reported PEOU as having a significant effect on PU and fun or playfulness for a specified source (Moon and Kim, 2001; Bruner and Kumar, 2005). Here we define ease of use as the extent to which customers’ use of 3G services is perceived as easy or effortless. Accordingly, we hypothesise that:
H1. PEOU will have a positive effect on PU of 3G mobile services.
H2. PEOU will have a positive effect on attitude towards 3G mobile services.
H3. PEOU will have a positive effect on PE of 3G mobile services.
Figure 2. The research model
PU
In the TAM, it is posited that PU affects attitude and behavioural attitude and bi, both directly and indirectly. In terms of motivation theory, it is argued that if an individual perceives an activity to be beneficial to achieve the valued outcomes, he or she will be more likely to accept the new technology. Different from motivation theory, Davis (1989) defined PU as “the prospective user’s subjective probability that using a specific application system will increase his or her job performance within an organizational context”. Based on his definition, Adams et al. (1992) and Davis et al. (1989) found PU a major determinant of usage behaviour and intention. Subramanian (1994) reaffirmed two belief measurements (PU and PEOU) using a new data set for two different technologies, and found PU, and not PEOU, had a direct effect on usage behaviour employing structural equation modelling (SEM). In this study, we define PU as the degree to which an individual believes that use of 3G services will improve his or her communicational performance. Therefore, we posit that:
H4. PU will have a positive effect on attitude towards using 3G mobile services.
H5. PU will have a positive effect on bi towards using 3G mobile services.
PE
Igbaria et al. (1994) and Moon and Kim (2001) viewed PE as an intrinsic source of motivation, referring to the performance of an activity for no apparent reason other than the process of performing by itself. Their research has proven that PE is positively related to attitude towards using a specified source. Similarly, a system perceived to be easy to use will be conceived as more fun than one which is cumbersome to use. An individual can experience immediate enjoyment or fun from using a specific system, and perceive any active involvement in using new technology to be enjoyable in its own right (Davis et al., 1989; Igbaria et al., 1994). Prior studies of the WWW and mobile commerce have empirically added PE to the TAM to predict user acceptance and adoption of a specific source, and found this construct has a positive effect on attitude towards using a specified system (Dabholkar, 1996; Moon and Kim, 2001; Bruner and Kumar, 2005). In this study, we define PE as the degree to which a person believes that use of 3G services will be interesting and associates it with enjoyment. Therefore, we hypothesise that:
H6. PE will have a positive effect on attitude towards using 3G mobile services.
H7. PE will have a positive effect on bi towards using 3G mobile services.
Attitude (ATT)
The TAM posits that actual usage of a specified system will be determined by an individual’s bi, which is jointly determined by an individual’s attitude towards using a system (Davis et al., 1989). Several empirical studies have shown that an individual’s attitude is influenced by various constructs or external variables, which may be system features, training, documentation, and user support, (Davis et al. 1989, Lucas and Spitler, 1999) In terms of 3G mobile services, their features can be viewed as mere extensions of GSM services with major differences in speed and bandwidth to access gain to the wireless network. Most customers today are likely to have been exposed to 3G mobile phones and to have formed an attitude towards using them, ranging from very favourable to very unfavourable. Prior empirical studies have shown the existence of such generalised attitude and its influence on the evaluation of new
technology in similar situations (Lederer et al., 2000; O’Cass and Fenech, 2003; Moon and Kim, 2001; Vijayasarathy, 2004). In this research, attitude is hypothesised to mediate the influences of the two beliefs and PE on the intention towards using 3G mobile services, and is defined as the degree to which an individual’s attitude is favourably or unfavourably disposed towards using 3G services. Accordingly, we hypothesise that:
H8. Attitude will have a positive effect on bi towards using 3G services.
BI
In the TRA, Fishbein and Ajzen (1975) argued that attitude towards use is an individual’s evaluation of the desirability of a specified system application. Bi to use is a measure of the likelihood that a person will adopt the application, whereas the TAM uses actual usage to represent a self-report measure of time or frequency of adopting the application (Davis et al. 1989). However, it is not easy or practical to obtain an objective measurement of an individual’s intention to engage in a behaviour. Several researches have shown that both theoretical and empirical support exists for the powerful correlation between intention to engage in a behaviour and actual behaviour (Lucas and Spitler, 1999; Dabholkar and Bagozzi, 2002; Vijayasarathy, 2004). To maintain instrument brevity, we adopt behavioural intention as a surrogate for the mergence of behavioural intention and actual usage in the research model, and define it as an individual’s intention to use 3G mobile services.
Methodology
Research context and design
The primary research objectives of this study were to test the hypothesised model, a revised version of the TAM, in order to elucidate customers’ perceptions towards usage of 3G wireless network services in Taiwan. This particular context was selected for several reasons. First, 3G network services provide more and more personalised functions embedded in 3G handset than the GSM system, such as multimedia services and high speed real time transmission. Second, a representative sample of the population of mobile subscribers was easier to obtain than that of conventional phone or internet protocol (IP) phone subscribers. Third, the 3G handset provides customers with a more playful, enjoyable, attractive and technologically innovative product. Finally, the product itself involves a lower level of risk and has less negative impact on health. Thus, 3G mobile services are a salient topic for TAM theory development and identifying relevant implications for practitioners.
The hypothesised model was tested using a questionnaire survey for a context where customers choose mobile services. Each context in the TAM has been tested and validated by applying it to a variety of information systems and its robustness has been proven (Adams et al., 1992; Chau, 1996; Moon and Kim, 2001). Recently, several different scenario versions have been developed with differing amounts of detail in each regarding technology-based innovative products, such as mobile commerce (Wu and Wang, 2005), the wireless phone and PDA (Bruner and Kumar, 2005).
Data collection and sample statistics
This research was accomplished by conducting a questionnaire survey. The questionnaire consists of three main parts. The first part focused on the kinds of functions provided by the 3G operators, for example, multimedia, video phones, etc.
The second part asked questions relating to customers’ perceptions and attitude towards using 3G services, and the last part elicited personal information pertaining to respondents. Items for these measures were mixed together to minimise bias due to response consistency (Davis and Venkatesh, 1995). Respondents were asked to express their agreement/disagreement with a statement on a seven-point Likert-type scale with anchors ranging from “1 ¼ strongly disagree” to “7 ¼ strongly agree”.
The instrument was pre-tested before being posted on the web in order to qualitatively assess content, construct validity, and reliability of measures (Straub, 1989). Semi-structured interviews were conducted with 45 graduate MBA students at the National Cheng Kung University, Tainan, Taiwan. In order to refine constructs and develop measures for each construct in the questionnaire, the seven-point Likert-type scale was pre-tested to adjust independent variables and dependent variables. The constructs used in this study and their measures are presented in Table I.
The data collection instrument for this research was a WWW user survey (www. my3q.com) in the form of a questionnaire posted on the web from 14 March to 21 May 2006 to elicit information regarding attitude and motivation towards web usage. Respondents were informed any information provided would be used for academic purposes only, assured of anonymity, and able to arbitrarily access the WWW User survey without disclosing their identity or registration. To obtain as large a number of respondents as possible, the survey was published through a mobile-related services newsgroup and its page placed on high exposure sites (www.mml.com.tw, www.sogi. com.tw, bbs://ptt.cc). Such exposure produced more long-term and sophisticated users than would have been possible with a paper-and-pencil survey (Novak et al., 2000; van der Heijden, 2003).
After a six-week survey period, a total of 612 respondents had filled out the questionnaire. Of these 612 samples, 532 valid samples were obtained since 80 samples were eliminated due to missing data or found to possess the same IP/mailing address. In addition, some respondents had not spent sufficient time and attention to answering all 30 survey items.
The total sample for the user survey consisted of 532 respondents, 392 of whom (73.7 per cent) were male and 140 (26.3 per cent) were female. Almost half of respondents (44.9 per cent) were students and (23.5 per cent) were engaged in the services industry. Respondents’ ages ranged from 16 to 50 years: 62.6 per cent were aged between 21 to 30 years, 19 per cent between 31 to 40 years, and 14.3 per cent between 16 to 20 years. Over half of respondents had a college or above education level (65.6 per cent), while (17.1 per cent) had attained high school level only. Nine levels of fees per month for mobile services were presented to respondents, ranging from NT$199 to NT$1,600. Of these, 21.4 per cent of respondents chose a monthly fee between NT$400 and NT$599; 20.1 per cent between NT$400 and NT$599; and 2.4 per cent between NT$ 1,400 and NT$1,599.
Results
Construct validity
To assess convergent and discriminant validities of the sampling data, we used principal components extraction with Varimax rotation to examine the 22 items used to measure four of the five latent variables. The Kaiser-Meyer-Olkin measure of sampling adequacy was 0.866, confirming the appropriateness of proceeding with the analysis to reduce the number of items, and identify the dimensions of latent variables. Any item that failed to load on a single factor at 0.5 or greater was dropped. The factor analysis
Scales items Constructs Number of items Sources PU Perceived usefulness 5 Bruner and Kumar (2005), O’Cass and Fenech (2003), Vijayasarathy (2004) PU1 1. Less/more efficient PU2 2. Less /more convenient PU3 3. Less/more relaxing PU4 4. Lower/higher the quality of communicating PU5 5. Useless/useful POEU Perceived ease of use 4 Davis (1989), Burton-Jones and Hubona (2005) PEOU1 1. It is simple to use 3G services PEOU2 2. I learned to use 3G services quickly PEOU3 3. 3G services are understandable and clear PEOU4 4. It is easy to use 3G services PE Perceived enjoyment 6 For me, using the 3G services is: PE1 1. Boring/interesting Bruner and Kumar (2005), Moon and Kim (2001), Dabholkar (1996) PE2 2. Unpleasant/enjoyable PE3 3. Painful/delightful PE4 4. Incurious/curious PE5 5. For me, using the 3G services guide me to explore novelty PE6 6. A great diversity of 3G services can excite me with more imaginative space ATT Attitude 4 Moon and Kim (2001), Vijayasarathy (2004), Lucas and Spitler (1999) For me, using the 3G services is _ for me: ATT1 1. Fruitless/beneficial ATT2 2. Unworthy/worthy ATT3 3. Bad/good idea ATT4 4. Negative/positive attitude BI Behavioural intention 3 Bagozzi et al. (1992), Vijayasarathy (2004), Lucas and Spitler (1999) BI1 1. I a m willing to use 3G services BI2 2. I a m willing to use 3G services in the future BI3 3. I will recommend someone to use 3G services Table I.
The research constructs and operational definitions
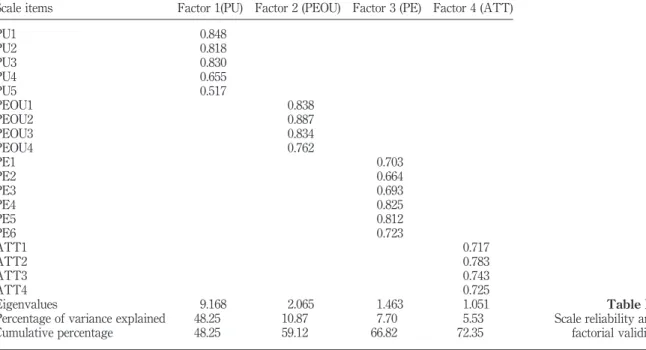
process of dropping an item was repeated until all items loaded at 0.5 or greater on one and only one factor (Lederer et al., 2000; Yang and Yoo, 2004; Vijayasarathy, 2004). The results of factor analysis are shown Table II. All items yielded distinct factors as was anticipated after one rotation, and cumulatively explained 72.356 per cent of the variance.
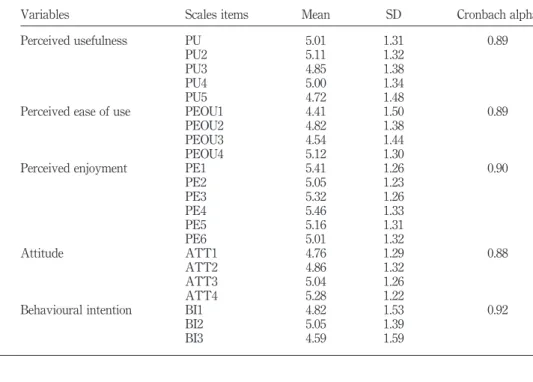
Construct validity was assessed using confirmatory factor analysis (CFA). Table III presents the reliability of the scale items for variables using Cronbach alpha coefficients, which ranged form 0.88 (attitude) to 0.92 (bi). Cronbach alphas indicated that the scales for the constructs were highly reliable. In the dataset, all variables loaded onto their underlying factors were higher than the suggested 0.707 (Nunnally and Bernstein, 1994; Gefen et al., 2000). Given the exploratory nature of this study, the reliability of the scales was deemed adequate.
Measurement model results
We adopted a two-step approach to model construction and testing (Anderson and Gerbing, 1988). First, confirmatory factor analysis was applied to test the hypothesised model as a hypothesis-testing approach to data analysis, that is to say, we postulated a model and then tested it for its validity given the data derived from the 532 respondents. The hypothesised model comprised 22 observed variables and five latent constructs (PU, PEOU, ATT, BI and PE). The model assessment results obtained from the initially hypothesised model generated various indices of model fit by means of the AMOS program. After review, the subsequently modified indices and residuals in the output file were used as criteria for further model assessment.
Goodness-of-fit statistics related to the hypothesised model are represented in
Table IV. We find that, given thex2value and small probability value, confidence
Scale items Factor 1(PU) Factor 2 (PEOU) Factor 3 (PE) Factor 4 (ATT)
PU1 0.848 PU2 0.818 PU3 0.830 PU4 0.655 PU5 0.517 PEOU1 0.838 PEOU2 0.887 PEOU3 0.834 PEOU4 0.762 PE1 0.703 PE2 0.664 PE3 0.693 PE4 0.825 PE5 0.812 PE6 0.723 ATT1 0.717 ATT2 0.783 ATT3 0.743 ATT4 0.725 Eigenvalues 9.168 2.065 1.463 1.051
Percentage of variance explained 48.25 10.87 7.70 5.53 Cumulative percentage 48.25 59.12 66.82 72.35
Table II. Scale reliability and factorial validity
limits cannot be computed as noted in the output file. Moreover, given the known
sensitivity of the x2 statistic to sample size, its use provides little guidance in
determining the extent to which the model does not fit. Thus, it is more beneficial to rely on fit as represented by the root mean square error of approximation (RMSEA), goodness-of-fit index (GFI), adjusted goodness-of-fit index (AGFI) and chi-square
relative to degree of freedom (x2/df). Because thex2statistic is equal to ðN 2 1ÞFmin,
where N is the sample size, this value tends to be substantial when the hypothesised model does not hold and sample size is large (Joreskog and Sorbom, 1993). Yet, the analysis of covariance structures is grounded in large sample theory. As such, large samples are critical to the obtaining of precise parameter estimates, as well as to the tenability of asymptotic distributional approximations (MacCallum et al., 1996).
Findings are common of a x2/df, thereby indicating a need to modify the model in
order to better fit the data (Joreskog and Sorbom, 1993). The GFI is a measure of the relative amount of variance and covariance matrix of the sample data (S) that is jointly explained by S. The AGFI differs from the GFI only in the fact that it adjusts for the number of degrees of freedom in the hypothesised model. The GFI and AGFI can be classified as absolute indices of fit because they basically compare the hypothesised model with no model at all (Byrne, 1998).
Variables Scales items Mean SD Cronbach alpha
Perceived usefulness PU 5.01 1.31 0.89
PU2 5.11 1.32
PU3 4.85 1.38
PU4 5.00 1.34
PU5 4.72 1.48
Perceived ease of use PEOU1 4.41 1.50 0.89
PEOU2 4.82 1.38
PEOU3 4.54 1.44
PEOU4 5.12 1.30
Perceived enjoyment PE1 5.41 1.26 0.90
PE2 5.05 1.23 PE3 5.32 1.26 PE4 5.46 1.33 PE5 5.16 1.31 PE6 5.01 1.32 Attitude ATT1 4.76 1.29 0.88 ATT2 4.86 1.32 ATT3 5.04 1.26 ATT4 5.28 1.22
Behavioural intention BI1 4.82 1.53 0.92
BI2 5.05 1.39
BI3 4.59 1.59
Table III.
Consistency reliability
Model x2/df RMSEA GFI AGFI Variables deleted Initial 3.96 0.109 0.88 0.85 –
Final 2.17 0.046 0.96 0.94 PU5, PE6, PU4, POEU4, BI3,PE2, PE4 Table IV.
The model-fitting process for the measurement model
In Table IV, four model-fit indices of an initial measurement model reveal a poor fit
to the sample data. The values of x2=df ¼ 3:96, RMSEA ¼ 0:109, GFI ¼ 0:88 and
AGFI ¼ 0:85 are below acceptable levels, respectively. The LISREL output indicates that several items in the model have large residuals and/or weak correlations with other items. Thus, to improve model-fit, some indices must surpass the acceptance
levels. First, thex2/df should be relatively low, and both the GFI and AGFI should be
greater than 0.90. Second, the RMSEA should be less than 0.05, indicating good fit and representing reasonable errors of approximation in the population. MacCallum et al. (1996) have elaborated on these cut-points and stated that RMSEA values ranging from 0.08 to 0.10 indicate mediocre fit, and those greater than 0.10 indicate poor fit. To improve the initial model for well fitting the recommended range of acceptability, we examined both the residuals and modification indices (MIs) applied as the process of model assessment. In reviewing both residuals and MIs from the output file, evidence
of misfit in this regard was captured by the MIs, which can be conceptualised as ax2
statistic with one degree of freedom (Joreskog and Sorbom, 1993) and standardised residuals, which represent estimates of the number of standard deviations of the observed residuals from the zero residuals. To reassess the hypothesised model, we follow the criteria that residual values greater than the absolute value of 2.58 are considered to be large and their observed variables must be deleted. This is to preclude possibility of wrong factor which will likely have a pattern of large negative residuals with other factor which it was assigned (representing over-fitting), and an obverse pattern of large positive residuals will be observed with the indicators of this factor when another factor on which it should belong exists (representing under-fitting) (Anderson and Gerbing, 1988). If it makes no substantive sense to free up the parameter exhibiting the largest MI, then one may consider the next largest MI value when the re-specified model would not lead to an over-fitted model (Joreskog and Sorbom, 1993).
There are seven items deleted by a series of para.meter trimming from LISREL output with large residuals and MIs. As for the goodness-of-fit results of our final
measurement model, we see a good improvement in overall model fit (x2=df ¼ 2:17,
RMSEA ¼ 0:46, GFI ¼ 0:96, AGFI ¼ 0:94) by adequately eliminating items with higher residuals (. j2.58j) and MIs. Indeed, our final model resulted in a statistically
significant better-fitting model than was the case for initial model (x2=df ¼ 3:96,
RMSEA ¼ 0:109, GFI ¼ 0:88, AGFI ¼ 0:85). However, our final measurement model reflects a reasonable fit to the data, as judged by the fit indices of chi-square/degrees freedom of ratio, GFI, AGFI and RMSEA.
Structural model results
Following the CFA test to attain the best-fitting model, there were five independent factors comprising the structural model (PU, PEOU, PE, ATT and BI), and the independent measurement model comprised 12 indicator variables (the Xs). In contrast, we observed one dependent factor (PEOU) along with three observed variables, as schematically portrayed in Figure 2. Turning first to the goodness-of-fit statistic, we see that, given the chi-square value and small probability value, confidence limits could not be computed as noted in the output.
Over and above the fit of the model, however, modification indices reveal some evidence of misfit in the model. First, we note maximum MIs of 90.99 and 79.86, associated with the path flowing from PU to PE and the path flowing from PE to PU, respectively. These values indicate that, if these paths were to be freely estimated in a
subsequent model, the overall chi-square value would drop by at least 90.99. Many previous studies have shown that the correlation between two latent variables made no substantive sense (Moon and Kim, 2001; Bruner and Kumar, 2005), and that 3G services could be better enjoyed by customers if multidimensional functions were provided. Given the meaningfulness of the aforementioned influential flows, the model was re-estimated with cited paths re-specified as free parameters. Estimation of the initial model yielded a GFI value of 0.934 and an AGFI value of 0.904. These parameter values were slightly higher than the acceptable value and the RMSEA value of 0.182 also fell outside the acceptable range.
Within the context of this study, the incorporation of the path flowing from PE to PU in the model makes sense because its primary purpose is to increase the well-fitting degree of the model. In reviewing the structural parameter estimates for our final model, shown in Figure 3, we find one parameter, namely the path flowing from PU to bi is non-significant. Important aspects of changes in model fit are that the RMSEA value dropped to 0.047 from 0.182, the GFI value increased to 0.961 from 0.934, AGFI value increased to 0.942 from 0.904, and the chi-square/degrees of freedom ratio dropped to 2.15 from 3.71. When working with structural equation models, it is important to know when to stop fitting a model. Although there are no firm rules or regulations to guide this decision, we followed many researchers’ best yardsticks, including a thorough knowledge of the substantive theory, an adequate assessment of statistical criteria based on information pooled from various indices of fit, and a watchful eye on parsimony (Byrne, 1998).
Discussion
The purpose of this study was to examine whether PU, PEOU, and PE have a positive influence on attitude, which, in turn, affects behaviour intention. The results showed that usage of 3G mobile services is determined by customers’ perceptions of their usefulness and how convenient it is to use and access 3G mobile services’ functions, by PEOU of how easy or effortless it is to communicate with each other, as well as by PE of how many attractive services are provided by the 3G wireless network. Because Davis et al. (1989) found PEOU affects attitude only indirectly through PU, the present
Figure 3.
study extended Davis’s model with the hypothesis that perception of enjoyment incorporated in the theoretical model will be affected by PEOU, and affect the perception of usefulness and attitude respectively.
This study explored PE as a potentially important variable of using 3G mobile services. By means of AMOS software analysis, all estimated path coefficients in the
structural models revealed that, with the exception of H5 (b¼ 0:07, p . 0:05), all
hypotheses were proved to be significant. From the practical viewpoint of the TAM, the correlation between PU and bi is based on an individual’s cognitive assessment of the outcome of behaviour. Consistent with previous research (Davis et al., 1989), PEOU was directly related to PU, attitude and bi; thus, H1-H3 hold. PU was not significantly directly related to bi (H5 does not hold, p-value ¼ 0:197, dotted line), instead indirectly related to bi via attitude (H4 and H8 hold). This may be because of the perception of no significant differences in the usage of 2G and 3G services’ features, especially for voice services. Apparently, a variety of functions in 3G mobile services was not perceived useful by customers, who viewed them as differing only in marketing approaches.
An interesting finding is that PE (b¼ 0:49, p , 0:01) had higher significant effects
on attitude than PU (b¼ 0:29, p , 0:01) and PEOU (b¼ 0:17, p , 0:01). This
suggests that the functional design and simplification of and accessibility for manipulating the 3G handset should receive closer attention and be given more considerations by marketers in the future in order for customers to derive more enjoyment from the process of using it. Of all the factors directly influencing customers’ attitude towards using 3G mobile services, PE is the one that influences attitude the most. Customers who believe their lifestyle can be changed by the various 3G mobile services will be more willing to access a greater diversity of interesting contents. Of particular note, this study discovered a highly significant correlation
between PE and usefulness (bold line) (b¼ 0:59, p , 0:01), suggesting that increasing
the association of enjoyment with a variety of 3G services can greatly contribute to the efficiency and convenience of communicating.
Practitioner implications and limitations
This study has potential implications for the design and implementation of 3G mobile services. Consistent with prior researches (Lucas and Spitler, 1999; Mathieson et al., 2001; Bruner and Kumar, 2005), the two constructs of PU and PEOU are confirmed to still play a major and important role in users’ perceptions of systems and their outcomes. This represents, from customers’ perspective, easier service operation and more efficient communication through ubiquitous wireless network which significantly attract the one who is willing to use 3G mobile services. Despite no significantly functional difference between 2G/2.5G and 3G mobile services in the voice service, existing/potential customers expect exquisite designs in a variety of value-added 3G mobile services (such as video phone and multimedia services) that should be easy to use.
PE was also used as an external variable in the study’s research model because the emergence of 3G mobile services directly or indirectly arouses customers’ attention, curiosity and interest, and results suggested that it contributes to a more positive attitude towards using them. Apparently, adopting 3G mobile services changes customers’ communication patterns and enables them to enjoy more varied lifestyles than in the past. Therefore, 3G services’ versatile and entertaining contents provided by service operators can be treated as an imperative factor to determine whether consumers adopt 3G mobile services or not. Researches on other IT usage, such as
online shopping (Shih, 2004; Vijayasarathy, 2004; O’Cass and Fenech, 2003), surfing the web (Moon and Kim, 2001; Lederer et al., 2000) and relevant software applications (Lucas and Spitler, 1999; Wu and Wang, 2005) has also demonstrated the importance of PE to customers’ attitude towards their usage.
The present study has examined the effect of PU, PEOU and PE on customers’ attitude towards using 3G mobile services. However, several issues are raised by operationalisation of the study’s constructs. First, we have measured post-use evaluation for all constructs. A longitudinal study measuring prior expectations, and not post-use evaluations, of these constructs would increase the theoretical validity of the model. Second, the use of self-report scales to conceptually measure the constructs raises the possibility employed method bias for some of the results. Finally, the three perception measures employed in this study could not determine exactly customers’ attitude towards using 3G mobile services, since the complexity of network and systems was not taken into account. Various antecedent variables of PU and PEOU, such as quality and connection speed to the web from the 3G handset, should be adequately considered in any future research.
References
Adams, D.A., Nelson, R.R. and Todd, P.A. (1992), “Perceived usefulness, ease of use, and usage of information technology: a replication”, MIS Quarterly, Vol. 16 No. 2, pp. 227-47. Agarwal, R. and Karahanna, E. (2000), “Time flies when you’re having fun: cognitive absorption
and beliefs about information technology usage”, MIS Quarterly, Vol. 24 No. 4, pp. 665-94. Anderson, J.C. and Gerbing, D.W. (1988), “Structural equation modeling in practice: a review and
recommended two-step approach”, Psychological Bulletin, Vol. 103 No. 3, pp. 411-23. Bagozzi, R.P., Davis, F.D. and Warshaw, R.P. (1992), “Development and test of a theory of
technological learning and usage”, Human Relations, Vol. 45 No. 7, pp. 659-86.
Bruner, G.C. and Kumar, A. (2005), “Explaining consumer acceptance of handheld internet devices”, Journal of Business Research, Vol. 58 No. 5, pp. 553-8.
Burton-Jones, A. and Hubona, G.S. (2005), “Individual differences and usage behavior: revisiting a technology acceptance model assumption”, The DATA BASE for Advances in Information Systems, Vol. 36 No. 2, pp. 58-77.
Byrne, B.M. (1998), Structural Equation Modeling with LISREL, PRELIS, and SIMPLIS: Basic Concepts, Applications and Programming, Lawrence Erlbaum Associates, London. Chau, P.Y.K. (1996), “An empirical assessment of a modified technology acceptance model”,
Journal of Management Information Systems, Vol. 13 No. 2, pp. 185-204.
Cheng, J.Z., Tsyu, J.Z. and Yu, H.C.D. (2003), “Boom and gloom in the global telecommunications industry”, Technology in Society, Vol. 25 No. 1, pp. 65-81.
Compeau, D.R., Higgins, C.A. and Huff, S. (1999), “Social cognitive theory and individual reactions to computing technology: a longitudinal study”, MIS Quarterly, Vol. 23 No. 2, pp. 145-58.
Dabholkar, P.A. (1996), “Consumer evaluations of new technology-based self-service options: an investigation of alternative models of service quality”, International Journal of Research in Marketing, Vol. 13 No. 1, pp. 29-51.
Dabholkar, P.A. and Bagozzi, R.P. (2002), “An attitudinal model of technology-based self-service: moderating effects of consumer traits and situational factors”, Journal of the Academy of Marketing Science, Vol. 30 No. 3, pp. 184-201.
Davis, F.D. (1989), “Perceived usefulness, perceived ease of use, and user acceptance of information technology”, MIS Quarterly, Vol. 13 No. 3, pp. 319-39.
Davis, F.D., Bagozzi, R.P. and Warshaw, P.R. (1989), “User acceptance of computer technology: a comparison of two theoretical models”, Management Science, Vol. 35 No. 8, pp. 982-1003. Davis, F. and Venkatesh, V. (1995), “Measuring user acceptance of emerging information technologies: an assessment of possible method bias”, Proceedings of the 28th Annual Hawaii International Conference on System Sciences,Vol. 4, pp. 729-36.
Directorate General of Telecommunications (DGT) (2006), “Major statistics on the official web site”, available at: www.dgt.gov.tw/chinese/About-dgt/Publication/95/Statistics.html/ Dishaw, M.T. and Strong, D.M. (1999), “Extending the technology acceptance model with
task-technology fit constructs”, Information & Management, Vol. 36 No. 1, pp. 9-21. Fishbein, M. and Ajzen, I. (1975), Belief, Attitude, Intention and Behavior: An Introduction to
Theory and Research, Addison-Wesley, Reading, MA.
Gandal, N., Salant, D. and Waverman, L. (2003), “Standards in wireless telephone networks”, Telecommunications Policy, Vol. 27, pp. 325-32.
Gefen, D., Straub, D.W. and Boudreau, M.C. (2000), “Structural equation modeling and regression: guidelines for research practice”, Communications of the Association for Information Systems, Vol. 4 No. 7, pp. 1-77.
Hong, W., Thong, J.Y.L., Wong, W. and Tam, K. (2002), “Determinants of user acceptance of digital libraries: an empirical examination of individual differences and system characteristics”, Journal of Management Information System, Vol. 18 No. 3, pp. 97-124. Igbaria, M., Schiffman, S.J. and Wieckowaki, T.J. (1994), “The respective roles of perceived
usefulness and perceived fun in the acceptance microcomputer technology”, Behaviour & Information Technology, Vol. 13 No. 6, pp. 349-61.
Igbaria, M., Zinatelli, N., Cragg, P. and Cavaye, A. (1997), “Personal computing acceptance factors in small firms: a structural equation model”, MIS Quarterly, Vol. 21 No. 3, pp. 279-302.
International Telecommunication Union (ITU) (2002), Internet for a Mobile Generation, 4th ed., Internet Reports, ITU, Geneva.
Joreskog, K.G. and Sorbom, D. (1993), LISREL 8: A User’s Reference Guide, Scientific Software International, Chicago, IL.
Karahanna, K. and Straub, D.W. (1999), “The psychological origins of perceived usefulness and ease-of-use”, Information & Management, Vol. 35 No. 4, pp. 237-50.
Koufaris, M. (2002), “Applying the technology acceptance model and flow theory to online consumer behavior”, Information Systems Research, Vol. 13 No. 2, pp. 205-23.
Lederer, A.L., Maupin, D.J., Sena, M.P. and Zhuang, Y. (2000), “The technology acceptance model and the world wide web”, Decision Support Systems, Vol. 29 No. 3, pp. 269-82.
Lehr, W. and McKnight, L.W. (2003), “Wireless internet access: 3G vs WiFi?”, Telecommunications Policy, Vol. 27 No. 5, pp. 351-70.
Lucas, H.C. and Spitler, V.K. (1999), “Technology use and performance: a field study of broker workstations”, Decision Sciences, Vol. 30 No. 2, pp. 291-311.
MacCallum, R.C., Browne, M.W. and Sugawara, H.M. (1996), “Power analysis and determination of sample size for covariance structure modeling”, Psychological Methods, Vol. 1, pp. 130-49. Mathieson, K. (1991), “Predicting user intentions: comparing the technology acceptance model with the theory of planned behavior”, Information Systems Research, Vol. 2 No. 3, pp. 173-91.
Mathieson, K., Peacock, E. and Chin, W.W. (2001), “Extending the technology acceptance model: the influence of perceived user resources”, The DATA BASE for Advances in Information Systems, Vol. 32 No. 3, pp. 86-112.
Moon, J.W. and Kim, Y.G. (2001), “Extending the TAM for a world-wide-web context”, Information & Management, Vol. 38 No. 4, pp. 217-30.
Moore, G.C. and Benbasat, I. (1991), “Development of an instrument to measure the perception of adopting an information technology innovation”, Information Systems Research, Vol. 2 No. 3, pp. 192-222.
Novak, T.P., Hoffman, D.L. and Yung, Y.F. (2000), “Measuring the customer experience in on-line environments: a structural modeling approach”, Marketing Science, Vol. 19 No. 1, pp. 22-42. Nunnally, J.C. and Bernstein, I.H. (1994), Psychometric Theory, McGraw-Hill, New York, NY. O’Cass, A. and Fenech, T. (2003), “Web retailing adoption: exploring the nature of internet users
web retailing behaviour”, Journal of Retailing and Consumer Services, Vol. 10, pp. 81-94. Ortega, B.H., Martinez, J.J. and Hoyos, M.J.M. (2006), “Analysis of the moderating effect of
industry on online behaviour”, Online Information Review, Vol. 30 No. 6, pp. 681-98. Shih, H.P. (2004), “Extended technology acceptance model of internet utilization behavior”,
Information & Management, Vol. 41 No. 6, pp. 719-29.
Straub, D.W. (1989), “Validating instruments in MIS research”, MIS Quarterly, Vol. 13 No. 2, pp. 146-69.
Subramanian, G.H. (1994), “A replication of perceived usefulness and perceived ease of use measurement”, Decision Sciences, Vol. 25 Nos 5/6, pp. 863-74.
van der Heijden, H. (2003), “Factors influencing the usage of websites: the case of a generic portal in the Netherlands”, Information & Management, Vol. 40 No. 6, pp. 541-9.
Venkaetesh, V. and Davis, F.D. (2000), “A theoretical extension of the technology acceptance model: four longitudinal field studies”, Management Science, Vol. 46 No. 2, pp. 186-204. Vijayasarathy, L.R. (2004), “Predicting consumer intentions to use on-line shopping: the case for
an augmented technology acceptance model”, Information & Management, Vol. 41 No. 6, pp. 747-62.
Wu, J.H. and Wang, S.C. (2005), “What drives mobile commerce? An empirical evaluation of the revised technology acceptance model”, Information & Management, Vol. 42 No. 5, pp. 719-29.
Yang, H. and Yoo, Y. (2004), “It’s all about attitude: revising the technology acceptance model”, Decision Support Systems, Vol. 38, pp. 19-31.
Corresponding author