國立交通大學
交通運輸研究所
博士論文
No.058
近洋貨櫃航商艙位配置
及空櫃調度之最適化研究
Optimization of Containership Slot Allocation and Empty
Container Reposition for a Short-Sea Container Carrier
研 究 生:張嘉惠
指導教授:馮正民 博士
近洋貨櫃航商艙位配置及空櫃調度之最適化研究
Optimization of Containership Slot Allocation and Empty
Container Reposition for a Short-Sea Container Carrier
研 究 生:張嘉惠
Student: Chia-Hui Chang
指導教授:馮正民 博士
Advisor: Dr.Cheng-Min Feng
國立交通大學
交通運輸研究所
博士論文
No.058
A Dissertation
Submitted to Institute of Traffic and Transportation
College of Management
National Chiao Tung University
in Partial Fulfillment of the Requirements
for the Degree of
Doctor of Philosophy
in
Management
May 2009
Hsinchu, Taiwan, Republic of China
近洋貨櫃航商艙位配置及空櫃調度之最適化研究
Optimization of Containership Slot Allocation and Empty
Container Reposition for a Short-Sea Container Carrier
研究生:張嘉惠
指導教授:馮正民 博士
國立交通大學 交通運輸研究所
摘 要
貨櫃航商主要經營海上定期航線,藉由運送貨物以賺取運費收入,其航線泊 靠港口遍佈世界各地,在貨物承攬部份主要與各地之貨務運輸代理商合作,透過 其承攬貨物。實務上,貨櫃航商通常重視“船舶滿載",忽略貨物流向及運費收 入管理,而貨務運輸代理商收入主要來自運費中之佣金,因此他們通常會爭取多 裝載貨物以增加佣金收入,在市場繁榮時,各地之貨務運輸代理商常常會因艙位 問題而引起衝突,最常發生情形為在某一航線上,先泊靠港口之代理商會超裝貨 物在貨櫃船上,導致後續泊靠港口之代理商面臨船上無艙位可裝載之情況。在國 際貿易中,貨物通常從出口導向國家運送至進口導向國家,此一貨物流向不平衡 現象為全球性且無法避免,貨櫃航商因此面臨部份港口累積大量空櫃(積櫃港), 部份港口卻面臨缺乏空櫃以裝載客戶待運送之貨物(缺櫃口),因此貨櫃航商須負 擔大量之空櫃調度費用,在實務之空櫃調度,貨櫃航商通常安排從積櫃港一次調 度大量的空櫃或將空櫃運送至較遠地區之缺櫃港,而這些空櫃將佔用貨櫃船上的 艙位,其結果將造成貨櫃船上減少運送重櫃而賺取運費收入之機會;貨櫃航運業 是一個競爭性的服務業,為了增加公司的競爭優勢,貨櫃航商須對其運費收入及 支出費用進行謹慎管理與控制。 過去國內外有部份學者提出艙位配置及空櫃管理的相關研究,在艙位配置相 關研究中缺乏以近洋航線多港口泊靠及納入空櫃調度成本之研究,在空櫃管理中 缺乏以貨櫃航商經營之海上運輸網絡進行公司整體空櫃調度之研究;因此本研究 以亞洲區間之貨櫃航商為研究標的,近洋航線主要特性為:航線航程較短、泊靠 港口較多且每個港口裝載及卸載頻繁,並分為艙位配置及空櫃管理二部份加以探討。第一部份,本研究提議以收益管理之概念建立重櫃艙位配置計畫,並將空櫃 調度之期望成本納入目標式,以反應貨物流向不平衡之成本,其模式透過線性規 劃求得貨櫃航商在單一航線上之單一航次利潤最大化,其限制條件包含船舶艙位 容量、船舶重量及各港口之貨櫃需求。本模式應用國內某航商在一近洋航線為案 例進行應用與分析,其模式結果與實際航行裝載情形比較,本模式之結果不僅可 獲得較佳收益,並可作為貨櫃航商在管理各地貨務運輸代理商之指導方針,以避 免因艙位問題而引起貨物運輸代理商間之衝突。 第二部份,本研究提出將貨櫃航商經營之海上運輸網絡分為數個地理區域, 空櫃配送則在單一地理區域內進行,此舉可避免實務上因長途運送空櫃而佔用貨 櫃船上之艙位;在模式建構上分為上、下二層問題,上層問題先考量各個港口在 某一段間內貨櫃移動情形,包括進口貨櫃、出口貨櫃、空櫃搬入及空櫃搬出等因 素,以區分各港口之特性(積櫃港/缺櫃港)及數量(供應量/需求量);下層問題則考 量到以不同運送模式(自有艙位/租賃艙位/內陸拖運)之成本差異建構最佳空櫃配 送計畫,其模式透過線性規劃之運輸問題求算總體空櫃運送成本最小,將積櫃港 之空櫃運用至缺櫃港,本模式應用國內某航商整體貨櫃流向資料為案例進行應用 與分析,模式結果可做為貨櫃管理部門在安排空櫃調度之參考,並建議將其空櫃 安排分數個航次裝載至航線剩餘之艙位(空艙位),並進行進一步之分析,可獲得 各港口之空櫃調度所面臨之問題,短期可透過改變空櫃安全存量、租用艙位、額 外派遣船泊或暫時改變其他航線航程來解決部份港口空櫃調度不易之情形,長期 則可考量調整公司整體海上運輸網絡。 關鍵字: 收益管理、艙位配置、空櫃配送、貨櫃航商
近洋貨櫃航商艙位配置及空櫃調度之最適化研究
Optimization of Containership Slot Allocation and Empty
Container Reposition for a Short-Sea Container Carrier
Student:Chia-Hui Chang
Advior:Dr. Cheng-Min Feng
Institute of Traffic and Transportation
National Chiao Tung University
ABSTRACT
Container carriers gain freight revenue by delivering containers from one port to another and depend on shipping agencies to provide cargo. Since a fully loaded carrier brings immediate revenue that is higher than that of a partially loaded carrier, cargo flow and freight revenue management are often ignored. To improve their own revenue, which is supplemented by commissions from ocean freight, shipping agencies typically compete for additional slots on containerships. In booming markets, arguments over slot allocation between shipping agencies occur frequently. These disputes, when coupled with the mismanagement of freight revenue on the part of containerships, often result in a loss of revenue for both shipping agencies and carriers. Container carriers tend to accumulate a large number of unnecessary empty containers at particular ports while other ports face a shortage of empty containers. In practice, carriers often reposition a considerable number of empty containers to others ports with shortage, during a single voyage. However, the operational expenses are substantial when an accumulation of this sort occurs. Empty containers also occupy slots on containerships with the result that carriers are unable to take aboard loaded containers yielding freight revenue. In order to increase their competitive edge, container carriers need to manage revenue and control expenditures.
Several studies have been conducted on slot allocation and empty container management. A few of these studies have sought to maximize profits on short-sea, multiple-port service routes by considering the cost of empty container repositioning. Little attention has been paid to the management of such repositioning within the sea transportation network. This study, which focuses on short-sea service intra-Asian routes, focuses on both aspects of repositioning. The main characteristics of intra-Asian service routes include: voyage distance is short, there are multiple-port calls, and loading and unloading is frequent at each port. These observations are factored into this study which is divided into two parts. The first part incorporates the concept of revenue management with expected cost of empty container repositioning, by offsetting cargo imbalance. Here an optimal model has been formulated via linear programming to maximize operational profit, subject to the constraints of vessel capacity, vessel deadweight, and container demand. A Taiwan container carrier has been used as a case study. The analytical results show that by implementing the proposed model, containerships can increase profits and shipping agencies might avoid friction in a booming market.
The second part of this study proposes to partition the sea transportation network into several geographical regions and distribute empty containers within a single region, in order to reduce the number of occupied slots over a long distance. There are two challenges to this proposal. The first challenge, which is termed the “upper-problem,” lies in identifying and estimating empty container stock for each port. The second challenge or “lower-problem” concerns incorporating modes of transportation into the model. The empty container reposition model that is deemed optimal has been formulated via linear programming with a view to overcoming the transportation problem and minimizing the total cost of transferences within a single region. Here again, the research uses data obtained from a Taiwan container carrier. When this data is applied for analysis, the results show that the allocation of empty containers can be optimized by repositioning them over the course of several voyages where they can occupy unsold slots. With regard to port characteristics, this study
proposes the following strategies to solve empty container problems: charter slots, launching a containership for extra service, or introducing a temporary change in the service route. These are all short-term solutions. In the long-term, sea ports might need to restructure their sea transportation network.
Keywords: Revenue Management, Slot Allocation, Empty Container Reposition, Container Carrier
誌 謝
畢業了…,真的畢業了嗎?連自己都有點詫異,有好長一段時間覺得自己走 在一條看不到盡頭的路上,不管是快步走、慢步走或是原地踏步,都没有選擇的 只能繼續走下去。六年前一次偶然的機遇,進入了交大交研所,那時還是一位職 場上的單身女性,期待將工作與學術結合,而現在已為人妻、為人母;在這條漫 長且艱辛的路程,感謝身旁諸多的長輩、老師、長官、同學、同事及好友的協助 與鼓勵,才能順利完成學業。 首先,感謝恩師馮正民教授在論文研究概念與邏輯思維之指導,並給予學 生在學業、工作及家庭間無限的包容與體諒,老師的待人處事及教學態度,都是 學生一生的學習楷模,僅此致上最深之謝意;研究所修業期間,謝謝黃承傳老師、 黃台生老師、汪進財老師、許鉅秉老師、邱裕鈞老師、毛治國老師及游伯龍老師 給予之教誨與指導,讓學生在課業上收穫良多;謝謝所辦洪瑛瓔小姐及何玉鳳小 姐,洪姐除了協助學校的事務外,更觀心我們的生活,不時的為我們打氣,何小 姐總是扮演我們和老師之間最好的橋樑,讓我們與老師隨時都有最好的溝通與聯 繫。論文口試時,承蒙陳武正院長、吳榮貴教授、梁金樹教授、黃承傳教授及邱 裕鈞老師不吝指正,所提供寶貴的意見與建議,讓本論文更加完整,在此表達感 謝。 在職期間,感謝周宜強董事長、王以湘總經理、張正忠總經理、李勇協理 及正利航業的同仁在工作上給予之協助與包容,讓我能有機會以在職的方式回到 學校,繼續學業,尤其周宜強老師從學生在碩士班、職場工作、博士班進修、論 文議題的啟發到近期的創業,一路以來的協助與支持,感恩之情,莫能言喻。 研究所期間,戴輝煌學長、鍾政祺學長不斷地鼓勵,論文初期構建時丁士 展學長更是耐心與我討論,協助修正;資格考的同學們,不會忘了博二的那一年 暑假,大家挑燈夜戰,全力為資格考準備的時光,同學慧娟、世昌、國洲及昭弘 等彼此互相打氣,都是在交大不可磨滅的記憶;而在新竹準備投稿期間,謝謝韻 嵐、志華、彥曲、靜芳的陪伴,在枯橾的寫作過程中增添歡樂,有你們真好! 最後要感謝的是身邊所有愛我的家人,没有您們的支持,没有今天的我, 外子城印在漫長的求學路程,一路的陪伴與支持,公公、婆婆無怨的協助照顧稚 子宇翔,讓我無後顧之憂於學業與工作,翔翔的童言童語總是我在辛苦一天後最 好的撫慰,居住在台中的雙親對於我從小到大在求學、工作及生活的支持與關心。 最後,僅以此論文獻給我摯愛的家人以及所有關心我、教導我的師長與好 友。 張嘉惠 謹誌 July,2009.於新竹CONTENSTS
ABSTRACT (Chinese)………..I ABSTRACT………III ACKNOWLEDGEMENTS……….VI CONTENTS………VII LIST OF TABLES………...IX LIST OF FIGURES………...X LIST OF NOTATIONS………XIICHAPTER 1 INTRODUCTION……….1
1.1 Research Background………..….………...11.2 Research Motivations and Objectives………..3
1.3 Research Scope………..………..4
1.4 Research Method……….6
1.4.1 An optimal model of containership slot allocation……….6
1.4.2 An optimal model of empty container reposition………...7
1.5 Research Framework………7
CHAPTER 2 LITERATURE REVIEW………..….11
2.1 Container Shipping Market Review………...……….……..….11
2.1.1 Container traffic activity………...………….……...…11
2.1.2 Container trade by route………...…………..………..…….…14
2.1.3 Empty container volume……….……...……….……..…15
2.2 Revenue Management………..…………..………....17
2.3 Containership Slot Allocation……….………….…………..19
2.4 Empty Container Management……….…………...…………..20
2.4 Other Related Researches on Container Shipping…………...…………..25
CHAPTER 3 DESCRIPTION OF PROBLEM………...……30
3.1 Revenue Management and Containership Slot Allocation…….…...……30
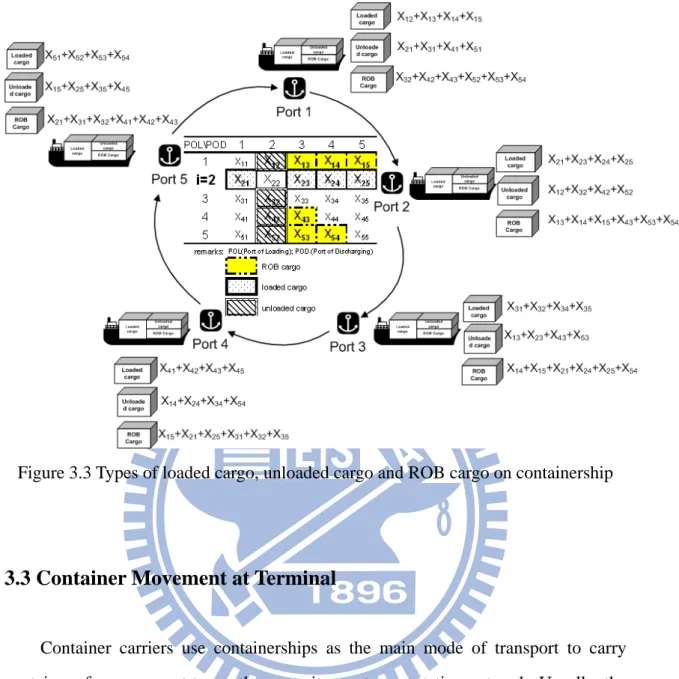
3.2 Service Routes and Cargo Types on Containership …...……….….…….32
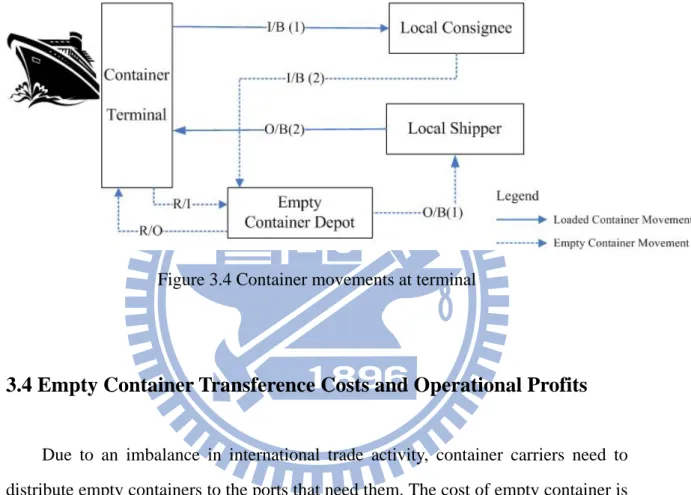
3.3 Container Movement at Terminal……….….……33
3.4 Empty Container Transference Costs and Operational Profits….….……34
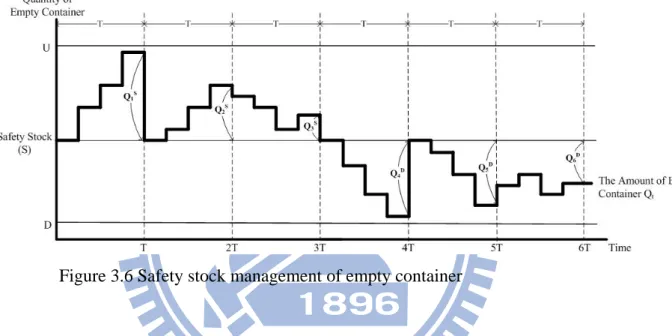
3.5 Safety Stock Management for Empty Containers………..….…...37
3.6 Geographical Regions with the Sea Transportation Network………..…..39
3.7 Summary………...…...…..42
3.7.1 The plan for containership slot allocation ….………..………….…42
3.7.2 The plan for empty container reposition………..………...……..…43
CHAPTER 4 THE PLAN FOR CONTAINERSHIP SLOT
ALLOCATION………...………...45
4.1 Assumptions………..……….……...…46
4.2 Model Formulation………...…………...………….47
4.3 Case Study……….……….………..…50
4.3.1 Background and relevant data….………..…………...50
4.3.2 Computational results…………..……….…………...52
4.4 Strategy Analysis……….………...…………..56
4.4.1 The short-term strategy……….…….……..56
4.4.2 The long-term strategy………...……..……57
4.4.3 Summary………...………..….59
CHAPTER 5 THE PLAN FOR EMPTY CONTAINER
REPOSITION……….……….60
5.1 Assumptions………..………...……….………61
5.2 Model Formulation………..……….………....61
5.3 Case Study……….……….………..65
5.4 Strategy Analysis………...………73
5.4.1 The typical pattern of a port having a surplus of empty containers….75 5.4.2 The typical pattern of a port having a shortage of empty containers...78
5.4.3 The typical pattern of a port having dramatic swings in empty Container stock………...…….80
5.5.4 Summary………..…...……….83
CHAPTER 6 CONCLUSIONS AND RECOMMENDATIONS....…85
6.1 Conclusions……….………85
6.1.1 Containership slot allocation………..………..………85
6.1.2 Empty container reposition………..……….……...86
6.2 Recommendations…..……….……..87
REFERENCES………..89
APPENDIXES……….…95
LIST OF PUBLICATIONS……….104
LIST OF TABLES
Table 1.1 List of region and port for research scope………...5
Table 2.1 Drivers demand growth in container shipping……….…………12
Table 2.2 Forecast container volumes and growth by region………..………….13
Table 2.3 Ideal applications of yield management pricing……….…18
Table 2.4 Literatures on slot allocation for full containers………..………….21
Table 2.5 Literatures on empty container management………....22
Table 2.6 Literature on routing and network……….25
Table 2.7 Literature on cost and economies of scale………26
Table 2.8 Literature on strategic alliance………...…………..27
Table 3.1Comparing condition 1 with condition 2 in freight revenue and operational profits……….………36
Table 4.1 Record of empty container stock……….……….52
Table 4.2 An optimal plan of containership slot allocation for CHI service……....…53
Table 4.3 Comparing optimal containership slot allocation with actuality………..…55
Table 5.1 Types of sailing scheduling for T Line………....….66
Table 5.2 A classified catalogue of geographical group……….………..…67
Table 5.3 Monthly data of supply and demand……….………...68
Table 5.4 An optimal plan of empty container reposition planning……...………..…70
LIST OF FIGURES
Figure 1.1 The map of research scope………5
Figure 1.2 Research flow chart……….………10
Figure 2.1 Share of container trade by region 2007-2010………..13
Figure 2.2 Trend of container growth by region 2007-2010…….………...14
Figure 2.3 Share of container trade route by market……….………...15
Figure 2.4 Container traffic by full and empty, 1980-2007……..………16
Figure 3.1 The concept of containership slot allocation with revenue management...31
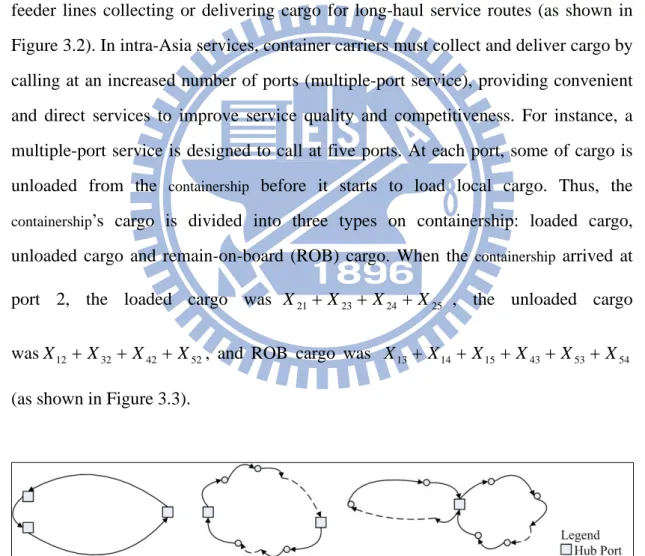
Figure 3.2 Types of service route for long haul service and intra-Asia service……...32
Figure 3.3 Types of loaded cargo, unloaded cargo and ROB cargo on containership.33 Figure 3.4 Container movements at terminal……….…..34
Figure 3.5 Concept of operational profit with empty container reposition……….….36
Figure 3.6 Safety stock management of empty container……….…38
Figure 3.7 Empty container stock and probability of empty container reposition…...39
Figure 3.8 Service route and container movement………...………40
Figure 3.9 Geographical regions of service route………...…….40
Figure 3.10 Geographical regions with sea transportation network……….…41
Figure 3.11 Influence factors for containership slot allocation……....………...…...43
Figure 3.12 Influence factors of empty container reposition…..…...…………..……44
Figure 4.1 A concept chart for containership slot allocation………....…45
Figure 4.2 Service route of CHI service………..……….51
Figure 4.3 Imbalance between O/B cargo and I/B cargo for 20’DC………54
Figure 4.4 Imbalance between O/B cargo and I/B cargo for 40’DC………...……….54
Figure 4.6 Comparing optimal containership slot allocation with actuality in total
loaded container and operational profit………..55
Figure 4.7 Comparing total slots on vessel with optimal slot allocation and actual slot on yoage1 and voyage 2………...………..57
Figure 4.8 Total loaded cargos on vessel vs. operational capacity………...…58
Figure 4.9 Problem, action and result for actual slots on voyage1 and voyage 2 …...59
Figure 5.1 A concept chart for empty container reposition………..…60
Figure 5.2 Geographical groups in sea transportation………..…67
Figure 5.3 Supply port and demand port for 20’DC……….……68
Figure 5.4 Supply port and demand port for 40’DC………....……69
Figure 5.5 Supply port and demand port for 40’HQ………...…...…..69
Figure 5.6 The plan of empty container reposition for 20’DC……….…71
Figure 5.7 The plan of empty container reposition for 40’DC……….…72
Figure 5.8 The plan of empty container reposition for 40’HQ………...…….…73
Figure 5.9 Illustration of characteristic for selected ports………..………..74
Figure 5.10 Trend of 20’DC empty container stock at TYO port…………....………76
Figure 5.11 Trend of 20’DC empty container stock at JKT port………..………77
Figure 5.12 Illustration of problem and action in JKT port……….78
Figure 5.13 Trend of 20’DC empty container stock TAO port………...…...…79
Figure 5.14 Illustration of problem and action in TAO port………...……….79
Figure 5.15 Trend of 20’DC empty container stock at KHH port………..……..80
Figure 5.16 Trend of 20’DC empty container stock at HKG port…………..………..81
Figure 5.17 Trend of 20’DC empty container SGN port………..…82
Figure 5.18 Illustration of problem and action in SGN port………...……….83
LIST OF NOTATIONS
P set of calling port in a service route, P=
{
1,2,3,K,n}
K set of container specifications, K =
{
1:20'DC, 2:40'DC,3:40'HQ}
container carriers provide different specification of container for fitting customer demand, it includes 20'×8'×8'6"dry container, 40'×8'×8'6"dry container,
" 6 ' 9 ' 8 '
40× × high cube, 45'×8'×9'6"high cube, 20'×8'×8'6"open top,
" 6 ' 8 ' 8 '
40× × open top, 20'×8'×8'6"flat rack, 40'×8'×8'6" flat rack, 20'×8'×8'6"
reefer, and 420'×8'×9'6"40’ reefer high cube. The flat rack container and open top container are designed to load over-width, over-length, or over-height cargo which effects stowage plan on containership. Three major types of containers
" 6 ' 8 ' 8 '
20× × dry container (20’DC), 40'×8'×8'6"dry container (40’DC), and
" 6 ' 9 ' 8 '
40× × high cube (40’HQ) which were considered.
H set of port within sea transportation network, H =
{
TYO,NGO,...,KEL,...,SUB}
F number of port group within sea transportation networkM set of transportation mode to reposition empty container.
⎪ ⎪ ⎭ ⎪ ⎪ ⎬ ⎫ ⎪ ⎪ ⎩ ⎪ ⎪ ⎨ ⎧ = truck by drayage inland network tion transporta sea without carriers other from slot charted network tion transporta sea within carriers other from slot charted network tion transporta sea within vessel on slot owned M : 4 , : 3 , : 2 , : 1
i index of loading port in a service route,i∈P j index of unloading port in a service route, j∈ P k index of container specification,k∈K
n The number of calling ports in a service route h index of port with sea transportation network, h∈H
t index of time period
f index of port group within sea transportation network, f ∈ F α index of loading port within sea transportation network, α∈H
(
)
[
(
)
]
[
(
)
]
{
mod 1, 1 mod 1, , 1 mod 1}
1 = + + + + − +
+ z n z n z n n
Tz K
The sequence of calling ports on the service route
( ) (
[
1)
mod]
11 = + − +
+ l z l n
Tz
z the first calling in sequence of calling ports on the service route, z∈ P l the number in the sequence of calling port in the service route, 1≤l≤n
k ij
FR Freight revenue including ocean freight and surcharge of k∈Ktype container delivered from port i∈P to port j∈ (unit:USD) P
k ij
VC Variable cost of k∈Ktype container delivered from port i∈P to port P
j∈ , including handling charges at both ports, commissions, container rental (depreciation) and repair, truck fee and depot stowage costs (unit:USD)
k ij
OP Operational profit of k∈Ktype container delivered from port i∈P to port P j∈ (unit:USD) k j k i k ij k ij k ij FR VC EC EC OP = − − − k i
EC Expected cost of empty container reposition of k∈Ktype at loading port P i∈ (unit:USD) k i k i k i k i CS HE POR EC = ⋅ ⋅ k i
CS Empty container stock of k∈Ktype in loading port i∈P
⎪ ⎩ ⎪ ⎨ ⎧ + − − = in reposition conatiner empty of t spend shortage out or in container empty reposition non balance out reposition container empty of t save surplus CSik cos , , 1 , , 0 cos , , 1 k i
HE Handling cost of empty container of k∈Ktype at loading port i∈P (unit: USD)
k i
POR Probability of repositioning empty container of k∈Ktype at loading port
P i∈
k j
EC Expected cost of empty container reposition of k∈Ktype at discharging port P j∈ (unit:SD) k j k j k j k j CS HE POR EC = ⋅ ⋅
k j
CS Empty container stock of k∈Ktype at discharging port j∈ P
⎪ ⎩ ⎪ ⎨ ⎧ − − + = in reposition conatiner empty of t save shortage out or in container empty reposition non balance out reposition container empty of t spend surplus CSkj cos , , 1 , , 0 cos , , 1 k j
HE Handling cost of empty container of k∈Ktype at discharging port j∈ P (unit:USD)
k j
POR Probability of repositioning empty container of k∈Ktype at discharging port P
j∈
i
OC The operational capacity on containershipwhen containershipleaved from port P
i∈ (unit:TEU, twenty-foot equivalent units)
i
DW The operational deadweight tonnage on containershipwhen containership leaved from port i∈P (unit:ton)
k ij
DU The maximum full container demand for k∈Ktype from port i∈P to port P
j∈
k ij
ω The average weight of k∈Ktype from port i∈P to port j∈ (unit:ton)P ω
i
D The maximum of deadweight tonnage for all loaded containers at loading port P
i∈ (unit:ton)
k
λ Transferring coefficient of TEU by k∈Ktype. 20’DC is referred to as “Twenty-Foot-Container” which equals to one Twenty-Foot Equivalent Unit (1 TEU). 40’DC and 40’HQ are referred to as “Forty-Foot-Container (FEU)” which equals to two Twenty-Foot Equivalent Unit (2 TEU).
k ht
Q quantity of empty container stock of k∈Ktype in t period at port h∈H
k h
SS quantity of safety stock of k∈K type at port h∈H
k ht
IB quantity of inbound container of k∈Ktype in t period at port h∈H
k ht
OB quantity of outbound container of k∈Ktype in t period at port h∈H
k ht
RI quantity of repositioned-into empty container of k∈Ktype in t period at port h∈H
k ht
RO quantity of repositioned-out empty container of k∈Ktype in t period at port H
h∈
k ht
S supply number of k∈Ktype empty container at port h∈H
k ht
D demand number of k∈Ktype empty container at port h∈H
s
G set of ports having a surplus of empty containers within sea transportation network
s f
G set of ports having a surplus of empty containers within f ∈ group F
d
G set of ports having a shortage of empty containers with sea transportation network
d f
G set of ports having a shortage of empty containers within f ∈ group F
m
αβ
ρ =1, if transportation mode m∈M , repositioning empty containers from port
s
G ∈
α to port β∈Gd , was selected =0, otherwise
mk
Cαβ cost of repositioning an empty container of k∈Ktype from port α∈Gs to port β∈Gd by transportation mode m∈M
αβ
δ =1, if it had direct sailing from port α∈Gs to port β∈Gd within sea transportation network
=0, otherwise
k
Sα supply number of k∈Ktype empty containers at port
s
G ∈
α
k
Dβ demand number of k∈Ktype empty containers at port
d
G ∈
CHAPTER 1 INTRODUCTION
1.1 Research Background
Container shipping has been the fastest growing sector of the maritime industries in the last twenty years. Containerized cargo volumes have grown at an average annual rate of 9.1% since 1980 and by an even stronger 11.2% since 2000. In 2004, an estimated 928 million tons (excluding box weights) of containerized cargo was transported by sea in international and domestic trades. Container traffic is now estimated to account for more than 70% of international seaborne trade according to cargo value. Intra-Asian trade (excluding the Mid-East, Indian subcontinent and Australasia) accounts for one fifth of total global trade. With China acting as a regional resource centre, there seems little doubt that intra-Asian trade will continue to grow at a robust pace in the short to mid-term (Drewry Shipping, 2008).
In international trade, a global phenomenon is that cargo is delivered from export oriented areas to import oriented areas. The imbalance of international trade typically results in cargo imbalance and an empty container transference cost. The empty container incidence has exceeded 20% since 1998. The costs associated with repositioning these empty containers are considerable as they include an allowance for terminal handling, the costs of rest wage, administration, container storage, ship’s time, equipment per diem and repair. For instance, mainland China is the world factory and exports many made-in-China goods all over the world. A serious trade imbalance has arisen between mainland China and some other regions, particularly the United States and Europe. The phenomenon of import-export imbalances also occurs in the Middle-East. Container activity in the Middle-East has grown consistently and at an alarming rate since the end of 2002, and the high oil revenues earned by the region are reflected in increased imports for both public sector projects and private sector consumption. Without question, the Middle-East has been the most
imbalanced region.
In 2004, Drewry Shipping Consultants estimated the cost of empty container repositioning at US$14.9 billion. This figure did not include the costs of overland repositioning or inland(intra-zonal) imbalance costs, which are necessarily speculative, but were estimated at another US$7.7 billion. This brought the total empty container cost, direct and indirect, to an estimated US$22.6 billion. For trade route analysis, the main lines are usually shipping services between two continents or regions, such as Trans-Pacific Service, Trans-Atlantic Service, Asia-Europe Service, and Asia-Australia Service. Drewry Shipping Consultants (2006) forecast that in 2010 the eastbound trade would be 17.2 million TEUs and westbound trade 6.9 million TEUs, resulting in a cargo imbalance of 10.3 million TEUs. Given an estimated US$250 per TEU for empty container handling cost at port, this present study forecasts that the total cost of empty container repositioning will increase from US$1.98 billion in 2006 to US$2.58 billion in 2010.
Facing a market-driven and competitive environment, Asian container carriers must provide services with frequent sailing, shorter shipping times and direct delivery. As most service routes are designed to call at multiple ports and frequent loading and unloading cargo is performed at each port, containership slot allocation is becoming increasingly complex. While container carriers have done moderately well in restraining empty incidence to reduce cost, they need to devote more energy to better match cargo flows and for sophisticated revenue management systems. The logistics challenge for container carriers is to better manage and control their containers.
1.2 Research Motivations and Objectives
Containership slot allocation involves two stakeholders: the container carrier and the shipping agency. Container carriers gain freight revenue by delivering containers from one port to another and by cooperating with shipping agencies which provide cargo at each port. Typically, container carriers aim to fully load their containers in order to earn high freight revenue; consequently cargo flow and freight revenue management are often ignored. Shipping agencies gain a commission from ocean freighters by providing cargo and finding additional cargo to load. Arguments over slot allocation between shipping agencies frequently occur in booming markets. For instance, a shipping agency at the first port of call on a service route that involves several port calls, might load additional cargo onto a containership resulting in a shortage of slots for shipping agencies at subsequent ports. These shipping agencies lose commission and typically complain to headquarter, placing the blame on container carriers. In some cases, container carriers take strict action to unload all cargo that has been loaded at previous ports, and when this occurs they bear double the handling expenses at a port. The alternative is to take a loss when freight revenue at subsequent ports is higher than at the first port. Since spaces or slots are the most perishable inventory; when a containership leaves port, there is typically no unsold space/slot revenue right. Container carriers need to find a way of managing their revenue from shipping agencies to maximize profits via slot allocation.
Owing to imbalances in international trade, container carriers accumulate a large number of unnecessary empty containers in the import-dominant ports, and they acquire a short of empty containers in export-dominant ports. The core problem faced by container carriers is determining how to deliver empty containers to the ports that need them, without losing revenue. In practice, container carriers often make an arrangement to reposition a great quantity of empty containers in a single voyage. These empty containers occupy slots on containerships with the result that container carriers are unable to take aboard loaded containers which yield fright revenue. Song
et al. (2005) pointed out that the cost of transferring an empty container is 27% of the total world fleet running cost. Since liner shipping is a competitive service industry, container carriers are always seeking to decrease their shipping costs in order to increase their competitiveness. No significant gains will be made until an efficient method for empty container transference is found.
A review shows that some research has been conducted on the subject of slot allocation and empty container management, but few studies have sought to maximize profit through slot allocation, and minimize the cost of empty container transference in short-haul, multiple-port network conditions, such as those affecting the Asian liner shipping industry. The purpose of this study is to provide optimal and quantitative models that can function as a decision-support tools to enhance management performance for a short-sea container carrier.
1.3 Research Scope
By Drewry’s estimates, intra-Asian trade (excluding the Mid-East, Indian subcontinent and Australasia) amounted to 28.6 million TEUs in 2007, accounting for one fifth of total global trade. These figures obviously exclude any business moving within its confines on a feeder basis which are bound for markets such as Europe, the US and South America. This volume is forecasted to reach 50.7 million TEUs by 2013. There is no doubt that intra-Asian trade will continue to grow at a robust pace in the short to mid-term.
Within the intra-Asian operating arena, niche, regional and global container carriers co-exist among operating ships with diverse commercial strategies, including ships as small as 150 TEUs and those as large as 4,000 TEUs or more. A couple of clear trends have emerged in recent years. Regional container carriers have expanded
China/ASEAN axis. Both developments have arisen as a result of a number of global container carriers launching more of their own intra-Asian services, primarily for the purpose of meeting their feeder requirements. China remains the growth engine for the region, and the environment is changing as China is beginning to import more raw materials from its neighbors. With raw materials and semi-finished products moving from South East Asia to China, transit times are becoming more important for shippers. Intra-Asian trade involves a complex combination of regional local business and feeder traffic, and two often become mixed.
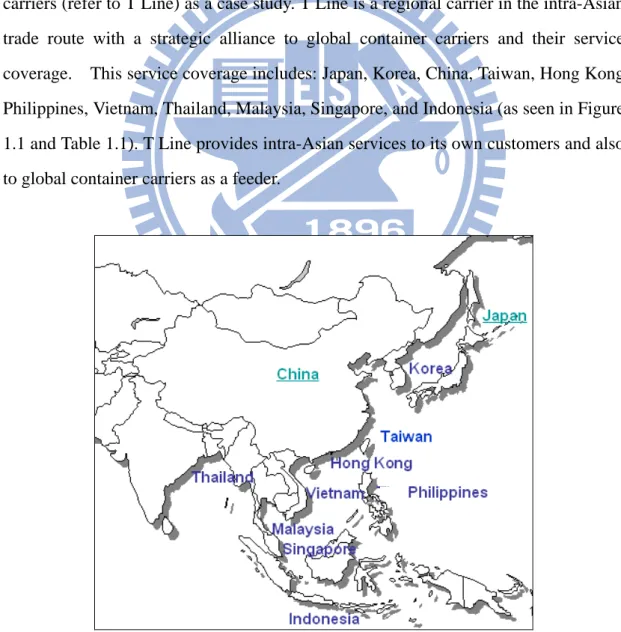
This study, which focuses on intra-Asian trade, has chosen one Taiwan container carriers (refer to T Line) as a case study. T Line is a regional carrier in the intra-Asian trade route with a strategic alliance to global container carriers and their service coverage. This service coverage includes: Japan, Korea, China, Taiwan, Hong Kong, Philippines, Vietnam, Thailand, Malaysia, Singapore, and Indonesia (as seen in Figure 1.1 and Table 1.1). T Line provides intra-Asian services to its own customers and also to global container carriers as a feeder.
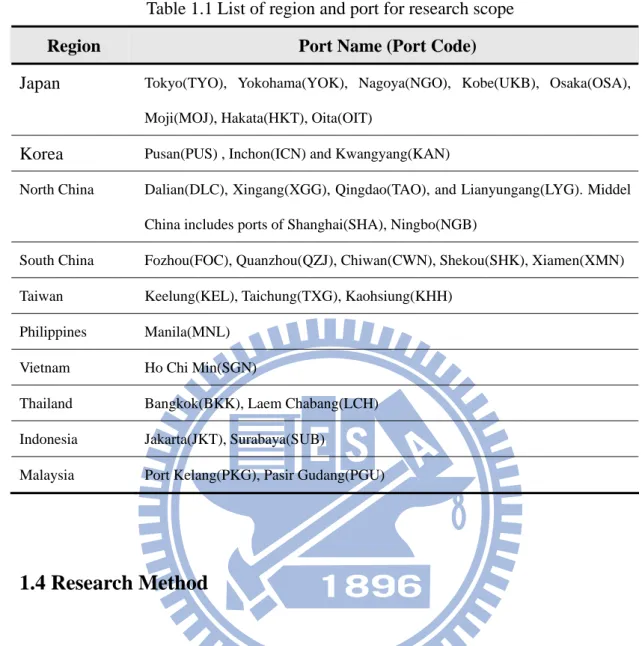
Table 1.1 List of region and port for research scope
Region Port Name (Port Code)
Japan Tokyo(TYO), Yokohama(YOK), Nagoya(NGO), Kobe(UKB), Osaka(OSA),
Moji(MOJ), Hakata(HKT), Oita(OIT)
Korea Pusan(PUS) , Inchon(ICN) and Kwangyang(KAN)
North China Dalian(DLC), Xingang(XGG), Qingdao(TAO), and Lianyungang(LYG). Middel China includes ports of Shanghai(SHA), Ningbo(NGB)
South China Fozhou(FOC), Quanzhou(QZJ), Chiwan(CWN), Shekou(SHK), Xiamen(XMN) Taiwan Keelung(KEL), Taichung(TXG), Kaohsiung(KHH)
Philippines Manila(MNL) Vietnam Ho Chi Min(SGN)
Thailand Bangkok(BKK), Laem Chabang(LCH) Indonesia Jakarta(JKT), Surabaya(SUB) Malaysia Port Kelang(PKG), Pasir Gudang(PGU)
1.4 Research Method
The research for this study included a literature review of the container shipping market, revenue management, containership slot allocation, empty container management, and related researches on container shipping. Information obtained from these areas was incorporated into the present study, which consists of two parts: the formulation of an optimal model of slot allocation, and the development of an optimal model of empty container reposition.
1.4.1 An optimal model of containership slot allocation
The present study was incorporates the concept of revenue management to formulate an optimal model of slot allocation via linear programming. In the past, because of the imbalance of cargo flow, container carriers have paid a substantial
amount for the repositioning of empty containers. To reduce these costs, the present study proposes to determine the probability of transference empty containers in order to estimate the expected costs. The objective is to maximize the operational profit (OP), which takes into consideration the expected cost of empty container repositioning, not including freight revenue, which is subject to constraints of containership capacity, containership deadweight, and container demand..
1.4.2 An optimal model of empty container reposition
This study addresses empty container repositioning by considering safety stock management and geographical regions. The proposed method has the potential to avoid the drawback associated with the current practice of collecting a large number of empty containers at one port and distributing these throughout one voyage. As a result, these empty containers come to occupy previously allocated slots. The present study proposes to partition the sea transportation network into several geographical regions and to empty containers within a single region. There are two challenges to this proposal: the first challenge or “upper-problem” lies in identifying and estimating empty container stock; the second challenge or “lower-problem” pertains to modes of transportation included in the model. The lower-problem will be solved via linear programming; different strategies will be proposed to resolve the upper-problem.
1.5 Research Framework
This study is organized as follows: Chapter 1 contains introductory material, including an overview of the research, motivation of the study, its objective, methodologies and approach. Chapter 2 contains a review of the container shipping market and related researches on revenue management, slot allocation, empty container management, routing, cost, and strategy alliance. Chapter 3 outlines the problems which pertain to: revenue management and slot allocation, service routes and cargo types, container movement at terminal, the cost of empty container
repositioning, obtaining sufficient operational profit, and safety stock management for empty containers. Chapter 4 formulates an optimal slot allocation model and uses a case study to demonstrate the application of the model. Chapter 5 formulates an optimal empty container distribution model and clarifies the application with the same case study. The final chapter (Chapter 6) summaries the findings and proposes recommendations for future research.
The framework and organization of this study are shown in Figure 1.2. The research processes and steps can be stated as follows:
1. Motivation
Illustrate the overview of this study in terms of background, purpose, objectives, and scope.
2. Literature Review
This study comprehensively reviewed the existing literature on the abovementioned topics pertaining to the shipping industry in order to understand important factors when positioning an intra-Asian containership in the global container shipping market and when applying revenue management to container shipping. Few previous studies of slot allocation have sought to maximize profit in short-sea, multiple-port service routes; also, little attention has been paid to the reposition of empty containers by container carriers within the sea transportation network.
3. Problem Description
To better understand the key problems facing the shipping industry, this study describes the present characteristics of slot allocation and empty container reposition.
based on the analysis found in steps 2 and 3.
5. Case Study
To demonstrate the application and the results of the proposed model, this study uses as a case study a container carrier with a long history of use in intra-Asian trade.
6. Strategy Analysis
Through further iteration and analysis, this study provides a potential strategy for container carriers to maximize operational profits and minimize expenditures.
7. Conclusions and Recommendations
CHAPTER 2 LITERATURE REVIEW
This chapter is devoted as a literature review that covers several topics. Section 2.1 reviews the container shipping market; Section 2.2 revenue management related issues; Section 2.3 containership slot allocation and related research; Section 2.4 empty container management; and Section 2.5 other research in container shipping. Section 2.6 concludes this study with a summary of the findings.
2.1 Container Shipping Market Review
2.1.1 Container traffic activity
Container shipping has been the fastest growing sector of the maritime industries in the last twenty years; containerized cargo volumes have grown at an average annual rate of 9.1% per annum (pa) since 1980, and by an even stronger 11.2% pa since 2000. Clarkson Research pointed out that global container trade was estimated at 502 million TEUs in 2008, a 7% increase over 2006.
The strong rate of container traffic growth has been sustained not only by the growth of output and consumption, but also by the powerful economics forces of globalization, whereby production has shifted away from high cost OECD nations to low wage countries. These countries are located predominantly in Asia (where China has become increasingly dominant, especially since the end of 2001 with its accession to WTO), but also in the Indian subcontinent and Latin America (as seen in Table 2.1). As manufacturing and assembly activity has been relocated away from the main consumption areas in North America, Europe and Japan, the shipping demand has naturally increased, while the net reduction in the cost of delivered goods has led to low inflation that has added a further stimulus to consumption (Drewry Shipping, 2005).
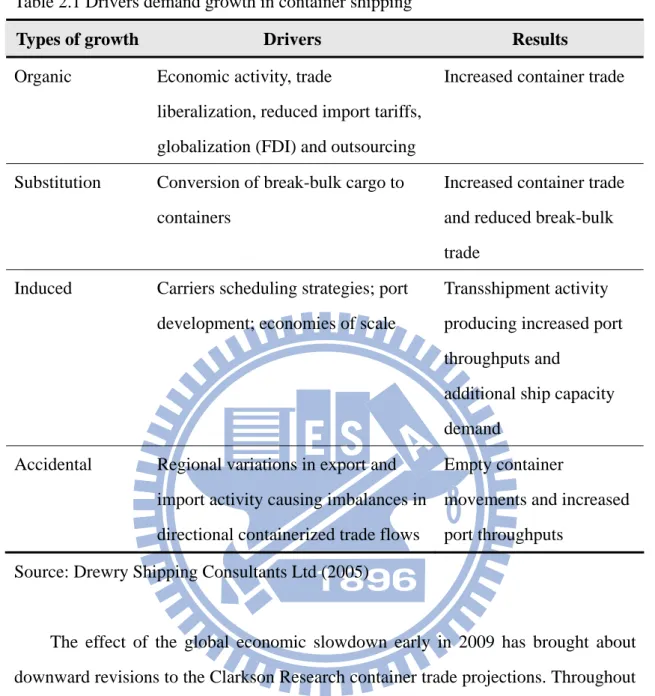
Table 2.1 Drivers demand growth in container shipping
Types of growth Drivers Results
Organic Economic activity, trade
liberalization, reduced import tariffs, globalization (FDI) and outsourcing
Increased container trade
Substitution Conversion of break-bulk cargo to containers
Increased container trade and reduced break-bulk trade
Induced Carriers scheduling strategies; port
development; economies of scale
Transshipment activity producing increased port throughputs and
additional ship capacity demand
Accidental Regional variations in export and import activity causing imbalances in directional containerized trade flows
Empty container
movements and increased port throughputs
Source: Drewry Shipping Consultants Ltd (2005)
The effect of the global economic slowdown early in 2009 has brought about downward revisions to the Clarkson Research container trade projections. Throughout the year 2008, the total global box trade was estimated to have experienced only 7.04% growth. Even more significant cuts have been made to the total global box trade growth projection for 2009, which now stands at 6.57%, a reflection of the degree of uncertainty felt over the state of the global economy in the coming year (as seen in Table2.2).
Over 50% share of container trade occurs in Asia. It is now estimated 55% for the year 2008 and a projected 56% in 2009 (as seen in Figure 2.1). With growth rates, China continues to be the main driving force behind world container trade
expansion (as seen in Figure 2.2).
Table 2.2 Forecast container volumes and growth by region (million TEUs)
Year 2006 2007 2008 2009 2010
Regions Volumes (%) Volumes (%) Volumes (%) Volumes (%) Volumes (%)
N America 45 10.69 47 10.02 46 9.16 46 8.60 47 8.17
N Europe 54 12.83 60 12.79 63 12.55 63 11.78 65 11.30
Mediterranean 27 6.41 30 6.40 30 5.98 30 5.61 31 5.39
China (incl. HK) 108 25.65 127 27.08 142 28.29 163 30.47 184 32.00
Asia excl. China 115 27.32 126 26.87 136 27.09 144 26.92 153 26.61
Other 72 17.10 79 16.84 85 16.93 89 16.64 95 16.52
TOTAL 421 100.00 469 100.00 502 100.00 535 100.00 575 100.00
Source: Clarkson Research services (Jan-2009)
-5% 0% 5% 10% 15% 20% 2,007 2008 2,009 2010 growth rate
N America N Europe Mediterranean China (incl. HK) Asia excl. China Other TOTAL
Figure 2.2 Trend of container growth by region 2007-2010
2.1.2 Container trade by route
Containerized trade is carried across three major sea lanes: the East-West axis, North-South axis, and intra-Regional trade routes. The East-West axis includes the transpacific linking Asia and North America, the transatlantic located between Europe and North America, and the Asia-Europe lane. East-West trade is estimated to have generated almost 44% of global container traffic volumes in 2004; 39 % was attributable to intra-regional trades and 17% to the north-south trade (as seen in Figure 2.3).
By Drewry’s estimates, intra-Asian trade (excluding the Middle-East, Indian subcontinent and Australasia) amounted to 28.6 million TEUs in 2007, accounting for one fifth of total global trade. This volume is forecasted to reach 50.7 million TEUs by 2013.
Figure 2.3 Share of container trade route by market
2.1.3 Empty container volume
Drewry Shipping Consultants estimated that by 2004 there were 37.2 million TEUs of seaborne empty container movements, which generated some 74.3 million TEUs of port handling. The costs associated with the repositioning of empty equipment were considerable, as they include an allowance for terminal handling, the costs of rest wage, administration, container storage, ship’s time, equipment per diem and repair. It was estimated that this cost was about US$14.9 billion. In addition, there were overland repositioning and inland (intra-zonal) imbalance costs which, while necessarily speculative, were estimated at another US$7.7 billion. This brought the total empty container cost (direct and indirect) to an estimated US$22.6 billion (Drewry Shipping, 2005).
The empty container incidence has exceeded 20% over since 1998, when the Asian currency crisis caused some structural fault lines to develop in directional trade balances, fault lines that show no signs of working themselves out of the system, judging on the performance of the two main Asian export trades to Europe and North American. Against the backdrop of rising trade imbalances on those two key routes, carriers have done well in somehow managing to restrain the global empty incidence
over the last couple of years. This possibly points to more balanced flows in intra-regional trades, especially intra-Asian areas. While carriers are devoting considerable energy and investment to better matching equipment flows and sophisticated yield management systems, there is an over-riding structural problem pertaining to the increasing deep-sea trade imbalances; this is setting the agenda for the foreseeable future (Drewry Shipping, 2005).
In view of these observations, carriers would do well to hold the empty incidence at the current levels of just under 21%. Each percentage point results in an increase or decrease in the global empty container incidence, which is estimated at US$650 million pa(2004). By the year 2010, the increased volume of world container activity will have pushed this figure up to around US$1 billion pa.
Figure 2.4 Container traffic by full and empty, 1980-2007
Source:United nations conference on trade and development, Review of Maritime Transport 2008
2.2 Revenue Management
Revenue management (also known as yield management) is used to determine optimal inventory allocation and scheduling strategies as well as to set prices for perishable assets in order to maximize revenue within the planning horizon. Revenue management is rooted in the airline industry where revenue management systems have been applied for over 40 years (Lai and Ng, 2005). Revenue management is a broad term that refers to the various ways a service provider can secure increased revenues from a relatively fixed capacity. Revenue management has been successfully applied to airlines, car rental firms, cruise lines, restaurants, hotels, etc. Berman (2005) indicated that yield management pricing can be successfully applied to service industries with demand characteristics, reservations, cost characteristics, and capacity limits (as shown in Table 2.3). In general, these industries include markets that can be segmented, services that are traditionally booked via a reservation system, and services characterized by a low marginal cost and a relatively fixed capacity.
There is a wealth of literature on revenue management for airlines, hotels, restaurants, etc. For liner shipping, quantitative tools for solving revenue management problems are relatively limited. Ting and Tzeng (2002, 2004) presented revenue management systems that would increase profits using slot allocation in long-haul services for liner shipping. However, their work did not address the issue of how to maximize profit in short-haul, multiple-port network conditions.
Since container carriers share very close characteristics with airlines, it would appear possible to directly transfer successful airline revenue management tools to liner shipping. This means that liner shipping has a high potential for the application of revenue management techniques.
For example:
(1) Both vessel-slots and air-seats are perishable and can not be stored for future
sale
(2) Capacity is usually fixed and cost of instant expansion is very high
(3) Advance booking is allowed and thus cancellations, no-shows and overbooking
problems exist.
Table 2.3 Ideal applications of yield management pricing Demand characteristics
♦ Significant variation in demand by time of day, season, day of week (weekend vs. weekday)
♦ Demand that is capable of being segmented.
♦ Significant differences in price elasticity by marker segment. Existence of reservations
♦ Demand is somewhat predictable.
♦ Service is reserved by consumers in different time periods (ranging from well in advance to just before the service expires).
♦ Uncertainty of actual usage despite reservations creates possibility of unsold seats. Service providers can protect against no-shows through overbooking. Cost characteristics
♦ Low costs of marginal sales in comparison to marginal revenues. ♦ High fixed costs.
Capacity limits
♦ Capacity is relatively fixed. The fixed number of output units needs to be allocated among customers.
♦ Service providers have excess capacity at certain times and excess demand at other times. When demand peaks, many services face binding capacity
constraints that prevent serving additional customers. Care rental agencies have a limited number of cars; hotels have a limited number of rooms, etc. Yield management is meat to redress that difference between the demand level of the moment and much longer-term fixed capacities.
♦ Capacity is perishable. It cannot be stored. Revenues from unsold tee times, restaurant seats, hotel rooms, and airline seats are lost forever.
2.3 Containership Slot Allocation
Container carriers use containerships as the main vehicles to carry containers from one port to another on their sea transportation network. In general, the containerships carry containers loaded with imported cargo (loaded container) and empty containers transferred from previous ports. After the containership arrives at a terminal, some of the loaded containers and empty containers are unloaded. Empty containers are dispatched to depots to meet the demand of shippers. Loaded containers are transported to their destination and then unloaded to a local consignee. Empty containers, which previously contained loaded cargo, are returned to depots and reused by container carriers to meet surplus demands, or else stored at deports for future use. If they are stored, then costs pertaining to container storage and rest wage begin to accrue. Also, container utility and the turn-over rate of containers decreases. As a result, container carriers hardly generate reasonable profits and even run deficits.
Quantitative tools to solve the problem of slot allocation for container shipping are relatively limited. Fagerholt and Christiansen (2000) developed a hypothetical bulk ship scheduling problem mimics existing problems pertaining to multi-ship pickup and delivery problem with a time window (m-PDPTW) and a multi-allocation problem. Their work suggested a set partitioning approach consisting of two phases. In the first phase, feasible schedules for each ship were generated. These schedules included the optimal allocation of cargoes to the ships’ nominal compartments. The second phases included the solution to a set partitioning problem in which the proposed schedules, generated in Phase One, were represented by columns. The solution of the set-partitioning problem was to allocate one schedule for each ship, with cargoes serviced by spot carriers, thus minimizing transportation costs. However, the solution focused on the problems faced by bulk ships which have a different operational procedure than that of containerships. Bulk ships follow the available cargo, much like a taxi service. Container carriers operate according to a published itinerary and they run a schedule similar to that of a bus line.
Ting and Tzeng (2001, 2004) formulated an optimal slot allocation model with revenue management systems. The objective of the proposed model was to maximize the total freight contribution, due to high variable costs, instead of focusing on freight revenue. The model also considered the possibility of the continuing worsening of trade imbalances, and it responded to this possibility by locating repositioning costs in the objective function. Ting and Tzeng (2002) used fuzzy multi-objective programming techniques to deal with two conflicting objectives: the carrier’s freight contribution and the agents’ degree of satisfaction; they did not seek to maximize profit in short-haul, multiple-port service routes for container carriers. This present research extends the concept of Ting and Tzeng (2001, 2002 & 2004) by utilizing revenue management to arrive at a slot allocation scheme for multi-port intra-Asian service routes.
2.4 Empty Container Management
In the literature on empty container management, Shintani et al. (2007) presented a design of container liner shipping service networks that focused on empty container repositioning. The objective was to maximize the company’s profit and minimized the cost of empty container traffic; however, it did not address techniques for empty container repositioning. Choong et al. (2002) addressed the effect of the planning horizon length on empty container management for inter-modal transportation networks. That analysis proposed an integrated program that sought to minimize total costs related to moving empty containers. The objective was the same as that of the present study, but it presumed a different operational procedure that focused on empty container management of inter-model container-on-barge. Li et al. (2004) stated the obvious; it is essential for any unnecessary empty containers to be repositioned from surplus locations to shortage locations. That paper addressed the question of how many empty containers at a given port are unnecessary; however, it did not consider
repositioning plan.
Table 2.4 Literatures on slot allocation for loaded containers
Authors Year Main issues and results
K Fagerholt M Christiansen
2000 ♦ Present a bulk ship scheduling problem that was a combined multi-ship pickup and delivery problem with time windows and multi-allocation problem.
♦ The model generated a number of feasible candidate schedules for each ship and these schedules included the optimal allocation of cargoes to the ships’ nominal compartments.
Shin-Chan Ting Gwo-Hshiung Tzeng
2001 ♦ Propose liner shipping revenue management to formulate an optimal slot allocation model.
♦ Suggest the objective was to maximize total freight contribution, but not freight revenue, because of high variable costs and repositioning costs.
Shin-Chan Ting Gwo-Hshiung Tzeng
2002 ♦ Formulate optimal slot allocation through fuzzy
multi-objective programming. The objective of the slot allocation model is to maximize the total freight
contribution and agents’ degree of satisfaction.. Shin-Chan Ting
Gwo-Hshiung Tzeng
2004 ♦ The results indicated the optimal slot allocation can be a guideline for distributing space to every calling port to achieve the most expected contribution.
♦ An Asia-Europe service route of a liner company in Taiwan was used as a case study.
♦ For implementation, this work still needed to integrate with related databases and pricing, as well as container inventory and dynamic slot control.
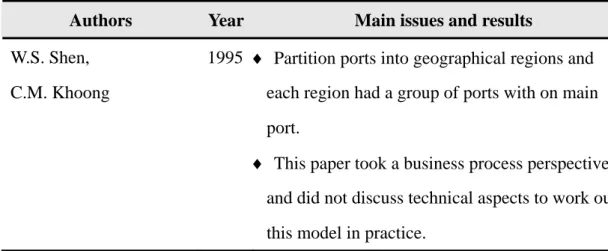
Chou (2006) tried to draw up a model for solving the empty container allocation problem with a mathematic programming method. The objective of that paper was to minimize the cost of empty containers on service routes by conducting a case study referring to the data of long-haul service. Li et al. (2007) proposed heuristic methods to solve the problem of empty container allocation between multi-ports. The work calculated simulation costs and average expected costs, but it did not consider empty container flow between multi-ports. Shen and Khoong (1995) presented a decision support system to solve a large-scale planning problem concerning the multi-period distribution of empty containers. They noted that ports were partitioned into geographical regions and each region had a group of ports with one main port. Through trade activities, any port might be a demand port (i.e., a port demanding more empty containers to ship out the outbound cargo), or a supply port (i.e., a port having a surplus of empty containers for global liner shipping companies). Shen and Khoong focused on the business aspects of shipping and prescribed the placement of empty containers in a distribution planning proposal. Only one type of container was considered in that proposal and technical aspects were not discussed. .
In this present study, the concept proposed from Shen and Khoong(1995) has been extend to include the various partitions in the sea transportation network as implied by different geographical regions.
Table 2.5 Literatures on empty container management
Authors Year Main issues and results
W.S. Shen, C.M. Khoong
1995 ♦ Partition ports into geographical regions and each region had a group of ports with on main port.
♦ This paper took a business process perspective, and did not discuss technical aspects to work out this model in practice.
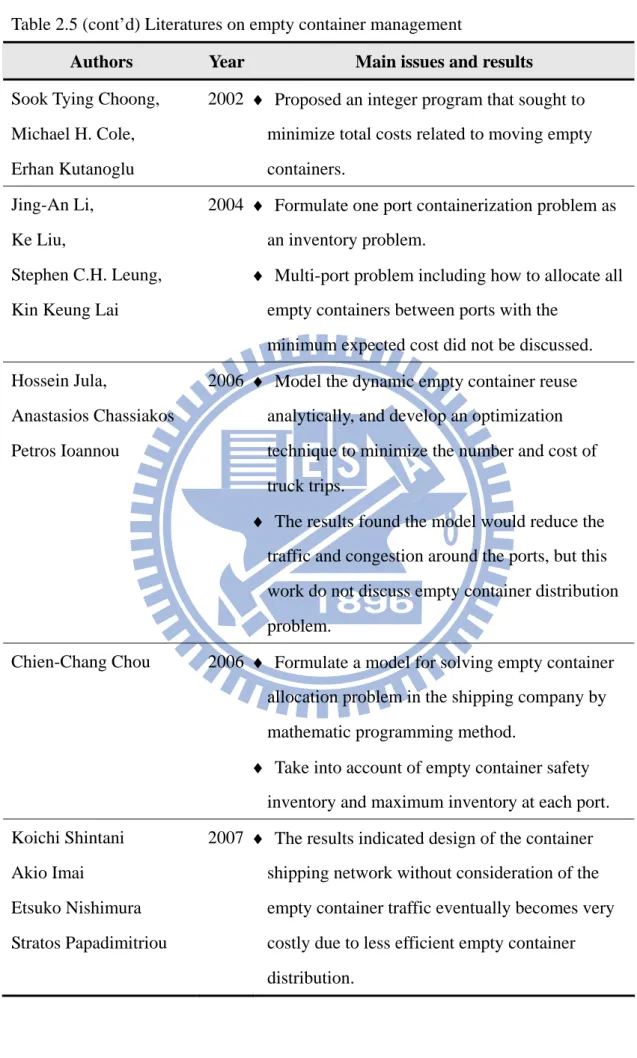
Table 2.5 (cont’d) Literatures on empty container management
Authors Year Main issues and results
Sook Tying Choong, Michael H. Cole, Erhan Kutanoglu
2002 ♦ Proposed an integer program that sought to minimize total costs related to moving empty containers.
Jing-An Li, Ke Liu,
Stephen C.H. Leung, Kin Keung Lai
2004 ♦ Formulate one port containerization problem as an inventory problem.
♦ Multi-port problem including how to allocate all empty containers between ports with the
minimum expected cost did not be discussed. Hossein Jula,
Anastasios Chassiakos Petros Ioannou
2006 ♦ Model the dynamic empty container reuse analytically, and develop an optimization technique to minimize the number and cost of truck trips.
♦ The results found the model would reduce the traffic and congestion around the ports, but this work do not discuss empty container distribution problem.
Chien-Chang Chou 2006 ♦ Formulate a model for solving empty container allocation problem in the shipping company by mathematic programming method.
♦ Take into account of empty container safety inventory and maximum inventory at each port. Koichi Shintani
Akio Imai
Etsuko Nishimura Stratos Papadimitriou
2007 ♦ The results indicated design of the container shipping network without consideration of the empty container traffic eventually becomes very costly due to less efficient empty container distribution.
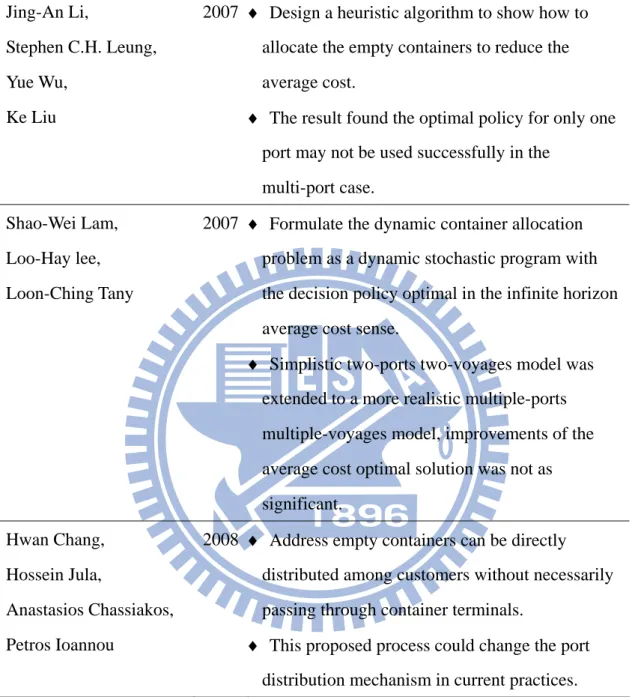
Table 2.5 (cont’d) Literatures on empty container management
Authors Year Main issues and results
Jing-An Li,
Stephen C.H. Leung, Yue Wu,
Ke Liu
2007 ♦ Design a heuristic algorithm to show how to allocate the empty containers to reduce the average cost.
♦ The result found the optimal policy for only one port may not be used successfully in the
multi-port case. Shao-Wei Lam,
Loo-Hay lee, Loon-Ching Tany
2007 ♦ Formulate the dynamic container allocation problem as a dynamic stochastic program with the decision policy optimal in the infinite horizon average cost sense.
♦ Simplistic two-ports two-voyages model was extended to a more realistic multiple-ports multiple-voyages model, improvements of the average cost optimal solution was not as significant.
Hwan Chang, Hossein Jula,
Anastasios Chassiakos, Petros Ioannou
2008 ♦ Address empty containers can be directly distributed among customers without necessarily passing through container terminals.
♦ This proposed process could change the port distribution mechanism in current practices.
2.5 Other Related Researches on Container Shipping
A wealth of literature is available on the subjects of routing, cost, and strategic alliance. The problem of routing was studied by Fagerholt(1999 and 2004); Lu and Hsu (2001); Lu(2002 and 2003); Chen and Chiu(2002); Lai and Lo(2004); and Hsu and Hsieh(2007). Bergantino and Veenstra (2002) investigated an application of network theory to line shipping. They pointed out that the rationale behind the strategies of the operators was to extend market coverage globally. Researches on maritime hub-and-spoke networks were studied by Hsieh and Chang(2001) and Hsu and Hsieh(2007).
Song et al. (2005); and Ting and Tzeng (2003) focused on aspects of cost in liner shipping. Song et al. (2005) indicated that the cost of repositioning empties was 27% of the total world fleet running cost. Cullinane and Khanna (1999 and 2000) studied economies of scale in large containerships, and indicated optimal containership size with respect to different operational scenarios.
Table 2.6 Literature on routing and network
Authors Year Topic
Kjetil Fagerholt 1999 Optimal fleet design in a ship routing problem Hua-An Lu
Yu-Chang Hsu
2001 Route selection and fleet deployment for a container liner
Shang-Hsing Hsieh Fei-Ru Chang
2001 Applications of the hub-and-spoke network model in routing liner ships
Hua-An Lu 2002 Route planning for container liner
Chuen-Yih Chen Ming-Chi Chiu
2002 A network design model for the containership routing problem
Angela S Bergantino Albert W Veenstra
2002 Interconnection and co-ordination: an application of network theory to liner shipping
Table 2.6(cont’d) Literature on routing and network
Authors Year Topic
Hau-An Lu 2003 Modeling ship’s routing and container positioning
for transoceanic liner M.F. Lai
Hong K. Lo
2004 Ferry service network design: optimal fleet size, routing, and scheduling
Kjetil Fagerholt 2004 Designing optimal routes in a liner shipping problem
Chaug-Ing Hsu Yu-Ping Hsieh
2007 Routing, ship size, and sailing frequency decision-making for a maritime hub-and-spoke container network
Table 2.7 Literature on cost and economies of scale
Authors Year Topic
Kevin Cullinane Mahim Khanna
1999 Economies of scale in large container ships
Kevin Cullinane Mahim Khanna
2000 Economies of scale in large containerships: optimal size and geographical implications Shin-Chan Ting
Gwo-Hshiung Tzeng
2003 Ship scheduling and cost analysis for route planning in liner shipping
Dongping Song Jie Zhang Jonathan Carter Tony Field James Marshall John Polak Kimberly Schumacher Proshun Sinha-Ray John Woods
2005 On cost-efficiency of the global container shipping network