行政院國家科學委員會專題研究計畫 成果報告
子計畫一:被動光環型網路之測試平台(I)
計畫類別: 整合型計畫
計畫編號: NSC93-2219-E-002-008-
執行期間: 93 年 08 月 01 日至 94 年 07 月 31 日
執行單位: 國立臺灣大學電信工程學研究所
計畫主持人: 何鏡波
報告類型: 完整報告
報告附件: 出席國際會議研究心得報告及發表論文
處理方式: 本計畫可公開查詢
中 華 民 國 94 年 11 月 3 日
行政院國家科學委員會國家型電信計畫成果報告
被動光環在都會網路之應用
子計畫一:被動光環型網路之測試平台(Ⅰ)
計畫編號: 93 - 2219 - E - 002 - 008 -
執行期限: 93 年 8 月 1 日至 94 年 7 月 31 日
主持人:何鏡波副教授 國立台灣大學電信工程學研究所
1 中文摘要
多波長被動光環網路所需之測試節點需要許多獨立訊號源,以建立高速可程式網路
互連測試平台,雖然商用高速設備可以購得但設備價格卻非常昂貴。本計畫專注於
建立網路測試節點的重點在於設計並完成高速可程式網路互連測試平台,在這國家
型電性計畫的各個階段過程中,此高速可程式網路互連測試平台可演進為一個乙太
網路節點,並可處理每秒 10 億位元秒(10-Gb/s)的網路流量。目前此測試平台正使用
硬體描述語言 (Verilog) 並在現場可程式邏輯陣列 (FPGA) 板上驗證,並配合高速多
工/解多功晶片將資料作高低速轉換,任意資料模型產生以及錯誤計算的功能可以在
現場可程式邏輯陣列上重新規劃執行資料處理。
除了測試平台外,具有高光纖色散及低成本特性的每秒 10 億位元秒(10-Gb/s)傳收機
也已經完成。此傳收機建立在可直接調變的分布式回授雷射(DFB),利用一個窄頻
光濾波器可使傳輸距離達 60 公里,相較於傳統架構的 20 公里,確實得到很好的效
果,應用在環狀半徑較小的被動式光環網路,低成本的直調傳收機可用來取代高價
的外部調變傳收機,使網路成本與架構更具彈性及競爭力。
Abstract:
The test-bed for multi-wavelength passive optical (POR) network requires many
independent signal sources as high-speed programmable networking testing platform.
Although commercial high-speed equipment is available, those equipments are typically
very expensive. The focus of this project is to build a networking test-bed is the design
and implement of the high-speed programmable networking testing platform. In the
continuation of this project, the testing platform will evolve to a networking node capable
to process 10-Gb/s Ethernet traffic. Currently, the testing platform is programmed in
Verilog and verified in a FPGA test broad. The FPGA is combined a Mux and DeMux
circuits. The FPGA for pattern generator and error counting can be re-programmed for
data processing
In additional to the testing platform, low-cost high-dispersion-tolerance 10-Gb/s
transceiver is also implemented. Based on directly-modulated of a simple
distributed-feedback laser with a narrow-band optical filtering, the signal can be transmitted for a
distance of 60-km with dispersion compensation as compared with a distance of only 20
km in conventional scheme. The low-cost transceiver can greatly lower the cost for POR
with small diameter without the requirement of costly externally modulated transceiver.
2 研究成果內容
2.1 研究目的
A test-bed for multi-wavelength passive optical ring (POR) networks is constructed
in this project for metro applications in dense cities. No active component is in the
ring path to lower the cost of each node and the future operating and maintenance
expenses. The POR networks are suitable for dense cities having communities (or
residential complex) composed of many high-rise residential buildings or business
centers with many office buildings, all of them in close proximity with other similar
communities or business districts.
The testbed requires independent signal sources, low-cost high-dispersion-tolerance
transceiver, and future advanced modulation scheme. Because of those requirement,
we build the following:
1. Based on FPGA and Mux/DeMux ICs, some signal sources initially generate
pseudo-random binary sequence (PRBS) to fill up the transmission links.
Currently, the circuits is able to generate various types of PRBS.
2. Based on narrow-band filtered directly-modulated laser, low-cost optical
transceivers are developed for a transmission distance of 60-km using low-cost
directly modulated DFB laser.
3. Advanced phase-modulated optical signal is studied for metro and long-haul
transmission systems. Differential phase-shift keying (DPSK) signal is studied
under the influence of fiber nonlinearities, especially nonlinear phase noise.
2.2 測試平台設計
In building the test-bed, we require many independent signal sources to generate
signal for testing propose. Fig. 1 shows a Gb/s pattern generator that provide
10-Gb/s pseudo-random binary sequence (PRBS) to populate all WDM channels with
independent signals. In Fig. 1, the FPGA generates a 16-bit parallel PRBS with a
per-determined timing offset between each other. When the parallel PRBS is combined
using a 16:1 multiplexer, the multiplexed sequence is a true 10-Gb/s PRBS. We
implement PRBS with sequence length of 2
7-1, 2
15-1, 2
23-1, and 2
31-1.
Also shown in Fig. 1, we also build the error detector to count the error of an input
data with respect to the PRBS. The FPGA of the error detector shares the same FPGA
of the pattern generator. With a 16:1 demultiplexer, the FPGA can implement a
parallel error detector with fixed data rate the same as that of 10-Gb/s Ethernet
WAN-PHY signals.
FPGA
Parallel
PRBS
1
6
:1
M
U
X
10 Gb/s
PRBS
FPGA
Error
Detector
1:
16 D
e
M
U
X
10 Gb/s
Data
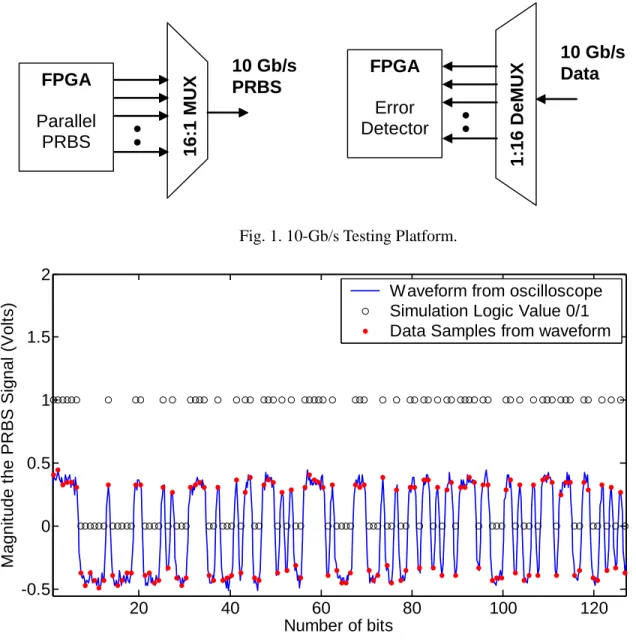
Fig. 1. 10-Gb/s Testing Platform.
20 40 60 80 100 120 -0.5 0 0.5 1 1.5 2 Number of bits M agnit ude t he PR BS Signal (Volt s
) W aveform from oscilloscope
Simulation Logic Value 0/1 Data Samples from waveform
Currently, the logical functions of the PRBS are programmed in Verilog and verified
in a FPGA test broad. The test broad is combined with a Mux and DeMux circuits.
The FPGA for pattern generator and error counting can be re-programmed for data
processing. In the future, the FPGA in each WDM node can emulate packet drop,
pass, and add for the removal, by-passing, and insertion of Ethernet packet. We will
implement a primitive node for Resilient Packet Ring according to IEEE 802.17
standard.
The FPGA based PRBS generator is built successfully. Fig. 2 shows the measured
2
7–1 random pattern from an actual FPGA (blue solid line), data sampled from the
wavelength (solid circle ․) and the simulation using Verilog (circle o). The data rate
Optical
Filter
Fiber
RX
SpectraOptical
Filter
Fiber
RX
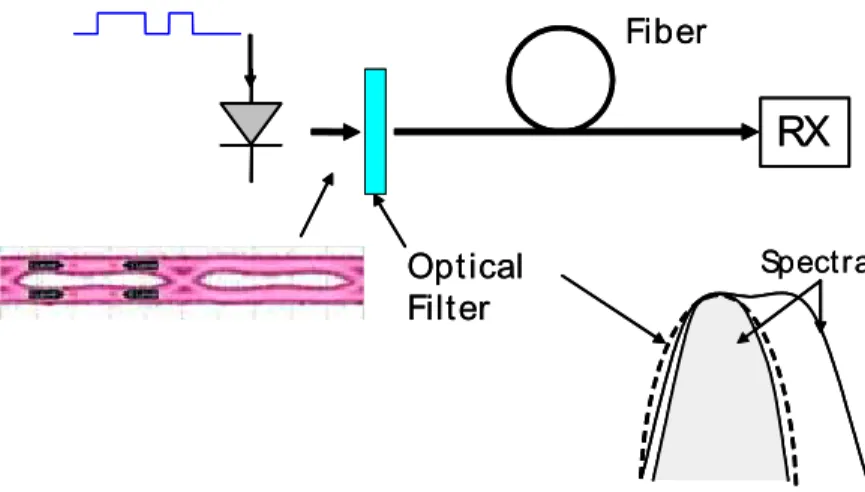
SpectraFig. 3 Schematic for the experimental setup to generate an OOK signal based on FSK to OOK conversion. Also shown schematically the spectra before and after the optical filter. The eye-diagram shows the residual intensity modulation of the optical signal with an extinction ratio of 2 dB.
for Fig. 2 is actually 2 Gb/s, larger than the required speed of 622 Mb/s for Fig. 1.
Although the pattern length can be larger than 2
7–1, a short pattern is used as the
oscilloscope can only capture a short pattern length.
2.3 低成本光收發機
A semiconductor diode laser by itself is a very simple and low-cost device. Light is
generated when current is injected into the laser. In normal operation, the output
power of the laser is monotonically increase with the injected current. On-off keying
(OOK) signal can be generated by directly-modulated the diode laser with two
different current levels. However, the emitted laser wavelength also depends on the
injected current, resulting with dynamic frequency chirp that broadens the signal
spectrum. When different portions of the signal are propagated with different speed
due to fiber chromatic dispersion, the transmission distance is limited, especially
when low-loss 1.55-µm signals are used in the widely deployed standard
single-mode fiber with a dispersion coefficient of D = 17 ps/km/nm. Of course, the
transmission distance can be increased when an external modulator is used to block
or unblock the light. However, an expensive device, external modulator increases the
cost of the system.
Conventionally, the usage of 1.55-µm directly modulated semiconductor laser limits
the transmission distance to about 20 km, mostly due to the frequency chirp of the
laser. Based on the same physical mechanism of frequency chirp, a diode laser can
be directly frequency modulated to generate frequency-shift keying (FSK) signal.
The FSK signal can be directly detected using an optical filter.
40 ps
0 km
60 km
40 ps
40 ps
0 km
60 km
40 ps
Fig. 4 Eye-diagram after 0 and 60 km of optical fiber. The eye-diagram for 0 km is for the converted OOK signal. After 60-km of optical fiber, the eye-diagram looks very similar.
When FSK signal is passing through an optical filter, the filter output signal is an
OOK signal that can be directly detected using a conventional binary receiver. If
FSK signal is transmitted thought an optical fiber, the optical filter is located at the
receiver. Fiber chromatic dispersion and optical filtering are both linear
time-invariant system for the optical signal. The performance of the system remains the
same by exchanging the location of the fiber and the filter. Therefore, an OOK signal
can be regenerated using an optical filter and then transmitted through the optical
fiber.
Fig. 3 shows a semiconductor laser that generates a FSK signal through direct
modulation. A passive optical filter converts the FSK signal to OOK signal that is
transmitted through the optical fiber. In the design of the filter of Fig. 3, the notch of
the filter of Fig. 3 should locate at the frequency corresponding to the lower intensity
and the converted OOK signal has zero chirp at the “off” state.
The operation principle is further illustrated in Fig. 3 with the spectra before and
after the passive optical filter. The operation principle is the same as most
direct-detection FSK systems but the optical filter that converts FSK to OOK signal is
located at the transmitter instead of the receiver. Ideally for MSK, the optical filter
should have a peak-to-notch bandwidth of 5-GHz, half the data rate, to give an OOK
signal with infinite extinction ratio. In practice, the extinction ratio of the converted
OOK signal is finite.
In Fig. 3, the laser is directly modulated with 10-Gb/s 2
7-1 pseudo-random binary
sequence (PRBS) with the same operation parameters as Fig. 1(a). The optical filter
has a 3-dB bandwidth of about 8.5 GHz, based on the monochromator in Agilent
86146B optical spectrum analyzer. Focused on the study of the dispersion tolerance,
an optical amplifier is used between the semiconductor laser and the optical filter to
compensate for the high optical filter loss (~ 7 dB). Following the optical filter is
standard single-mode fiber with dispersion coefficient of about 17 ps/nm/km.
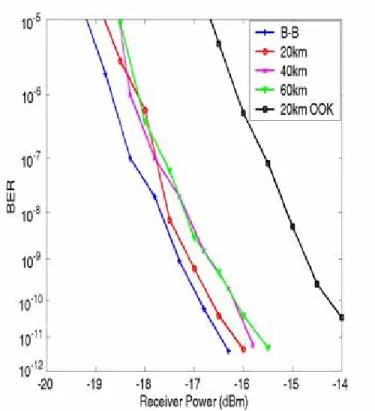
Fig. 5 BER as a function of received power for various length of optical fiber for 10-Gb/s signal.
In additional to direct frequency modulation, the FSK signal also has residual
amplitude modulation and the corresponding eye-diagram is also shown in Fig. 3.
The extinction ratio of the amplitude-modulated signal is about 2 dB. The extinction
ratio of only 2-dB gives 6.5 dB of penalty for a standard OOK receiver.
optical filter that has no difference with a regular OOK signal. The low-chirp OOK
signal has an extinction ratio of about 8.5 dB. Fig. 4 also shows the eye-diagram
after 60-km of optical fiber. The eye-diagram shows that there is little chromatic
dispersion induced distortion to the signal. Even after 60-km of standard
single-mode fiber, the eye-diagram does not show a big difference with that at 0-km of
optical fiber.
Fig. 5 shows the measured bit-error-rate (BER) as a function of received power for
the setup of Fig. 3 with 0, 20, 40, and 60 km of optical fiber. There is little chromatic
dispersion induced penalty. Even for a distance up to 60 km, the maximum distance
limited by our resource, the sensitivity penalty is less than 1 dB. Also shown in Fig.
3 is the BER after 20-km of optical fiber using the pure directly-modulated signal
with a penalty of about 2 to 2.7 dB compared with the low-chirp signal. Even for just
20-km, the signal is up to 2 dB worse than the low-chirp signal with 60-km of
optical fiber. Fig. 5 shows clearly the high dispersion tolerance of the OOK signal
converted from a directly-modulated FSK signal.
We experimentally demonstrate a 10-Gb/s OOK transmitter based on directly
modulated 1.55-µm semiconductor laser to generate FSK signal. A passive optical
filter is used to convert the FSK signal to low-chirp OOK signal. The low-chirp
OOK signal can be transmitted for a distance of 60-km of standard single-mode fiber
with less than 1-dB of penalty induced by chromatic dispersion.
2.4 先進的調變型式
Recently, multilevel modulation signals like differential quadrature phase-shift
keying (DQPSK) have received renewed attention to improve the spectral efficiency
of a lightwave communication system. Not only for (D)QPSK signals, but also for
the general class of quadrature-amplitude modulation (QAM) with and without
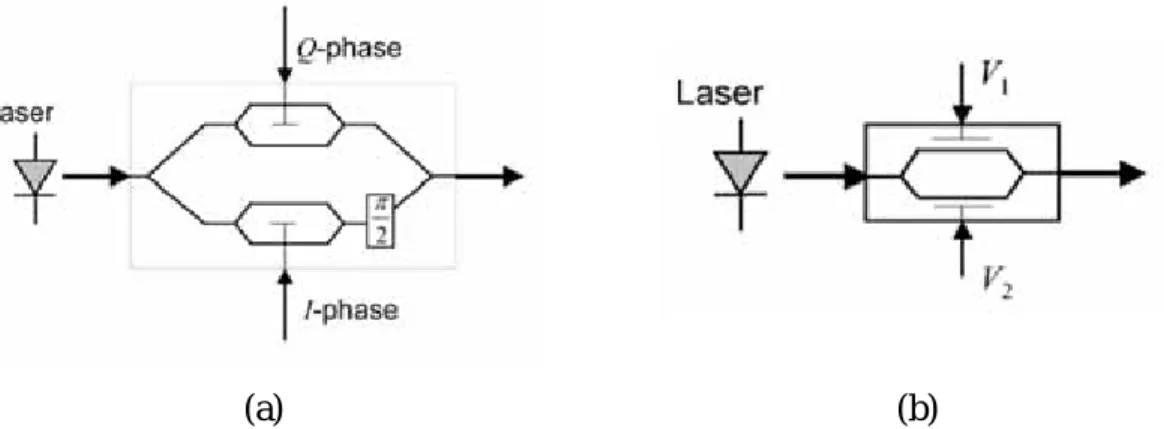
differential operation, the transmitter of Fig. 6(a) is the usual method to generate a
QAM signal using two Mach–Zehnder modulators (MZMs) within two π/2 phase
difference paths of a Mach-Zehnder interferometer.
With two MZMs and an interferometer, the special modulator of Fig. 6(a) is difficult
to fabricate. If the transmitter of Fig. 6(a) is implemented using discrete components
of two MZMs within an interferometer, the transmitter is costly with many
components. The transmitter in Fig. 6(a) also requires two bias controls for the
MZMs and a phase control of the phase shifter. As shown subsequently, the QAM
signal can also be generated using a single dual-drive MZM. When the technique is
applied to (D)QPSK signals, three different transmitters are invented with a drive
signal having four, three, and two levels, respectively. The usage of only one
dual-driveMZM greatly simplifies the design of the (D)QPSK transmitter.
Fig. 6(b) is the basic structure of a dual-drive MZM. The dualdrive MZM consists of
two phase modulators that can be operated independently. The MZM can be
fabricated using various materials, and LiNbO
3is the most popular material. Almost
all commercial long-haul dense-wavelength-division-multiplexed (DWDM) systems
use LiNbO MZM. In the dual-drive structure of Fig. 6(b), the modulator chirp is
adjustable
(a) (b)
Fig. 6. Arbitrary quadrature signal transmitter based on (a) two single-drive MZMs in ainterferometer and (b) one dual-drive MZM with two independent phase modulator in a Mach-Zehnder interferometer.
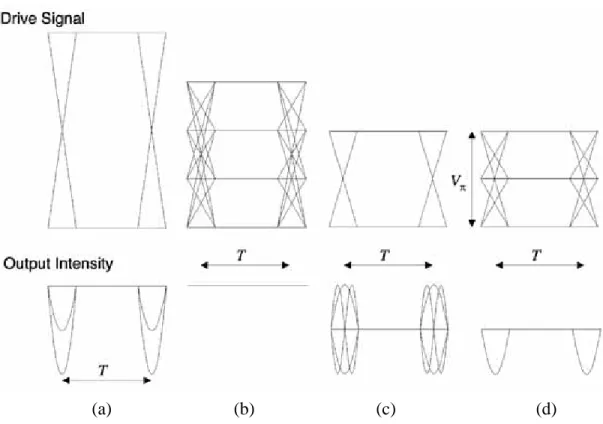
Fig. 7 show the eye diagram of the drive signal and the optical intensity between the
RZ modulator and the (D)QPSK transmitter. Fig. 7(a) is the eye diagram when the
conventional transmitter of Fig. 6(a) is used with two two-level drive signals having
a peak-to-peak drive voltage of 2V
π. Using the dual-drive transmitter of Fig. 6(b),
the peak-to-peak drive voltage is reduced from 1.5V
πfor a four-level signal to V
πfor
two- and three-level drive signals.
The output intensity of the conventional transmitter has optical intensity ripples
between consecutive symbols.With two or three levels of drive signal, the output
intensity of the dual-drive MZM also has ripples between consecutive symbols. The
simplest two-level scheme of 7(c) has overshoot ripples doubling the output intensity.
The ripple of the three-level signal of Fig. 7(d) with a dual-drive transmitter is
similar to that of Fig. 7(a) with a conventional transmitter. If the RZ modulator is
operated in the middle of the eye diagram of Fig. 7, the ripples are cancelled, and the
transmitter provides a constant pulse train. For an NRZ signal without an RZ
modulator, overshoot ripples are equivalent to short optical pulses that are
particularly detrimental and potentially give high signal distortion due to fiber
nonlinearities. Without the RZ modulator, the two-level drive signals cannot be used
for NRZ signals due to the overshoot ripples.
When the RZ modulator is used to convert the signal into a pulse train, the electrical
drive signal of Fig. 7 must have a short rise–fall time such that the signal transition is
outside the RZ pulses. Because of the overshoot ripples, the two-level transmitter of
7(c) requires the shortest rise–fall time from the electrical drive signal. If the rise–
fall time is 20% the symbol interval, there is insignificant signal distortion due to the
overshoot of Fig. 7(c). Even for a rise–fall time approaching 40% of the bit interval,
the ripples in the RZ pulses are below half of the peak intensity.
(a)
(b)
(c)
(d)
Fig. 7. Eye diagram of the drive signal and output intensity between two modulators of the RZ-DPSK transmitter when (a) the conventional transmitter of Fig. 1 and the dual-drive transmitter of Fig. 2 with (b) four-, (c) two-, and (d) three-level dual-drive signals are used.
The ripples of the drive signal transfer to the optical signal. With the conventional
transmitter of Fig. 6(a), no amplitude ripple of the drive signal transfers to the phase
ripple. Even when the drive signal has a large ripple, the intensity ripple of the
transmitted signal is compressed by the nonlinear transfer function of the MZM. For
the (D)QPSK signal Fig. 7, the ripples from the drive signal may be increased by the
transmitter.
Regardless of the number of constellation points, all quadrature-amplitude
modulation (QAM) signals can be generated using a single dual-drive Mach–
Zehnder modulator. When the general method is applied to
quadrature-phase-shift-keying (QPSK) signals, three different QPSK transmitters are shown with drive
signals having four, three, or two levels. The usage of only one dual-drive modulator
greatly simplifies the design of QAM and QPSK transmitters.
3 發表論文及著作列表
1. 陳建銓,“高速網路可程式化數位邏輯傳收模組之研製,”國立臺灣大學電信工程
學研究所, 碩士論文, 2005.
2.
H.-K. Chen, H.-C. Wang, C.-C. Wu, and K.-P. Ho, “Generation of 10-Gb/s Low-chirp On-Off Keying Signals by Passively-filtered and Directly-modulated of a 1.55-µm Semiconductor Laser,” in OptoElectronics and Communication Conference, OECC '05, Seoul, Korea, July 4-8, 2005, paper 7P-014.3.
H.-C. Wang and K.-P. Ho, “XPM-induced Crosstalk for RZ-DPSK Signals in Highly Dispersive Transmission Systems,” in OptoElectronics and Communication Conference,OECC '05, Seoul, Korea, July 4-8, 2005, paper 7B2-3.
4.
S.-C. Huang, H.-K. Chen, H.-C. Wang, and K.-P. Ho, “Multi-rate Transceiver based on Unequally Probable On-off Keying,” in OptoElectronics and Communication Conference,OECC '05, Seoul, Korea, July 4-8, 2005, paper 7P-022.
5.
P.-Y. Chen, H.-C. Wang, and K.-P. Ho, “Exact Capacity of Intensity-modulation Direct-detection Channel,” in OptoElectronics and Communication Conference, OECC '05, Seoul, Korea, July 4-8, 2005, paper 7P-024.6.
K.-P. Ho, “The Effects of Nonlinear Phase Noise to DPSK Signals,” in OptoElectronics andCommunication Conference, OECC ’05, Seoul, Korea, July 4-8, 2005, paper 7B3-2, pp.
400-401.
7.
H.-K. Chen, C.-C. Wu, H.-C. Wang, and K.-P. Ho, “Generation of Low-Chirp Signal by Passively-Filtering and Directly- Modulation of an 1550-nm Semiconductor Laser,” inSymposium on Technology Fusion of Optoelectronic and Communications, STFOC ’05,
Taipei, Taiwan, May 17-22, 2005, paper 20F14, pp. 106-107.
8.
H.-C. Wang and K.-P. Ho (Best Paper Award, Invited), “Comparison of Nonlinear Phase Noise and Intrachannel Four-Wave-Mixing in RZ-DPSK Systems,” in Symposium onTechnology Fusion of Optoelectronic and Communications, STFOC ’05, Taipei, Taiwan,
May 17-22, 2005, paper 21S02, pp. 122-123.
9.
S.-C. Huang, H.-C. Wang, H.-K. Chen, and K.-P. Ho (Outstanding Student Paper Award), “On-Off Keying with Different Mark-Ratio for Multi-Rate Transmission,” in Symposium onTechnology Fusion of Optoelectronic and Communications, STFOC ’05, Taipei, Taiwan,
May 17-22, 2005, paper 20F12, pp. 102-103.
10.
C.-H. Wu, H.-C. Wang, H.-K. Chen, C.-C. Chen, and K.-P. Ho, “Filter Distortion to 40-Gb/s NRZ Signals: Simulation and Measurement,” in Symposium on Technology Fusion ofOptoelectronic and Communications, STFOC ’05, Taipei, Taiwan, May 17-22, 2005, paper
21S05, pp. 128-129.
11.
K.-P. Ho and H.-C. Wang, “Comparison of Nonlinear Phase Noise and Intrachannel Four-Wave-Mixing for RZ-DPSK Signals in Dispersive Transmission Systems,” IEEE PhotonicsTechnology Letters, vol. 17, no. 7, pp. 1426-1428, July 2005.
12.
K.-P. Ho, “Error Probability of DPSK Signals with Intrachannel Four-Wave-Mixing in Highly Dispersive Transmission Systems,” IEEE Photonics Technology Letters, vol. 17, no. 4, pp. 789-791, April 2005.13.
K.-P. Ho and H.-W. Cuei, “Generation of Arbitrary Quadrature Signals Using One Dual-Drive Modulator,” Journal of Lightwave Technology, vol. 23, no. 2, pp. 764-770, February 2005.14.
K.-P. Ho, “Exact Evaluation of the Channel Capacity for Intensity-Modulated Direct-Detection Channels with Optical Amplifier Noises,” IEEE Photonics Technology Letters, vol. 17, no. 4, pp. 858-860, April 2005.15.
K.-P. Ho, “Mid-Span Compensation of Nonlinear Phase Noise,” Optics Communications, vol. 245, no. 1-6, pp. 391-398, January 17, 2005.16.
C.-M. Yuan, C.-C. Chen, and K.-P. Ho, “Passive Optical Network Protection Using Cyclic Arrayed Waveguide Grating and Temperature Wavelength Tuning,” in The thirdInternational Conference on Optical Communications and Networks, ICOCN ’04, Hong
Kong, November 30-December 1, 2004, pp. 241-244.
17.
J. M. Kahn and K.-P. Ho (Invited), “Modulation and Detection Techniques for DWDM Systems”, presented at Tyrrhenian International Workshop on Digital Communications:Optical Communication Theory and Techniques, Pisa, Italy, October 17-18, 2004, paper
P1.1. In Optical Communication Theory and Techniques, E. Forestieri, Ed., Berlin: Springer, 2004, pp. 13-20.
4 計畫成果自評
本年度計畫執行符合本國家型電信計劃所預定完成之光環網路所需之硬體測試
平台中每秒百億位(10-Gb/s)乙太廣域網路實體層測試訊號產生及接收器 [1],利用
FPGA 及多工/解多工晶片及相關零組件設計一可程式化(Programable)及可重置
(Reconfigurable)硬體平台,具有可彈性設計的優點並可適用於多數每秒百億位(10-Gb/s)高速網路應用。
本研究可培養學生對系統整合以及高速電路設計訓練,此硬體平台尚可提供光
通訊實驗測試誤碼率所需要的傳送與接收硬體設備,可訓練研究生不僅會用還能動
手做出成品,藉此與理論驗證學以致用,具有高頻電路與系統整合實做經驗的研究
生在未來職場上將炙手可熱,並提供業界所需的人才。
關於低成本的直調傳輸機架構,原本直調分布式回授雷射(DFB)的傳輸距離只能
在 20 公里的範圍內,只能用在接取網路(Access Network) ,利用價格低廉的窄頻光
濾波器控制信號頻譜,即可將傳輸距離提升至 60 公里而可運用在小範圍的都會網
路 [2],[3],對於建置成本與網路彈性功能接錙銖必較的產業界,將可提升價格及技
術的競爭力。
本計劃除務實解決業界需求,在相關理論研究也不落人後,對於高速差分相位
調變(DPSK)訊號收光纖非線性效應的研究,我們首先研究單一通道內訊號間的四波
混合現象(Intra-channel Four-Wave Mixing, IFWM) ,並比較其與非線性相位雜訊對
DPSK 訊號的影響,此研究榮膺 STFOC`05 最佳論文獎(詳見附錄) [4],研究速率可
調系統則獲 STFOC`05 傑出學生論文獎(詳見附錄) [5],此外還有兩篇研究在
STFOC`05 發表 [3],[6]。
我們秉持著審慎的態度繼續研究 DPSK 信號在傳輸系統中受非線性效應影響的
分析,用嚴謹的方法分析 RZ-DPSK 信號在分波多工系統中因為通道上信號非週期
性特性所造成的相位交互影響調變效應(XPM),此一研究(詳見附錄)在 2005 年 7 月
發 表 在 亞 洲 重 要 的 光 通 訊 研 討 會 -OptoElectronics and Communication Conference
(OECC) –舉辦地點在韓國首爾,由博士班研究生上台發表論文 [7],此外尚有 3 位
碩士班學生所研究的題目發表篇壁報論文 [2],[8],[9]。
本計劃主持人何鏡波副教授也受 OECC`05 大會邀請演講,發表 DPSK 訊號在光
傳輸系統非線性效應的統計特性的研究成果 [10],此外在計劃經費補助下,尚參與
香港及德國舉辦的國際會議 [11], [12],對台灣在光通訊的能見度將有所幫助。在國
際 期 刊 方 面 , 關 於 單 一 通 道 四 波 混 合 對 DPSK 訊 號 的 研 究 被 IEEE Photonics
Technology Letters 所接受 [13],[14],此外我們提出新的方式只需一個雙埠驅動的外
部調變器(Dual-drive MZM)即可產生 DQPSK 信號,可降低訊號產生的成本,此論
文發表於 IEEE/OSA Journal of Lightwave Technology [15] ,對光通訊通道容量研究
以及非線性效應的補償也有很好的成果 [16],[17] ,總計本計劃經費支援下產生一篇
碩士論文 11 篇國際會議論文以及 5 篇國際期刊論文。
附 錄 一
XPM-Induced Crosstalk for RZ-DPSK Signals in
Highly Dispersive Transmission Systems
Hsi-Cheng Wang1 and Keang-Po Ho1,2
(1Institute of Communication Engineering and 2Department of Electrical Engineering, National Taiwan University, Taipei 106, Taiwan, Tel: +886-2-3366-3605, Fax: +886-2-2368-3824, E-mail: [email protected])
Abstract
In highly dispersive RZ-DPSK WDM systems, the overlap of optical pulses gives non-periodic optical intensity variation that gives phase noise through cross-phase modulation (XPM). The variance of the phase noise is evaluated analytically.
1 Introduction
Return-to-zero differential phase-shift keying (RZ-DPSK) signal has widely studied recently for long-haul transmission [1]. With low peak power, DPSK signal can tolerate larger fiber nonlinearities than on-off keying. If the RZ-DPSK signal maintains as a periodic pulse train in its intensity profile, cross-phase modulation (XPM) induces the same phase shift to all optical pulses in a wavelength-division-multiplexed (WDM) system [2]. However, with pulse broadening in dispersive transmission, overlapped pulses induce non-periodic intensity profile. This paper provides a method to calculate XPM-induced phase noise from pulse overlap.
2 XPM from Overlap RZ-DPSK Pulses
The XPM-induced periodic phase shift from periodic intensity does not degrade DPSK signals. RZ-DPSK signal is typically launched as non-overlap periodic pulse train at the transmitter. However, after a short distance, the pulse is broadened by fiber dispersion that gives pulse overlap. The RZ-DPSK signal has non-periodic intensity profile. The non-periodic intensity gives XPM-induced phase variation that degrades the performance of DPSK signals.
If the DPSK signal has a pulse shape of g(z,t) in electric field as a function of distance z and time t, the two adjacent pulses give intensity profile of |g(z,t)±
g ( z , t - T )|2. If the adjacent pulses of g(z,t) and g(z,t-T)
are overlap with each other, there is an equivalent
non-periodic modulation of ±2ℜ{g(z,t)g*(z,t-T)},
where ℜ{⋅} is the real part of a complex number. Of course, the equivalent modulation is important only if the pulses of g(z,t) and g(z,t-T) overlap with each other. Combined with XPM, this equivalent modulation gives non-periodic phase to adjacent WDM channels.
When previous papers [3-4] studied the impact of XPM to DPSK signal, only signal and noise beating is included and pulse-overlap is not investigated. The model here follows the method of [3] in which periodic intensity does not degrade DPSK signals.
Following most analysis of XPM in [2-3], we assume that a Gaussian pulse of g(0,t) = A0exp[-(t/τ0)2/2] in electric field is launched into the fiber to transmit RZ-DPSK signal, where A0 > 0 is the peak amplitude and τ0 is the initial 1/e-pulse width. The optical power of the RZ-DPSK signal is P0 = πA02 τ0/T.
After a fiber distance of z, the optical Gaussian pulse in term of electric field becomes
2 0 2 2 2 0 2 0 1 ( , ) exp 2 1 / A g z t t j z jβ z τ τ β ⎡ = ⎢− × − ⎢ ⎥ − ⎣ ⎦ ⎤ ⎥ z , (1) where β2 is the group-velocity dispersion coefficient of fiber. The 1/e-pulse width of g(z,t) is (τ02+ A02z2/τ02)1/2. Assuming RZ-DPSK signal of A(z,t) = ∑k bk g(z, t - k T )
at distance of z, where bk = ±1 is the phase modulated to
the optical pulses. The overall amount of XPM-induced phase shift is equal to
2 0 ( ) 2 L| ( , ) | ( ) zd z t A z t d zω h t e α φ = γ − ⊗ −
∫
, (2)where ⊗ denotes convolution and hz(t) is the impulse
response of Hz(ω) = cos(β2zω2/2) due to fiber dispersion [5], dω is the walk-off parameter, and α is the fiber
附 錄 一
signal, the phase of (2) can be expressed as
φ( ) 2t γ k m b bk k m mq
(
(3) +∞ +∞ + =−∞ =−∞ =∑
∑
t−kT)
z where * 0 ( ) L ( , ) ( , ) ( ) zd m q t =∫
⎣⎡g z t d z g z t d z mT− ω − ω − ⎦⎤⊗h t e−α z (4)The power spectral density of φ(t) is evaluated analytically similar to digital modulated signal. The differential phase that degrades a DPSK signal is equal to ∆φ = φ(t) - φ(t-T) has a variance of 1/ 2 2 1/ 4 T (2 )sin ( )d T φ f f T f φ σ∆ =
∫
Φ π π , (5) where Φφ(2πf) is the power spectral density of φ(t) andthe integration is between the data bandwidth of ±1/T , also the first lobe of sin2(πfT).
3 Numerical Results
Fig. 1 shows the normalized phase shift standard deviation (STD) of σ∆φ/〈ΦNL〉 as a function of channel separation of ∆λ for both medium and high dispersion coefficient of 3.5 and 17 ps/km/nm, where 〈ΦNL〉 is the mean nonlinear phase shift. The initial pulse width of the Gaussian pulses is equal either τ0 = 2.5 and 5 ps.
The STD of σ∆φ decreases with the increase of channel separation. The STD of σ∆φ for short pulse is significantly smaller than long pulse when channel separation is larger than 1.6 nm. The fiber link of Fig. 1 has a loss coefficient of α = 0.2 dB/km for a distance of L = 100 km. The mean nonlinear phase shift is 〈ΦNL〉 = γ P0Leff, where Leff = [1- exp(-αL)]/α is the effective nonlinear length, γ is the fiber nonlinear coefficient, and
P0 is the launched power.
1 2 3 4 5 6 10−1 10−4 10−3 10−2 Channel Separation, ∆λ (nm)
Phase Shift STD (rad)
D = 3.5 ps/km/nm D = 17 ps/km/nm
T0 = 2.5 ps T0 = 5 ps
Fig. 1 The normalized phase shift STD of σ∆φ/〈ΦNL〉 versus channel separation of ∆λ with D = 3.5 and 17 ps/km/nm.
Fig. 2 shows the normalized phase shift STD of σ∆φ/〈ΦNL〉 as a function of fiber dispersion coefficient of
D. The channel separation is ∆λ = 0.8 nm for τ0 = 5 ps
and ∆λ = 1.6 nm for τ0 = 2.5 ps, corresponding to a frequency separation of 100 and 200 GHz at the wavelength around 1.55 µm. 0 2 4 6 8 10 12 14 16 18 20 0 0.002 0.004 0.006 0.008 0.01 0.012 0.014
Fiber Dispersion Coefficient (ps/km/nm)
Normalized Phase Shift STD,
σ∆φ /< ΦNL > τ0 = 5 ps τ0 = 2.5 ps
Fig. 2 The normalized phase shift STD of σ∆φ/〈ΦNL〉 as a function of fiber dispersion coefficient of D.
Fig. 2 shows that pulse overlap induced phase noise depends strongly on the initial pulse width of τ0. For long initial pulse width, the initial pulse overlap dominates the pulse overlap and the STD of σ∆φ decrease with increase of fiber dispersion. For short initial pulse, there is no initial pulse overlap. For short optical pulse without initial pulse overlap, the phase noise STD initially increases with fiber dispersion and gives a peak at dispersion coefficient 2 to 6 ps/km/nm and then decreases with the further increases of fiber dispersion.
4 Conclusion
The XPM-induced phase noise due to overlapped pulses is studied analytically the first time. The phase noise STD decreases with channel separation and increases with initial pulse width. The phase noise STD is also commonly decreases with the increase of fiber chromatic dispersion.
References
1 A. H. Gnauck and P. J. Winzer, J. Lightwave Technol. 23 (115) 2005.
2 J. Leibrich et al, IEEE Photon. Technol. Lett. 14 (215) 2002. 3 K.-P Ho, IEEE J. Sel. Top. Quantum Electron. 10 (421) 2004. 4 H. Kim, IEEE J. Lightwave. Tech. 21 (1770) 2003.
附 錄 二
Comparison of Nonlinear Phase Noise and
Intrachannel Four-Wave-Mixing in RZ-DPSK Systems
Hsi-Cheng Wang
1and Keang-Po Ho
1,2(
1Institute of Communication Engineering and
2Department of Electrical Engineering,
National Taiwan University, Taipei 106, Taiwan, Tel: +886-2-3366-3605, Fax: +886-2-2368-3824,
E-mail:
[email protected]
)
Abstract — Self-phase modulation (SPM)-induced nonlinear phase noise is reduced with the increase of fiber dispersion
but intrachannel four-wave-mixing (IFWM) induced ghost pulses are increased with dispersion. The standard deviation of nonlinear phase noise is about three times that from IFWM.
1. INTRODUCTION
Self-phase modulation (SPM) induces nonlinear phase noise [1], adds directly to the signal phase, is the major degradation for RZ-DPSK signals. When RZ pulse broadens by chromatic dispersion and overlaps with each other, the pulse-to-pulse interaction gives intrachannel cross-phase modulation (IXPM) and four-wave-mixing (IFWM). While IXPM has no effect on DPSK signals, IFWM adds ghost pulses to each DPSK RZ pulse [2-4].
2. NONLINEAR PHASE NOISE VARIANCE
For a comparison to IFWM, nonlinear phase noise is evaluated based on the model of [2-4]. Assumed a Gaussian pulse with an initial 1/e pulse width of T0, the kth pulse along the fiber is
(
)
(
)
(
)
2 0 1/ 2 2 2 2 0 2 0 ( , ) exp 2 k k t kT A T u z t T j z T jβ z β ⎡ − ⎢ = ⎢− ⎥ − − ⎢⎣ ⎥⎦ ⎤ ⎥ (1)where Am =±A0 is the pulse amplitude modulated by either
0 or π phases, β2 is the coefficient of group velocity dispersion, and T is the bit interval. The constant factor of fiber loss is ignored in (1) but includes afterward. The overall ghost pulse is equal to
*
0 ( , ) ( , ) ( , ) ( ) d
L z
k l m z
jγ
∫
⎡⎣u z t u z t u z t ⎤ ⊗⎦ h− t e−α z, (2)where ⊗ denotes convolution, and L is the fiber length, and α is the fiber attenuation coefficient. The impulse response of provides dispersion compensation for
, the fiber chromatic dispersion. ( ) z h t− ( ) z h t
To be consistent with the model for IFWM of (2), for the pulse of u0(z,t), the SPM-induced nonlinear force including amplifier noise of n(z, t) is equal to
[
]
20( , ) ( , ) 0( , ) ( , ) .
j u z tγ +n z t u z t +n z t (3) For the signal, nonlinear force is jγu0|u0|2 or that of (2) with k = l = m = 0. The nonlinear force associated with nonlinear phase noise has two different terms of 2jγ|u0(z,t)|2n(z,t) and 2jγu
02(z,t)n*(z,t) when all quadratic or higher-order terms of the noise are ignored.
With white input noise n(0,t) has a variance of E{n(0,
t+τ)n*(0, t)}=2σ
n2δ(τ), the fiber dispersion is included as
n(z, t)= n(0, t) ⊗ h t and E{n(z, t+τ)nz( ) *(z, t)}=2σn2δ(τ),
where σn2 is the noise density per dimension. For
2jγ|u0(z,t)|2n(z,t), the nonlinear noise corresponding to (2) is equal to 2 0 0 ( ) 2 L ( , ) ( , ) ( ) zd . n z u t j
γ
u z t n z t h t e−α z − ⎡ ⎤ ∆ =∫
⎣ ⎦⊗ (4)The temporal profile of ∆un(t) can be represented by
the variance of ∆un(t), σ∆2u tn( )=E
{
∆u tn( )2}
, as a functionof time. Similar to 2jγ|u0(z,t)|2n(z,t), the 2jγu
02(z,t)n*(z,t) has a temporal profile of ∆un’(t) contributed to the
nonlinear phase noise.
Fig.1 shows the standard deviation (STD) of ∆un(t) and
∆un’(t) for typical fiber dispersion coefficients of D = 17
and 3.5 ps/km/nm. The initial launched pulse has an 1/e width of T0 = 5 ps. The fiber link is L = 100 km with attenuation coefficient of α = 0.2 dB/km. Fig.1 shows that the nonlinear force of ∆un(t) due to the beating of |u0(z,t)|2
with n(z,t) is far larger than that of ∆un’(t) due to the
附 錄 二
2
beating of u02(z,t) with n*(z,t). In term of power, the
variance of ∆un’(t) is about 1% of the variance of ∆un(t).
If the nonlinear force of ∆un(t) is passing through an
optical filter with an impulse response of ho(t), the filter
output at the time of mT is
(
)
0,m h mT t0 u t tn( ) .d
ζ +∞
−∞
=
∫
− ∆ (5)The SPM phase noise from ζ0,0 is the noise generated by the beating of |u0(z,t)|2 with n(z,t) and affect the DPSK pulse at t = 0. The term of ζ1,1 is IXPM phase noise from the beating of |u0(z,t)|2 with n(z,t) and affect the DPSK pulse at t = T. Due to IXPM, the DPSK pulse at t = 0 also affects by the beating of |u1(z,t)|2 (the pulse at t = T) with
n(z,t) to give the IXPM phase noise of ζ1,0.
Followed the model of [4], the differential nonlinear phase noise from both SPM and IXPM phase noise is,
Fig. 1. The temporal distribution of nonlinear force due to the beating of signal with noise. The solid lines and dash line are for ∆un(t) and
∆un’(t),respectively.
{
,0}
{
,1}
0 1 1 1 n m m A A δφ = ℑ∑
ζ − ℑ∑
mζm (6)where ℑ i
{ }
denotes the imaginary part of a complex number. For simplicity, A0 = A1 is assumed for the same transmitted phase in consecutive symbols. Using the property that the real and imaginary parts of ζk,m are independent and identically distributed, the variance ofn
δφ
is{
} {
(
1 2 1 2 1 2 2 * ,0 ,0 ,0 ,1 2 0 1 n m m m m m m E E A δφ σ =∑∑
ζ ζ − ζ ζ*}
)
. (7) For an N-span system, the amplifier noise at the first span is the smallest and that in the last span is the largest. From [1],[5], for large number of fiber spans with the identical span repeated one after another, the overall phase noise variance is 2 3 2 3n N
φ δφ
σ∆ ≈ σ n . The signal-to-noise
ratio (SNR) is defined as ρs= π1/2 T0 |A0|2/ (2 N σn2). The
mean nonlinear phase shift is <ΦNL> = N γ Leff P0 where P0 is the launched power and Leff = (1-e-αL)/α is the effective fiber length. The variance of nonlinear phase noise of 2
n
φ
σ∆ is proportional to <ΦNL>/ρs, similar to that in [1],[5].
Fig. 2 shows the phase noise STD of 2 n
φ
σ∆ as a function of the fiber dispersion coefficient of the fiber link with Gaussian optical filter has a transfer function of
(
)
2 2 2 2
0 0
( ) 1 exp 2
o o
H ω = +t T −t ω . The system has a mean nonlinear phase shift of <ΦNL> = 1 rad and SNR of ρs = 20 (13dB), corresponding to an error probability of 10-9 for DPSK signal with only amplifier noise.
The same as Fig. 1 with T0 = 5 ps, Fig. 2 further assumes 40-Gb/s systems with T = 25 ps and an optical matched filter of to = 5 ps because larger bandwidth
increases the nonlinear phase noise. Fig. 2. also shows the corresponding phase STD due to IFWM calculated by the method of [4].
Fig. 2. The phase noise STD due to nonlinear phase noise and IFWM. The dashed-line is SPM phase noise from ζ0,0 and ζ1,1 alone.
For Gaussian optical filter, the variance of 2 n
φ
σ∆ can be derived analytically. Other types of optical filter may need another layer of integration.
4.CONCLUSION
For an initial pulse width of T0 = 5 ps, the phase noise STD from nonlinear phase noise is about three times larger than that from IFWM at large fiber dispersion of D = 17 ps/km/nm. Nonlinear phase noise typically degrades a DPSK signal more than IFWM ghost pulses.
附 錄 二
3
REFERENCES
[1] J.P. Gordon and L.F. Mollenauer, “Phase noise in photonic communications systems using linear amplifiers” Optics Letter, vol. 15 no. 23, pp. 1351-1353, 1990.
[2] A.Mecozzi, C.B. Clausen, and M. Shtaif, “System impact of intra-channel nonlinear-channel nonlinear effects in highly dispersed optical pulse transmission,”
IEEE Photon. Technol. Lett., vol. 12, no. 12, pp.
1633-1635 2000.
[3] X. Wei and X. Liu, “Analysis of intrachannel four-wave mixing in differential phase-shift keying transmission with large dispersion,” vol.28 no.23 pp. 2300-2302 Optics Letter, 2003.
[4] K.P. Ho, “Error probability of DPSK signals with intrachannel four-wave-mixing in highly dispersive transmission systems,” IEEE Photon. Technol. Lett, to be published 2005.
[5] K.P. Ho and J.M. Kahn, J. “Electronic compensation technique to mitigate nonlinear phase noise,” Lightwave Technol., vol. 22, no. 3, pp. 779-783, 2004.
附 錄 三
On-Off Keying with Different Mark-Ratio for Multi-Rate Transmission
Shi-Chang Huang
1, Hsi-Cheng Wang
1, Hao-Kai Chen
1,and Keang-Po Ho
1,2(
1Institute of Communication Engineering and
2Department of Electrical Engineering, National Taiwan
University, Taipei 106, Taiwan, Tel: +886-2-3366-3605, Fax: +886-2-2368-3824, E-mail:
[email protected]
)
Abstract — A dynamic reconfigurable multi-rate transceiver is designed based on unequally probable on-off keying, or
equivalently with different mark-ratio. Experimental measurement shows that the receiver sensitivity is improved by 4-6 dB by the halving the mark ratio.
1. INTRODUCTION
In a dynamic reconfigurable optical network, a transceiver may need to adapt to different data rates due to different requirement from customer or limitation in the link budget. If a transceiver is originally operated in 10-Gb/s, after reconfiguration, the new fiber link may have excessive fiber loss and the transceiver must lower its speed to 2.5 Gb/s requiring less receiver power or less effective signal-to-noise ratio.
Focused on the design of electronic circuit to detect the data rate and recover the data, conventionally, a multi-rate transceiver is mostly opemulti-rated in low-speed from 52 Mb/s to 1.3 Gb/s [1-2]. The receiver sensitivity improvement from high to low data rates is not the major concerns in those works. Here, a new multi-rate transceiver is demonstrated based on unequally probable on-off keying, similar to change mark ratio of the data stream.
The multi-rate transceiver is operated with a maximum data rate of 10 Gb/s. In the multi-rate transceiver, the receiver sensitivity is inversely proportional to the data rate. If the data rate is reduced to 5 Gb/s, for example, half of the bits in predefined locations are always at the off state, saving 50% of the power. Ideally, for thermal-noise dominant receiver, the receiver sensitivity improves by 6 dB, providing further system margin or link loss budget. The analog front-end of both transmitter and receiver remains the same but the digital post-processing is changed for multi-rate operation.
2. PRINCIPLE OF UNEQUALLY PROBABLE ON-OFF KEYING In a simplified analysis, the BER of an on-off keying receiver is given by the Q factor of
Q = (I1-I0)/(σ1+ σ0), (1)
Fig. 1 shows the experimental setup for the measurement of the BER of the multi-rate signaling at different transmission rates. A pulse pattern generator where I1 and σ1 are the average photocurrent and noise variance for the on state, and I0 and σ0 are that for the off-state. With unequal probability of p1 and p0, the average photocurrent is Is = I1×p1 + I0×p0 and p1 + p0 = 1. With infinite extinction ratio of I0 = 0, we obtain I1 = Is/ p1 and the Q factor is equal to Is/ p1/( σ1+ σ0).
First of all, unequally probable on-off keying changes the effective data rate of the signal. For a nominally 10-Gb/s transceiver, if the signal has a mark ratio of ¼ instead of ½, the effective data rate is just 5 Gb/s. In the parallel to serial multiplexing of digital data, some lanes can remained zero all the time. In the serial to parallel demultiplexing, the signal processing afterward can always skip certain lanes with all-zero data stream. The analog front-end of clock-and-data recovery (CDR), and serializer and deserializer (SerDes) remain the same. The CDR can operate for the full-rate 10-Gb/s data stream, or other effective data rates with different mark-ratio.
For system dominated by thermal noise or spontaneous-spontaneous beat noise, the noise variance of σ1 and σ0 are both independent of the photocurrents of both
I0 and I1. The change of p1 from ½ to ¼ doubles the Q
factor and provides 6-dB sensitivity improvement. For system dominated by signal-spontaneous noise, the on-state noise of σ12 is proportional to I1. Ignore the effect of σ0, the Q factor is proportional to (Is /p1)1/2. The change of
p1 from ½ to ¼ provides 3-dB sensitivity improvement.
Depending on system configuration, the improvement of changing p1 from ½ to ¼ provides 3- to 6-dB sensitivity improvement.
5.EXPERIMENTAL VERIFICATION
附 錄 三
2
(PPG) is used to generate a 10 Gb/s 231-1 PRBS signal. The PRBS is amplified by a driver amplifier to drive a Mach-Zenhder modulator (MZM) used with a laser source having the wavelength of 1553.28 nm. An optical attenuator is used to simulate fiber loss. The receiver is assumed as a preamplifier receiver with optical gain provided by a low-noise EDFA. Followed the EDFA is a second optical attenuator to maintain the same optical power to the receiver at different data rate, mainly for comparison purpose. Ideally, the second attenuator is not required but is used here to provide further flexibility. The receiver is followed by the error detector (ED).
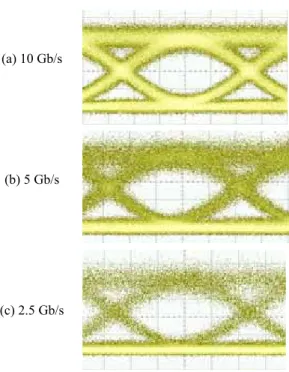
At first, PPG generates a PRBS with mark ratio of ½ for an effective data rate of 10 Gb/s. Fig. 2a shows the corresponding eye-diagram. Fig. 3 measured the bit-error-rate (BER) as a function of optical receiver power of the optical amplifier. Afterward, the PPG generates a PRBS with a mark ratio of ¼ for an effective data rate of 5 Gb/s. Fig. 2b also shows the corresponding eye-diagram. The BER as a function of received power is also measured and shown in Fig. 2. Finally, the PPG generates the data with a mark ratio of 1/8 for an effective data rate of 2.5 Gb/s and an eye-diagram of Fig. 2c.
The required received power for a BER of 10-9 is -26.9 dBm for 10-Gb/s signal. The required received power for the effectively 5-Gb/s signal is -32.7 dBm and that for 2.5 Gb/s signal is -36.7 dBm. Comparing the BER as a function of received power in Fig. 3, 10-Gb/s operation of the multi-rate transceiver requires about 5.8 dB larger received power than 5-Gb/s and 5-Gb/s operation requires 4.0-dB larger received power than 2.5 Gb/s operation. Fig. 3 clearly shows the advantage of the multi-rate transceiver to provide adaptive data-rate with different receiver sensitivity.
In practice, the multi-rate transceiver can be operated with better granularity then that in Figs. 2 and 3. If the operation depending on the number of parallel data in the SerDes, the multi-rate transceiver can be operated for an increment of 1/16 the data rate in the standard SFI-4 interface [3]. Of course, the implementation of the multi-rate transceiver does not need to conform to a standard interface and better granularity can be provided.
6.CONCLUSION
Unequally probable on-off keying is used for a dynamic reconfigurable multi-rate transceiver. Experiment shows that 10-Gb/s operation of the multi-rate transceiver requires about 5.8 dB larger received power than 5-Gb/s and 5-Gb/s operation requires 4.0 dB larger received power than 2.5 Gb/s operation.
REFERENCES
[1] T. C. Banwell and N. K. Cheung, “Bit-rate detection circuit for rapidly reconfigurable rate-transparent optical network.,” IEEE Photonic Technol. Lett. vol. 11, no. 11, pp.1500-1502, 1999.
[2] S. Kobayashi and M. Hashimoto, “A multibitrate burst-mode CDR circuit with bit-rate discrimination function from 52 to 1244 Mb/s” IEEE Photonic
Technol. Lett. vol. 13, no. 11, pp. 1211-1213, 2001. [3]
附 錄 三
PPG Amp MZM EDFA RX ED
PPG Amp MZM EDFA RX ED
Fig. 1 The schematic diagram of experimental setup.
(a) 10 Gb/s (b) 5 Gb/s (c) 2.5 Gb/s -40 -35 -30 -25 10-11 10-10 10-9 10-8 10-7 10-6 10-5 10-4
Received Power (dBm)
BER
10G 5G 2.5GFig. 2 Measured eye-diagram. Fig. 3 Measured BER as a function of received power.