行政院國家科學委員會專題研究計畫 成果報告
子計畫三:奈米微粒控制技術研究(I)
計畫類別: 整合型計畫 計畫編號: NSC91-2621-Z-002-024- 執行期間: 91 年 08 月 01 日至 92 年 07 月 31 日 執行單位: 國立臺灣大學公共衛生學院職業醫學與工業衛生研究所 計畫主持人: 陳志傑 共同主持人: 黃盛修 計畫參與人員: 林琮禧 報告類型: 完整報告 處理方式: 本計畫可公開查詢中 華 民 國 92 年 10 月 28 日
行政院國家科學委員會補助專題研究計畫成果報告
奈米微粒與健康風險研究—子計畫三:
奈米微粒控制技術研究(I)
計畫類別:整合型計畫
計畫編號:NSC91-2621-Z002-024
執行期間:91年08月01日至92年07月31日
計畫主持人:陳志傑 (
Chih-Chieh Chen)
計畫參與人員:黃盛修 (
Sheng-Hsiu Huang)
成果報告類型(依經費核定清單規定繳交):完整報告
執行單位:國立台灣大學職業醫學與工業衛生研究所
中華民國92年10月02日
I 中文摘要 本研究在於探討單階與雙階的靜電集塵器對於奈米微粒的捕集效率。在研究 中瞭解不同粒徑微粒、流量、電場強度如何影響靜電集塵器之收集效率。探討微 粒在靜電集塵器中充電情形則利用粒徑介於 10nm and 60 nm 的單一粒徑微粒。 從實驗與理論的比較結果發現,微粒粒徑在數十奈米範圍確實存在著充電不 足現象。以實驗中所使用的單階與雙階靜電集塵器為例,其對於粒徑分別約在 20 nm50nm 以下的微粒之收集效率有顯著降低。另外,就節約能源觀點而言,使 用單階靜電集塵器來處理粒徑小於 16nm 的微粒是較具經濟效益的,否則以雙階 靜電集塵器較具效益。 關鍵詞:靜電集塵器、奈米微粒、穿透率 .
II
英文摘要
This work measures the penetration of ultra-fine particles through a single- and a two-stage ESPs as a function of particle size. Also studied herein are how
parameters including particle size, rate of airflow through the ESP, and voltage of the discharging electrode affect aerosol penetration through the ESP. Monodisperse particles with sizes between 10nm and 60 nm were generated as the challenge aerosols to investigate the particle charges given by an ESP.
A comparison of experimental and theoretical results confirms that a partial charging regime exists when the particle diameter is several tens of nanometers. Experimental results indicated that aerosol penetration through the single- and
two-stage ESPs increased significantly for particles below 20 and 50 nm, respectively. However, the exact regime depends on the parameters including air flow rate, applied voltage, and the configuration of the ESP. Phenomena such as ionic flow, particle space charge, and flow turbulence may significantly affect the collection efficiency of an ESP for ultra-fine particles. To achieve the same collection efficiency, it is more economical to use single-stage ESPs to collect particles less than 16 nm, from the standpoint of energy consumption. However, it is more economical to use two-stage ESPs to collect particles larger than 16 nm.
Keywords: ESP, ultrafine particles, nanometer, penetration
III 目錄 中文摘要………..I 英文摘要………..II 目錄………..III 圖目錄………..IV 表目錄………..V 報告內容 前言………1 研究材料與方法………2 結果討論………3 參考文獻………5
IV
圖目錄
Figure 1. Schematic diagram of the experimental set-up……….…08
Figure 2. Configurations of the single- and the two-stage ESPs (top view). ….…….09 Figure 3. Current-voltage (I-V) curves for single- and two-stage ESPs………….….10 Figure 4. Ultra-fine aerosol penetration through the single-stage ESP as a function of
aerosol size under different applied voltages………...10 Figure 5. Ultra-fine aerosol penetration through the single-stage ESP as a function of
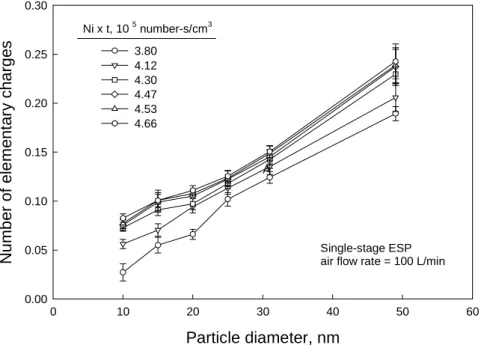
aerosol size at different testing flow rate……….11 Figure 6. Performance characteristic curve of the ion trap………..11 Figure 7. Particle charges acquired in the single-stage ESP………12 Figure 8. Comparison of experimental and theoretical results of the averaged particle
charge………...12 Figure 9. Average elementary charge carried by 10-nm and 48-nm particles under
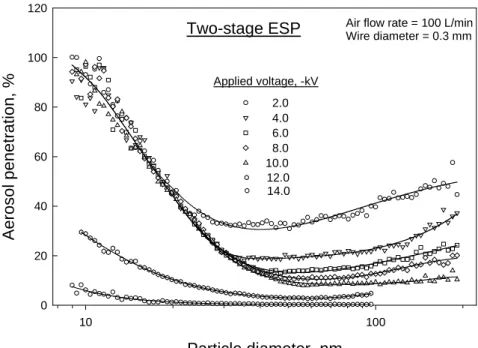
different corona current conditions. ………13 Figure 10. Ultra-fine aerosol penetration through the two-stage ESP as a function of
particle size under different applied voltages. ………13 Figure 11. Comparison of ultra-fine aerosol penetration through the single- and
two-stage ESP, with the corona current of 0.01 mA and air flow of 100 L/min. ………..14 Figure 12. Comparison of aerosol penetration patterns of the single- and two-stage
ESPs……….14 Figure 13. Aerosol penetration (dia. 10 and 100 nm) and power consumption of the
V
表目錄
1
VOL. 36, NO. 21, 2002 / ENVIRONMENTAL SCIENCE & TECHNOLOGY,4625-4632
Introduction
Historically, controlling particulate emissions into the atmosphere has
emphasized reducing the mass of the discharged material. However, recent studies have shown that fine particles, defined as those less than 2.5 µm in diameter, have a greater impact on visibility, health, and water droplet nucleation than larger
particles. Moreover, the extended time fine particles spend in the atmosphere makes them difficult to control than larger particles. Accordingly, new particulate matter standards, based on an aerodynamic diameter below 2.5 µm were proposed
(1). Although fine particles do not significantly contribute to the mass base of an ESP’s outlet emission, they may become more important in light of new or future health regulations regarding PM2.5 aerosol. Consequently, with the adoption of these new standards, we are interested in the performance of control devices in the fine particle range.
Although it is not clear from the epidemiology standpoint whether it is the mass, number or even surface area of particles, which is the most important determinant of health impact, some toxicological studies showed that particles with diameter less than 100 nm (also referred to as ultrafine particles) exert a much stronger
physiological effect than the same mass of coarse particles (2 and 3). In theory therefore, if the ultrafine aerosol hypothesis is correct, the use of mass, which is dominated by larger particles, may in some circumstances seriously misrepresent the toxicity of the pollutant. It is thus desirable to investigate the capacities of
conventional air pollution control equipments for collecting ultrafine particles. In many industries, electrostatic precipitators (ESPs) are widely used as
economical and efficient air pollution control devices. Although they often demand the highest capital investment of all comparable methods for removing pollutants from effluent gas streams, low operating and maintenance costs, high collection efficiencies, and the ability to withstand severe operating conditions, make electrostatic precipitators ideally suited for application to a variety of industrial pollution problems.
ESPs capture particles by using electrical mechanisms and thus the efficiency of an ESP depends mainly on its ability to charge particles. There are two principal charging mechanisms: diffusion charging and field charging. Charging of particles takes place when ions bombard the surface of a particle. Although particle charge decreases with particle size, mechanical mobility increases rapidly with decreasing size. Consequently, there is a theoretical minimum collection efficiency in the size range of 0.1 ~ 1 µm (4). This is a value similar to that observed in the filtration characteristics of mechanical filters (5). This “U”-shape collection efficiency curve has been verified by many experimental studies (5-9). Although the overall mass collection efficiency of conventional ESPs can easily exceed 99%, the penetration of submicrometer particles can be in tens of percent (8 and 10), when calculated in terms of number density rather than mass. Interestingly, the collection efficiency for
particles smaller than several tens of nanometers decreased with decreasing particle size (6, 7, and 11). As concluded in many studies, this fact implies the existence of a limited particle charging regime in which a portion of the incoming particles are not charged (7, 10, and 11). There has been considerable interest in determining a mechanism for the charging of ultrafine particles in the past decades. The need to extend the useable range of differential mobility analyzers is the impetus for these studies (12-16). In this study, the charges of the particles in this regime were also measured in order to investigate the penetration characteristics of partially charged
2
particles through ESPs.
ESPs are configured in several ways. Some of these configurations have been developed for special control, and others evolved for economic reasons. Although ESPs are operated using the same mechanisms to collect particles, the filtration characteristics of ESPs may differ with different configurations.
To further understand the behavior of ultra-fine particles (diameter < 100 nm) in ESPs, a controlled experimental study was conducted. The penetration of ultra-fine particles through a single- and a two-stage ESPs is presented as a function of particle size. The existence of partially charged particles is examined experimentally.
Experimental materials and methods
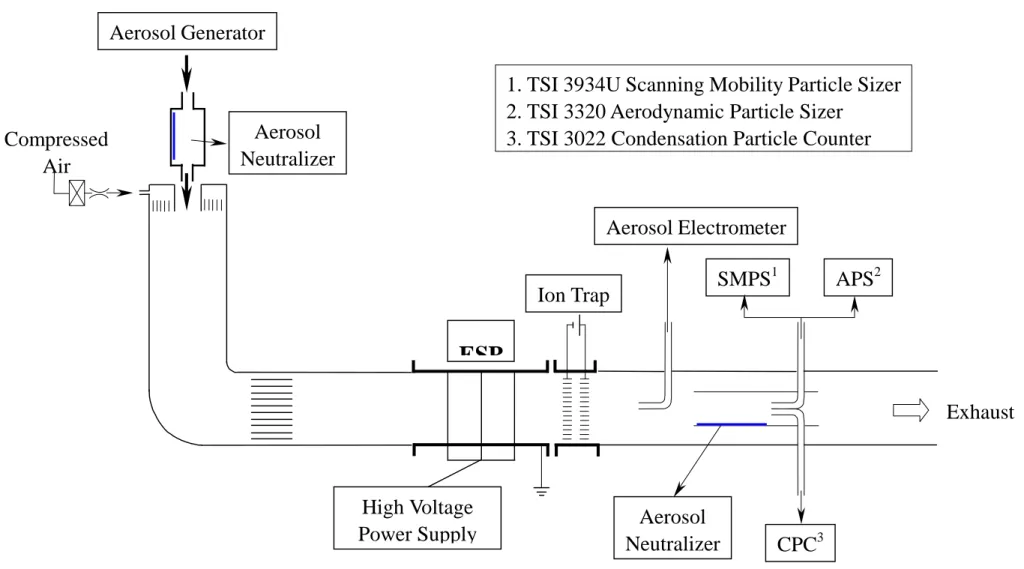
Figure 1 schematically depicts the test system. Sucrose was selected as the test material. A constant output atomizer (model 3076, TSI Inc.) was used to generate polydisperse ultra-fine challenge aerosol particles. These were then passed through an aerosol neutralizer. The neutralized aerosols were mixed with dried and filtered air to obtain the desired flow rates and ensured that the aerosol particles were
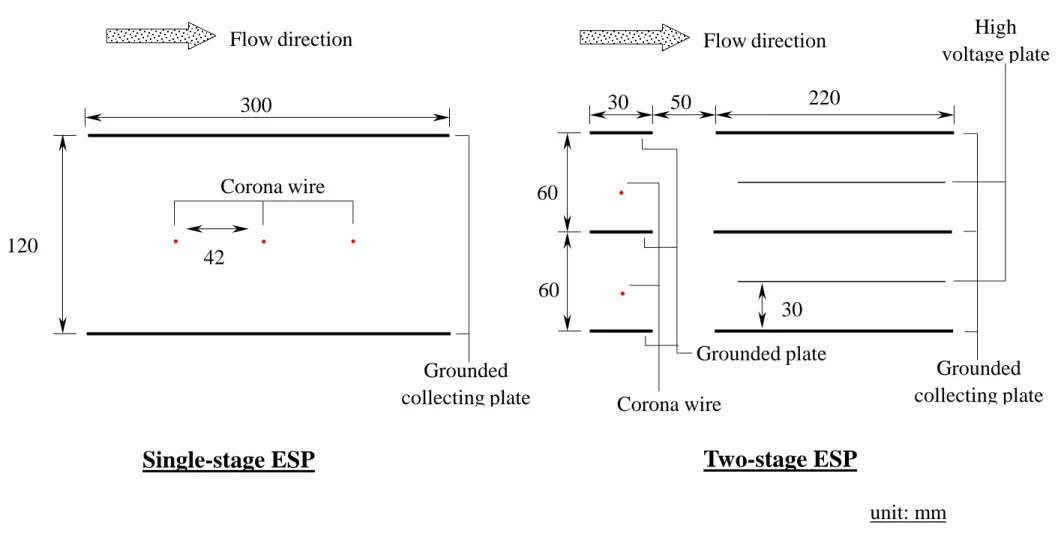
completely dry prior to entering the ESP system. In this work, the air flow rate was 100 L/min (residence time, t, is 1.64 sec.), unless otherwise specified. The particle number concentration of upstream aerosols was about 1.2 ×10⁵ count/cm3 with a count median diameter (CMD) of 42 nm, and a geometric standard diameter (GSD) of 1.8. An electrospray aerosol generator (model 3480, TSI, Inc.) was used to generate monodisperse ultra-fine particles as the challenge aerosol to investigate the ultra-fine particle charges given by ESPs. Two types of ESP: a single-stage and a two-stage model following the conventional wire-plate approach were built and tested in the present study. The physical configurations of these ESPs are shown in Figure 2. The dimensions and operating conditions are listed in Table 1. Copper wires that are 0.3 mm in diameter were used as discharge electrodes. A high voltage DC power supplier (model SL50PN300, SPELLMAN High Voltage Electronics Corporation) was used to supply a charging negative voltage (0 ~ 30 kV) to the discharged
electrodes. The values of the output voltage and current were read directly from the power supply. To avoid the interference of high mobility negative ions, a small electrical field was applied immediately behind the outlet of the ESPs. A scanning mobility particle sizer (SMPS, model 3934U, TSI Inc.) and an aerodynamic particle Sizer (APS, model 3320, TSI Inc.) were used to measure the aerosol concentrations and size distributions. The SMPS measures the particle number concentrations and size distribution in the sub micron size range by using the electrical mobility detection technique. The APS, which uses the time-of-flight particle sizing technology, was capable of counting and sizing micrometer-sized particles that generated by an ultrasonic atomizing nozzle (model 8700-120, Sonotek Inc., Highland, N.Y.). Both particle size spectrometers were calibrated using the polystyrene latex, PSL, particles (Duke Scientific Corp.). Particle number concentration data, obtained in the
power-on and power-off modes, were used to evaluate the penetration of the aerosol through the ESPs. The total aerosol charge was measured with an aerosol
electrometer (model 3068, TSI, Inc.). The average charge in each particle was then determined using the total particle number concentration measured by the
condensation particle counter (CPC, model 3022, TSI Inc.). The CPC first grows smaller particles to larger alcohol droplets and then measures the droplet
concentrations in an optical chamber. The temperature and relative humidity in the testing chamber were 20 ~ 25 ℃ (room temperature) and 10 ~ 15 %, respectively.
3
Results and Discussions
Figure 3 shows the relationship between corona current and applied
voltage. Both the single- and the two-stage ESPs were examined with clean plates in a particle free chamber. Using the empirical formulas (17 and 18), the corona onset voltage for the single- and two-stage ESPs were calculated to be –10 kV and –8.7 kV, respectively. The calculated results coincide well with the measured values, as shown in Figure 3. As expected, the corona current increased nonlinearly after the corona onset point, as the applied voltage increased.
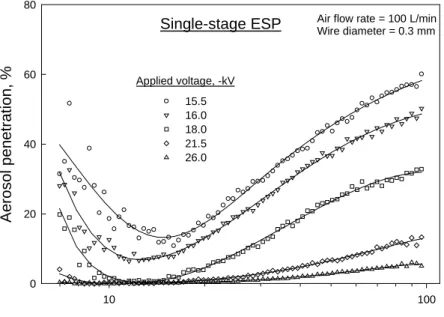
The experimental results concerning the penetration of aerosol through the ESPs as a function of particle size are shown in Figures 4 and 5 for the single-stage ESP, and Figure 10 for the two-stage ESP. In Figure 4, the aerosol penetration through the ESP was measured under five different applied voltages. A higher applied voltage resulted in lower aerosol penetration due to a higher electrical field strength and corona current. For example, the penetration of the 100 nm particles decreased from 60 % to 5 % as the applied voltage increased from –15.5 kV to –26.0 kV. In general, the aerosol penetration decreased with decreasing particle size, from 100 nm until it reached a penetration minimum around 15 nm. Then, aerosol penetration increased again with decreasing aerosol size. The increase in aerosol penetration in the
ultra-fine particle region was also observed by Yoo et al. (7), and Zhuang et al. (10). These authors have ascribed this phenomenon to the fact that some particles were not charged. In this study, the phenomenon of partial charging was investigated
experimentally and theoretically. The results are shown in Figures 7 and 8, respectively.
However, the partial charging effects on the aerosol penetration became less obvious as the applied voltage increased to –26kV. Greater than 99% of particles with a diameter less than 20 nm were collected. This result does not seem to support the concept of partial charging. This is probably due to the following reasons. 1.) It has been shown that the electrical potential in the ESP was higher than the applied voltage when the particle space charge density was very high (19 and 20). The enhanced electrical field augmented the particle charging and, therefore, the collection efficiency. 2.) The secondary flow caused by the ions that flow from the discharging wire to the grounded electrode is generally known as electric, corona, or ionic wind (21). This increased as the flow velocity became smaller, especially when the flow velocity was less than 0.6 m/s (21), or the applied voltage was high. A strong ionic flow may force particles, especially ultra-fine ones, to move toward the collecting plates and subsequently be collected. 3.) Turbulent diffusion may also contribute to the high collection efficiency of ultra-fine particles in an ESP by increasing the probability of particles collision with collecting surfaces.
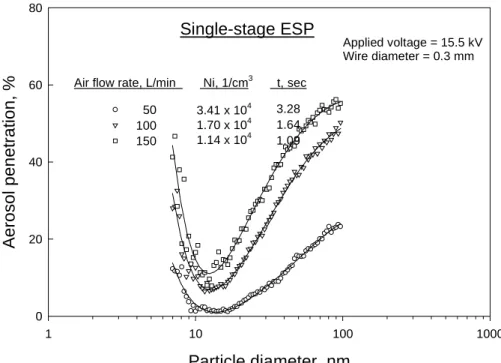
Figure 5 shows increasing aerosol penetration with increasing flow rate, due to a reduction of residence time in the ESP. For example, when filtration flow increased from 50 L/min (t = 3.28 sec.) to 150 L/min (t = 1.09 sec.), the penetration of 100 nm particles through the ESP increased from 23 % to 55 %. The increase in aerosol penetration resulting from partial charging of aerosol is also observed in Figure 5.
The aerosol electrometer used an absolute filter to remove the charged particles from the air stream. The readings of the aerosol electrometer could be altered by the existence of free ions if an ion trap was not used. Figure 6(A) shows the performance of the ion trap for different applied voltages in particle free condition when the ESP
4
operated at –26 kV (ion current = 0.1 mA). A voltage of +15 V as required to remove free ions when the corona current was 0.1 mA, which was the maximum value used in this study. However, the ion trap was used to remove the excess ions but not the particles. Figure 6(B) shows the aerosol penetration (through the ion trap) of charged particles (ESP’s corona current = 0.1 mA) in the 10 ~ 800 nm size range when a +15 V is applied to the ion trap. Almost 100% penetration was obtained down to 30 nm; maintained above 94% and 85% at 25 nm and 13 nm, respectively.
Figures 7 and 8 show the experimental and theoretical results, respectively,
concerning the number of particle charges given by the single-stage ESP. In Figure 7, the values of the product of the ion number concentration (Ni) and the charging time (t) were changed from 3.8×10⁵ s/cm3 to 4.66×10⁵ s/cm3. The graph shows that the particle charge increased with the particle diameter and with the value of Nit. By using the particle charging equations of Hinds (22), Figure 8 showed theoretical results calculated with different Nit values. The measured values were also compared with values calculated using Cochet’ charge equation (23), which was also used in many studies (24 and 25) to predict the performance of an ESP. An average charge of below one elementary charge meant that some particles were uncharged, and would not be collected in the ESP. This situation was called partial charging (7). The partial charging regime depended on the value of Nit. When tested with a larger Nit, the upper size limit of the partial charging shifted to a smaller size. In Figure 8, the experimental results closely matched the theoretical prediction of Hinds although the slopes were slightly different. This difference might be due to the losses of more heavily charged particles in the ESP, especially for larger particles, i.e., the charges of larger particles might be underestimated when compared to the smaller ones. This inference was indirectly supported by the appearance of maximum values of curves showed in Figure 9, illustrating the average elementary charge carried by 10-nm and 48-nm particles under different corona current conditions. Since particle loss can increase with Nit faster than the acquisition of charge, and the more heavily charged particles are preferentially removed, it is possible for there to be a maximum in the curve. This was observed experimentally in two studies (14 and 15) as well. If the particle loss in the ESP had been neglected in the model calculations, then these curves would have been monotonically increasing (15). Furthermore, the
experimental data have slope that strikingly close to that predicted by Licht although there seems to be some systematic lowering from this theoretical line. If an
adjustment of particle loss were made, it would be tempting to say that the
experimental data might be more closely aligned with the theoretical data of Licht than the theoretical data of Hinds. Clearly, this area needs further studies.
Aerosol penetration through the two-stage ESP at different applied voltages was also investigated. The results are shown in Figure 10. As expected, the aerosol penetration through the ESP decreased as the applied voltage increased. When the applied voltage was below –10 kV, however, the collection efficiency of particles with a diameter of less than 20 nm decreased significantly. This was because the applied voltage was lower than the onset voltage of the two-stage ESP shown in Figure
3. The partial charging effect could also be observed with the two-stage ESP. Figure 10 shows that aerosol penetration decreased as aerosol size decreased from 200 nm to 50 nm. At this point aerosol penetration started to increase. This concurs with the results of Yoo et al. (1997) (7).
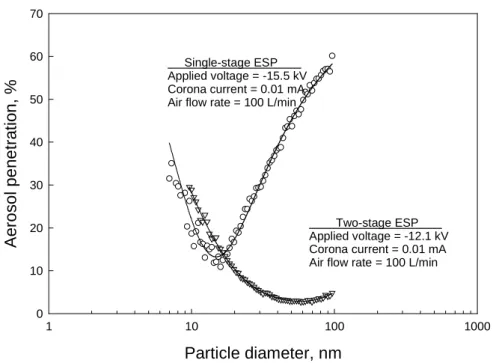
Figure 11 shows the difference in aerosol penetration between single- and two-stage ESPs for a given corona current (0.01 mA) and air flow rate (100 L/min) (t = 1.64 sec.). The two-stage ESP was obviously more efficient when used to collect
5
particles with diameters more than 20 nm. However, the collection efficiency of the two-stage ESP for particles smaller than 20 nm in diameter was slightly lower than that of the single-stage ESP. The difference in the aerosol penetration characteristics was likely due to different collection processes such as turbulent diffusion, since the values of Nit were the same for both ESPs. Therefore, a higher electrical field in the collecting cell of the ESP would improve particle collection efficiency, especially for particles larger than 20 nm. Moreover, ESPs with different configurations might also affect the penetration minimum
Figure 12 shows the filtration characteristics of single- and two-stage ESPs for 10 nm to 10 µm particles. The aerosol penetration data points for sizes above 0.8 µm were measured using an aerodynamic particle sizer (APS, model 3320, TSI Inc.), and were described in detail elsewhere (26). Figure 12 shows that aerosol penetration curves through both ESPs for particle sizes above 50 nm were almost
identical. However, the two-stage ESP exhibited less efficiency than the single-stage ESP for particles smaller than 50 nm. Figure 12 also shows that the collection
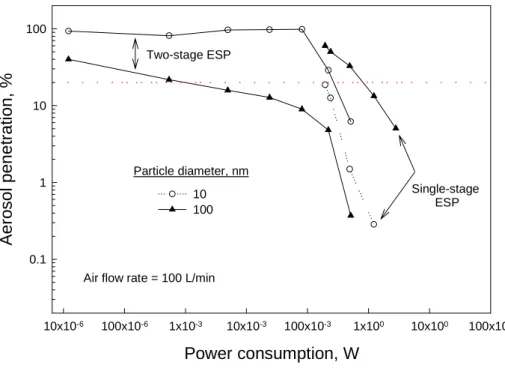
minimum of the two-stage ESP no longer fell within the 0.2 to 0.5 µm range (4, 9, and 23). This phenomenon needs to be considered when developing the performance testing requirements for ESPs. Notably, both the applied voltages and the corona currents of the ESPs were different in this case. Therefore, an index “power
consumption”, which was the product of voltage and current, was used to objectively compare the performance of these two ESPs. Figure 13 shows the relationship between the power consumption and the aerosol penetration of these two ESPs, when used to collect 10 nm and 100 nm particles. The single-stage ESP, when used as an air cleaning device, consumed 0.2 W to collect 80 % of the 10 nm particles and 1 W to collect the same percentage of the 100 nm particles. The two-stage ESP consumed 0.35 W and 0.001 W to collect 80 % of the 10 nm and the 100 nm particles,
respectively. Therefore, to achieve the same collection efficiency, it is more economical to use single-stage ESPs to collect particles smaller than 16 nm. However, it was more economical to use two-stage ESPs to collect particles larger than 16 nm.
Acknowledgment
The authors would like to thank the National Science Council of Taiwan for financially supporting this research under Contract No. NSC 90-2320-B-002-039. References
(1) US EPA, National Air Quality and Emissions Trends Report, 1996, http://www.epa.gov/oar/aqtrnd96/toc.html.
(2) Oberdorster, G., Ferin, J., Gelein, R., Soderholm, S.C., Finkelstein, J.
Environment and Health Perspectives 1992, 97: 193-199.
(3) Donaldson, K., Li, X.Y., MacNee, W. J. Aerosol Sci.1998, 29: 553-560. (4) Hinds, W.C. Aerosol Technology: Electrical Properties, J. Wiley and Sons, New York, 1982, p 297, 305.
(5) Chen, C.C. and Huang, S.H. Am. Ind. Hyg. Assoc. J. 1998, 59(4): 227-233.
6
(6) McCian, J.D., Gooch, J.P., and Smith, W.B. J. Air Pollut. Control Assoc. 1975, 25(2): 117-121.
(7) Yoo, K.H, Lee, J.S., and Oh, M.D. Aerosol Sci. Technol. 1997, 27: 308-323.
(8) Ylätalo, S.I. and Hautanen, J. Aerosol Sci. Technol. 1998, 29(1): 17-30. (9) Chang, C.L. and Bai, H. J. Aerosol Sci. 1999, 30(3): 325-340.
(10) Zhuang, Y., Kim, Y.J., Lee, T.G., and Biswas, P. J. Electrostst. 2000, 48: 245-260.
(11) Hanley, J.T., Smith, D.D., Lawless, P.A., Ensor, D.S., and Sparks, L.E.
Proceeding of the Fifth International Conference on Indoor Air Quality and Climate.1990, Toronto, Canada, July 29-August 3:187-192.
(12) Adachi, M., Kousaka, Y., and Okuyama, K. J. Aerosol Sci. 1985, 16(2): 109-123.
(13) Davison, S.W., Hwang, S.Y., and Gentry, J.M. Langmuir 1985, 1: 150-158.
(14) Hwang, S.Y., Gentry, J.W., and Davison, S.W. J. Aerosol Sci. 1986, 17(2): 117-127.
(15) Davison, S.W., Yu, P.Y., Hwang, S.Y., and Gentry, J.W. J. Aerosol Sci. 1986, 17(3): 481-483.
(16) Chen, D.R and Pui, D.Y.H. Journal of Nanoparticle Research 1999, 1: 115-126.
(17) Flagan, R.C. and Seinfeld, J.H. Fundamentals of Air Pollution
Engineering. Prentice-Hall, Englewood Cliffs, NJ. 1988.
(18) Anthony, J.B. and Wayne, T.D. Air pollution engineering manual / Air &
Waste Management Association. New York: Van Nostrand Reinhold. 1992.
(19) Bohm, J. Electrostatic precipitators, Elsevier, New York, 1982. (20) Park, S.J. and Kim, S.S. J. Electrostst. 1998, 45: 121-138.
(21) Liang, W.J. and Lin, T.H. Aerosol Sci. Technol. 1994, 20: 330-344. (22) Hinds, W.C. Aerosol Technology: Electrical Properties, J. Wiley and Sons, New York, 1999, p 325.
(23) Litch, W. Air Pollution Control Engineering, Marcel Dekker, New York, 1988.
(24) Bai, H., Lu, C., and Chang, C.L. J. Air & Waste Manage. Assoc. 1995, 45: 908-916.
(25) Lu, C. and Huang, H. J. Aerosol Sci. 1998, 29(3): 295-308.
7 T a b l e 1 . D i m e n s i o n s a n d o p e r a t i n g c o n d i t i o n s S i n g l e - s t a g e E S P R a d i u s o f w i r e : 0 . 3 m m N u m b e r o f w i r e s : 3 ( s e r i e s ) L e n g t h o f E S P : 3 0 0 m m W i d t h o f E S P : 1 2 0 m m H e i g h t o f E S P : 7 6 m m W i r e t o w i r e s p a c e : 4 2 m m A p p l i e d v o l t a g e o f c o r o n a w i r e : - 1 5 . 5 ~ - 2 6 k V A i r f l o w r a t e : 5 0 , 1 0 0 , 1 5 0 L / m i n T w o - s t a g e E S P C h a r g i n g c e l l R a d i u s o f w i r e : 0 . 3 m m N u m b e r o f w i r e s : 1 L e n g t h : 5 0 m m W i d t h : 6 0 m m H e i g h t : 7 6 m m N u m b e r o f c h a r g i n g c e l l : 2 ( p a r a l l e l ) C o l l e c t i n g c e l l L e n g t h : 2 0 0 m m W i d t h : 3 0 m m H e i g h t : 7 6 m m N u m b e r o f c o l l e c t i n g c e l l : 4 ( p a r a l l e l ) A p p l i e d v o l t a g e o f c o r o n a w i r e : - 2 ~ - 1 4 k V A i r f l o w r a t e : 1 0 0 L / m i n P a r a l l e l p l a t e i o n t r a p A p p l i e d v o l t a g e : d . c . 1 5 V D i s t a n c e b e t w e e n t w o p l a t e s : 5 m m S i z e o f i o n t r a p : 5 5 × 5 5 × π × 1 5 m m 3
8
Compressed
Air
Aerosol Electrometer
Exhaust
CPC
3High Voltage
Power Supply
Ion Trap
SMPS
1Aerosol
Neutralizer
Aerosol
Neutralizer
Aerosol Generator
ESP
Figure 1. Schematic diagram of the experimental set-up.
APS
21. TSI 3934U Scanning Mobility Particle Sizer
2. TSI 3320 Aerodynamic Particle Sizer
9
unit: mm
·
·
300
120
Single-stage ESP
·
42
·
·
30
50
220
60
60
Two-stage ESP
30
Figure 2. Configurations of the single- and the two-stage ESPs. (top view)
Flow direction
Corona wire
Corona wire
Grounded
collecting plate
Grounded
collecting plate
High
voltage plate
Flow direction
Grounded plate
10 Applied voltage, -kV 0 10 20 30 40 50 C o rona cur rent , m A 0.0 0.1 0.2 0.3 0.4 0.5
Air flow rate = 100 L/min (particle free) Wire diameter = 0.3 mm single-stage two-stage Single-stage ESP Particle diameter, nm 10 100 A e rosol pen etration, % 0 20 40 60 80
Air flow rate = 100 L/min Wire diameter = 0.3 mm Applied voltage, -kV 15.5 16.0 18.0 21.5 26.0
Figure 4. Ultra-fine aerosol penetration through the
11
Figure 5. Ultra-fine aerosol penetration through the single-stage ESP
as a function of aerosol size at different testing flow rate.
Single-stage ESP Particle diameter, nm 1 10 100 1000 A e ros o l penet rat ion, % 0 20 40 60 80 Applied voltage = 15.5 kV Wire diameter = 0.3 mm Air flow rate, L/min Ni, 1/cm3 t, sec
50 100 150 3.41 x 10⁴ 1.70 x 10⁴ 1.14 x 10⁴ 3.28 1.64 1.09 Particle diameter, nm 10 100 1000 A e ro sol pen et ra ti on , % 0 20 40 60 80 100 120
Flow rate = 100 L/min Ion trap voltage = 15 V Corona current = 0.01 mA Applied voltage, V 0 5 10 15 20 25 30 A e ro sol ele c tr ome te r out pu t, V -0.6 -0.5 -0.4 -0.3 -0.2 -0.1 0.0 0.1
Particle free condiction A ir flow rate = 100 L/m in
E S P setup
Ion current = 0.1 m A A pplied voltage = 26 kV
Figure 6. Performance characteristic curve of the ion
trap.
12 Particle diameter, nm 0 10 20 30 40 50 60 Nu mb er of ele m ent ar y cha rg e s 0.00 0.05 0.10 0.15 0.20 0.25 0.30 Single-stage ESP air flow rate = 100 L/min
Ni x t, 10 5 number-s/cm3 3.80 4.12 4.30 4.47 4.53 4.66 A
Figure 7. Particle charges acquired in the single-stage ESP.
Figure 8. Comparison of experimental and theoretical results
Particle size, nm 20 30 40 50 60 70 80 90 10 100 Number of elem en tary charg e s 0.001 0.01 0.1 1 10 100 Ni x t, s/cm3 4.66 x 10⁸ 4.66 x 10⁶ 4.66 x 10⁵ 4.66 x 10⁴ Pa rt ia l c har eg in g re g im e Experimental data Hinds, 1999 Licht, 1988 Theorical value
13 Corona current, mA 0.00 0.02 0.04 0.06 0.08 0.10 0.12 0.00 0.05 0.10 0.15 0.20 0.25 0.30 N u mb er o f el e m ent ar y ch arg e s 48-nm particles 10-nm particles Air flow rate = 100 L/min
(t = 1.64 sec.)
Figure 9. Average elementary charge carried by 10-nm and
Two-stage ESP Particle diameter, nm 10 100 Aerosol penet ra ti on, % 0 20 40 60 80 100 120
Air flow rate = 100 L/min Wire diameter = 0.3 mm Applied voltage, -kV 2.0 4.0 6.0 8.0 10.0 12.0 14.0
Figure 10. Ultra-fine aerosol penetration through the two-stage
ESP as a function of particle size under different
14 Particle diameter, nm 1 10 100 1000 A e ro so l pe ne tr at io n , % 0 10 20 30 40 50 60 70 Single-stage ESP Applied voltage = -15.5 kV Corona current = 0.01 mA Air flow rate = 100 L/min
Two-stage ESP Applied voltage = -12.1 kV Corona current = 0.01 mA Air flow rate = 100 L/min
Figure 11. Comparison of ultra-fine aerosol penetration through
Figure 12. Comparison of aerosol penetration patterns of the single- and
two-stage ESPs.
Two-stage ESP Particle diameter, nm 10 100 1000 10000 A e ro s o l pe netr a ti on, % 0 10 20 30 40 50Air flow rate = 100 L/min Applied voltage = 12.1 kV Corona current = 0.01 mA APS SMPS Single-stage ESP Particle diameter, nm 10 100 1000 10000 A e ro sol penet ra ti on, % 0 10 20 30 40 50
Air flow rate = 100 L/min Applied voltage = 26.4 kV Corona current = 0.08 mA
APS SMPS
15
Figure 13. Aerosol penetration (dia. 10 and 100 nm) and power consumption of
the single- and two-stage ESPs.
Power consumption, W 10x10-6 100x10-6 1x10⁻³ 10x10-3 100x10-3 1x100 10x100 100x100 A e ro sol pe net rat ion, % 0.1 1 10 100
Air flow rate = 100 L/min Two-stage ESP Single-stage ESP 10 100 Particle diameter, nm