Department of Business Administration
I-Shou University
Master thesis
An assessment of the satisfaction of tourists in Nha
Trang city
Advisor: CHING-SUNG LAI, Ph.D
Co-advisor: TAN- HO SY, Ph.D
Graduate Student: PHUOC-HUYNH THANH
Acknowledgement
I would like to thank my professors who have been teaching for the last two years in the MBA courses. I have learnt a lot from them. Especially, I would like to thank Dr.Ching Sung Lai and Dr. Ho Sy Tan for their guidance in my thesis.
I also thank my classmates for their support for the last two years. It was a great time with time. Finally, I would like to thank my family for their support and motivation so that I can finish this course. Thank you very much!
Abstract
Nowadays, tourism becomes a necessity of life, and tourists require the tourism service that is increasingly higher. This is a challenge for tourism companies in Nha Trang City. Nha Trang welcomes thousands of tourists every year. Thus, the issue here is to make them satisfied about the service and make them feel that Nha Trang is an ideal worthy destination. Especially, if international tourists have a good impression about Nha Trang, they can promote the image of the city to their friends and relatives. It will bring an advantage to the province, the city and the local people as well. The more tourists come to the city, the larger source of foreign exchange is. The infrastructure will be upgraded, the local people will have extra income and the employees will have more job opportunities with many more culture exchanging and learning oppurtunities for the city. Nha Trang definitely enjoys enormous benefits from the tourism development. However, the most important thing is to leave touristswith impression about the city, especially international ones. The result shows that there are 5 factors that have influence on the satisfaction of tourists: attractive destination; infrastructure; perceived value, subjective risk and objective risk
Keywords: tourism, satisfaction, Nha Trang
TABLE OF CONTENTS
Acknowledgement ... i
Abstract ... ii
TABLE OF CONTENTS ... iii
LIST OF FIGURES ... v
LIST OF TABLES ... vi
CHAPTER 1 INTRODUCTION ... 1
1.1 REASON FOR CHOOSING THE TOPIC ... 1
1.2 RESEARCH OBJECTIVES ... 1
1.3 SCOPE AND SUBJECT OF THE RESEARCH ... 2
1.4 THE SIGNIFICANCE OF THE RESEARCH ... 2
1.5 THE STRUCTURE OF THE RESEARCH: ... 2
CHAPTER 2 LITERATURE REVIEW ... 3
2.1 OVERVIEW OF NHA TRANG – KHANH HOA TOURISM ... 3
2.2 THEORETICAL FOUNDATION ... 4
2.3 RESEARCH MODEL... 9
CHAPTER 3 RESEARCH METHODS ... 16
3.1 METHODOF DATA COLLECTION ... 16
3.2 DATA ANALYZING METHOD ... 16
3.3 RESEARCH PROCEDURE ... 18
3.3.1 Preliminary research ... 18
3.3.2 Preliminary assessment on measurement scale ... 20
3.4 INTRODUCTION OF FORMAL STUDY ... 20
CHAPTER 4 RESEARCH RESULTS ... 22
4.1 INTRODUCTION ... 22
4.2 RESULT OF THE QUANTITATIVE ANALYSIS ... 22
4.2.1 Description of the characteristics of the research data sample ... 22
4.3 EVALUATING THE RELIABILITY OF THE SCALES BY CRONBACH’S ALPHA 27 4.4 EXPLORATORY FACTOR ANALYSIS EFA ... 30
Cumulative ... 31
Cumulative ... 31
% of 31 4.5 CALCULATING THE QUANTITY OF THE DESCRIPTIVE STATISTICS FOR THE OBSERVED VARIABLES ... 34
4.5.1. The descriptive statistics of the observed variables of the scales ... 35
4.6 REGRESSION ANALYSIS AND TEST OF THE RESEARCH HYPOTHESES ... 36
4.6.1 Test of the correlation coefficient of the variables ... 36
4.6.2 The result of regression analysis ... 38
4.7 TEST OF HYPOTHESES IN THE MODEL ... 41
CHAPTER 5 CONCLUSIONS & RECOMMENDATIONS ... 43
5.1 SOME PROPOSED SOLUTIONS TO IMPROVE THE SATISFACTION OF INTERNATIONAL TOURISTS TRAVELING TO NHA TRANG ... 43
5.2 CONCLUSIONS... 44
5.3 LIMITATIONS AND FURTHER RESEARCH TRENDS ... 45
REFERENCES ... 46
APPENDIX ... 48
LIST OF FIGURES
Figure 2.1 The research model of Tsung Hung Lee ... 11
Figure 2.2 Research model in Yumi Park ... 12
Figure 2.3: Research model of Rita Faullant et al. ... 13
Figure 2.4: Research model of Andrew Lepp et al. ... 13
Figure 2.5: Research model of Christine et al. ... 14
Figure 3.1 Research procedure ... 18
Table 4.16: The rotated factor matrix after eliminating the smaller factor loadings ... 33
Figure 4.3: New research model ... 41
LIST OF TABLES
Table 3.1: The measurement scale of attractive destination ... 19
Table 3.2: The measurement scale of the infrastructure and entertainment ... 19
Table 3.3: The measurement scale of perceived risk ... 20
Table 3.4: The measurement scale of customer satisfaction ... 20
Table 4.1: The gender statistics in the research sample ... 22
Table 4.2: The age statistics in the research sample ... 23
Table 4.3: The education level statistics in the research sample ... 23
Table 4.4: The education level statistics in the research sample ... 24
Table 4.5: The statistics on number of arrivals in the research sample ... 24
Table 4.6: The statistics on tourists’ duration of stay in Nha Trang ... 25
Table 4.7: The statistics of the number of those who accompany tourists ... 25
Table 4.8: The statistics of tourists’ annual income ... 26
Table 4.9: The nationality statistics ... 26
Table 4.10: The statistics of the ways tourists know about Nha Trang ... 27
Table 4.11 The Cronbach’s Alpha result of the scales ... 28
Table 4.12 The Cronbach’s Alpha result of the scales after eliminating the variables ... 29
Table 4.13: KMO and Bartlett’s test ... 30
Table 4.14: Total variance explained ... 31
Table 4.15: The rotated factor matrix ... 32
Table 4.17: Descriptive statistics of the scales ... 35
Table 4.18: The matrix of the coefficient of correlation of the variables ... 37
Table 4.19: Model summary ... 39
Table 4.20: ANOVA Results ... 39
Table 4.21: Factors influencing tourist satisfaction ... 40
CHAPTER 1 INTRODUCTION
1.1 REASON FOR CHOOSING THE TOPIC
Nha Trang is a city of Khanh Hoa Province which is located on the South Central Coast. With the natural beautiful location, Nha Trang is ranked as one of the 29 most beautiful bays in the world. Nha Trang also has long beach, and many rivers, a large island and smaller ones. Nha Trang has a tropical savanna climate with more than 300 sunny days a year. In addition, the Province also has many cultural deposits that have close connection with the Viet-Cham culture, famous landscapes, and unique festivals in the coastal land of the gentle, hospitablelocal people.
Nowadays, tourism becomes a necessity of life, and tourists require the tourism service that is increasingly higher. This is a challenge for tourism companies in Nha Trang City. Nha Trang welcomes thousands of tourists every year. Thus, the issue here is to make them satisfied about the service and make them feel that Nha Trang is an ideal worthy destination. Especially, if international tourists have a good impression about Nha Trang, they can promote the image of the city to their friends and relatives. It will bring an advantage to the province, the city and the local people as well. The more tourists come to the city, the larger source of foreign exchange is. The infrastructure will be upgraded, the local people will have extra income and the employees will have more job opportunities with many more culture exchanging and learning oppurtunities for the city. Nha Trang definitely enjoys enormous benefits from the tourism development. However, the most important thing is to leave touristswith impression about the city, especially international ones.
Therefore I decide to study the topic “An assessment of the satisfaction of tourists in Nha
Trang city”. To understand what factors affect the customers’ satisfaction and dissatisfaction and
to figure out the strategy for the tourist city and Nha Trang will become an ideal tourism destination.
1.2 RESEARCH OBJECTIVES
- The general objective of the thesis is to assess the satisfaction of tourists when they come to Nha Trang.
- Specific objectives of the research are:
+To assess the actual situation of Nha Trang tourism
+ To define the factors affecting the tourists’ satisfaction and to measure the influence level of these factors.
+ To propose some solutions to enhance the satisfaction of tourists when they come to Nha Trang
1.3 SCOPE AND SUBJECT OF THE RESEARCH
- Research subject: international tourists in Nha Trang - Scope of research:
Research site: Nha Trang City
Duration: from August 2015 to December 2015
1.4 THE SIGNIFICANCE OF THE RESEARCH In theoretical aspect:
By completing this research, the author would like to contribute a part into systematization of theoretical foundation of customer satisfaction with tourism destination.
In practical aspect:
- To discover limited aspects in tourism in Nha Trang City, and to seek solutions to enhance customer satisfaction
- Making reference for the further studies.
1.5 THE STRUCTURE OF THE RESEARCH:
The thesis includes five following chapters: Chapter 1: Introduction
Chapter 2: Theoretical foundation Chapter 3: Research methods Chapter 4: Rearch results
Chapter 5: Significance and Conclusion
CHAPTER 2 LITERATURE REVIEW
2.1 OVERVIEW OF NHA TRANG – KHANH HOA TOURISM
Khanh Hoa has a more than 200km long beach with about 200 large and small islands, tropical climate and the average temparature is 26˚C. There are more than 300 clear sunny days a year and lots of famous historical relics and landscapes such as Po Nagar tower, Dien Khanh old Citadel, Yersin museum, Chong island, Dai Lanh, Van Phong bay, Duc My hot springs, Ba island, Lo river and Let hill. There are some famous islands such as Hon Tam, Tri Nguyen, Bich Dam, Hon Mun, and Hon Ong.And Nha Trang beach is an attracted clean and beautiful. Nature has granted Nha Trang a diversified tourism complex which includes moutain, forest, sea and islands.
Nha Trang is a coastal city and a political, economic, cultural and travelling center of Khanh Hoa province. It also is known as a festival city where was held many festivals such as Sea Festival, Miss Universe 2008, Miss Earth 2010, and so on. Beautifull beaches makes city become an attracted landscape for tourists. The climate is mild here and the transportation is convinience in waterway, road, airway and railway.
With favorable natural conditions both in terms of location, landscape, climate and historicaland humanistic background, Nha Trang is able to develop different types of tourism.
With such terrain, Nha Trang has some following characteristics:
Safety – Security: In here, customers always feel safe and secure in both life and property. This is an advantage for the development of the tourism. Regarding natural landscape, Nha Trang has a long beach, cool weather, fresh air, and beautiful landscapes which attract top investments. The city is also listed as one of eight first-grade provincial cities of Vietnam.
Friendly: This is a city where local people are warm, friendly and hospitality. It makes tourists feel comfortable and convenient. Professional service staffs always have kind welcoming attitudes absolutely and hence can get the heart of tourists.
The infrastructure which includes transportation, accommodation and dining facilities is very convenient.
Nha Trang is a potential travelling city which presents opportunities for business. The city can afford travelling motivations of customers. This is a safe and friendly destination.
Tourism plays an important role in the development of Nha Trang as follows:
Nha Trang is a focal economic sector of Khanh Hoa province. It achieves the highest efficiency to contribute the province to become a center of economy and major tourism in the
Central of the country.
The constanty increasing numbers of foreign touristscause the great amount of international currency revenue in the city. It contributes to increase GDP for Khanh Hoa province. The affective advertisement method about image and culture of a land for customersopens lots of job opportunities for employees.
To improve the quality of the environment
The tourism can provide many ideas good for the environment like controlling the quality of air, water, soil, noise pollution, gabage and other environmental issues through landscape planning programs, building designing or architecture construction maintainance.
It upgrades local infrastructure such as airports, roads, water supply systems, waste disposal, and communications that can be improved through tourism activities.
However, aside from positive aspects, there are some negative ones as below:
Sewage: If there is no sewage collection systems for hotels and restaurants, the sewage will absorbed into the groundwater basin or adjacent water area (rivers, lakes, and seas). It will spread many diseases such as parasites, intestinal, skin diseases or eye diseases, or will pollute water area that are harmful to the landscape and aquaculture.
Garbage: the uncontrolled waste disposal is a common issue of every resort. This causes loss of landscape, unsanitary and influences on public health and arising social conflicts.
2.2 THEORETICAL FOUNDATION Concept of the tourism
The tourism can be assigned comparatively into 2 groups: the first one includes the deep concept aspects of "visitor"; the second one is "tourism". Some typical concepts of these two groups are as follows.
In 1811, the definition of tourism appeared for the first time in England. “Tourism is the harmonious cooperation between the theory and the practice of journey(s) with the purpose of entertainment.”
In 1930, Mr. Glusman, a Swiss, defined that “Tourism is the conquest of the space of people who come to a place where they have no usual residence.”
At International Conference on Travel and Tourism Statistics in Otawa, Canada in May 1991, there was a definition: “tourism is an activity of individual to go to a place which is out of regular environment (his or her permanent residence) in the period which is shorter than the prescribed period by tourism organizations. The purpose of the trip is not for business within the area to visit.”
In the tourism ordinance of Vietnam, in Article 10, the term “tourism” shall be understood 4
as follows: “Tourism is a human activity which is outside of his/her permanent residence in order to satisfy his/her own needs of sightseeing, entertainment and relaxation in the given period.”
(Source: Tourism economy textbook)
Tourism products:
Tourism product is a set of necessary services to meet all needs of visitors in their trips. (Source: Vietnam National Administration of Tourism).
Tourism product is services and goods supplied to visitors and created by the combination of exploiting natural and social elements and using resources such as material and technical infrastructure and employees in a facility, an area or a certain country. (Source: Tourism economy
textbook)
Types of tourism:
According to author Truong Sy Quy, type of tourism is defined as “a set of tourism products which has similar characteristics, or meets all corresponding needs and travelling motivations, or is sold to one group of customers, or has same methods of distribution and organization, or is listed in one price level.
There are some typical types of tourism:
− Outbound tourism: is a type of tourism where the point of departure and arrival of visitors located in different countries. Visitors must go across the border and spend foreign currency in tourism destinations.
− Inbound tourism: is a type of tourism where the point of departure and arrival of visitors located in the territory of a country.
− Health tourism: is a type of tourism which visitor focus on medical treatments and the utilization of healthcare services.
− Relaxation and entertainment tourism: is a type of tourism to recover physical strengths and mentally health for tourists.
− Sport tourism: has two types of tourism
+ Active sport tourism: is a type of tourism which tourists are able to participate directly to sport activities such as hunting, skiing, or climbing…
+ Passive sport tourism: is the trip to watch international sport competitions or Olympics… − Cultural tourism: is a type of tourism which raises awareness of tourists of history,
architecture, customs, paintings…
− Business tourism: is a type of tourism which performs tasks or certain occupations.
− Merchant’s tourism: is a type of tourism which discovers markets, research investment
projects or signing contracts.
− Visiting tourism: is to visit friends, relatives for people who are living far from their country or family.
(Source: Tourism economy textbook)
The satisfaction: according to Philip Kotler, the customer satisfaction is the extent of the
state of feeling of a person starting from the comparison of results obtained from the consumption of products or services with his expectations. If the actual result is lower than the expectation, customers won’t be satisfied. On the other end, if the result matches with or better than the customers’ expectation, customers are satisfied or greatly satisfied.
Customers' satisfaction is the state when they feel about the service quality compared to the expectation (Kurt and Clow, 1998). In other words the satisfaction is measured by the gap between perceived quality and expected quality. The satisfaction is also understood as the feeling compared between outcomes and human expectation (Kotler, 2001). The satisfaction is measured by the ability to meet the needs of customers when they use goods and services (Oliver, 1997). Therefore although there are many different definitions about the satisfaction, in short, it is the difference between the perception and the expectation of customers when they are receiving goods or services.
Tourism Destination is an extensive definition in the tourism business as a place where is
attractive and appealing to the visitors. The tourism destination replies on the tourism resources. The tourism resources is defined as “all factors that can stimulate the tourism motivation of human which are took advantage by the tourism business to produce economic and social benefits” or “any natural, humanity and social factors which are attractive to tourists.” It means that not only natural or humanistic resources but also social events such as economy, politics, culture or sports… are able to attract tourists. On the other hand, not every tourism resource is exploited and becomes tourism destination. . It depends on many factors like: infrastructure, service base, tourism place operating time (regular, seasonal, short-terms and so on), the numbers of domestic and international visitors. The more the attraction for tourists of destinations, the much more the numbers of visitors will be. The higher quality and the more diversities of consumed services, the greater outcome and the more effective to the social-economy (Source: Institute for Tourism
Development Research)
Destination image: there are some different definitions of the destination image. The most
popular definition is “the summarization of belief, concept and displays of a person about the destination” (Crompton (1979:18)).
Besides, there is a definition of Chon (1992) and Baloglou & Bringmerg (1997), before 6
people go to a place; they develop an image and a set of expectations which include previous experiences such as verbal introduction, advertisements, news and the universal belief.
Millman and Pizam (1995) had cited from Tasci and Kozak (2006) which defined the destination image is a combination of all attributes which are relevant to tourism experiences. Buhalis (2000) called it a collection of expectations and perceptions about tourist potential. So the destination image is an individual perception to attributes of destination (Coshall, 2000, Tasci and Kozak, 2006) which could be affected by advertisement information at destination, media and many other factors (Tasci and Kozak, 2006).
Concepts of destination image have some differences and each author also has different identities. According to Crompton, it is the combination of the belief and concept.
Millam and Pizam summarized that it is a combination of attributes relevant to tourism experience. Chon, Baloglou & Bringmerg and Buhalis defined it as a combination of expectations on the ground of experience or individual perceptions.
The variables used to measure the destination image also have some differences as follows: According to the research of Amasra, Turkey
Marcelo Royo (2008) defined that the destination image of rural culture is a combination of eight following components:
1. The beauty of historical and cultural heritages and emotions arise through perception. 2. Fresh air/quiet space and emotions arise through perception
3. Services for visitors and emotions arise through perception 4. The harmony of architecture of the area
5. The history of the landscape 6. Shopping and foodstuffs
7. The harmony in tourism and culture management 8. Infrastructure
According to the research of Christina Geng-Qing Chi and Hailin Qu, the destination image includes:
1. Tourism environment 2. Attractive nature
3. Entertainment and events 4. Attractive history
5. Infrastructure 6. Accessibility 7. Relaxation
8. Outdoor activities 9. Cost and the value
The variables are different for each destination because of the difference of geography, history, culture and environment.
Previous research results have showed that the destination image has direct and indirect influence on behavioral intention (Alcaniz et al, 2009; Baloglu and McCleary, 1999; Bigne et al. 2001, Castro et al., 2007; Chen and Tsai, 2007; Chi and Qu 2008, Lee 2009).
The intention and the behavior are normally considered on the ground of different viewpoints: revisit and willingness to recommend to other people. After analysis, Baloglu and McCleary (1999) discovered that three factors of the destination image (experience quality, attraction and entertainment value) which are positively related to the willingness to recommend to other people.
Recently, Alcaniz et al. (2009) also has proved that the function of image is related to the consideration of intention only. The image psychology is related to intention to recommend. Combined image is associated with both intention and behavior.
For example, the destination image has significant influence on the satisfaction and the future behaviors of customers at the coastal resort in Spain (Bigne et al, 2001), landscape and coastal area in Taiwan (Lin et al, 2003) and in the Eureka Springs in the United States (Chi Qu, 2008). Chen and Tsai (2007) defined that the destination image has a direct influence on the quality of the trip, and indirect influence on the perceived value, the satisfaction and the behavior in the future, and the intention of customers visiting to coastal areas. Some travel documents indicate that the destination image is the premise for the satisfaction and the behavior of customers in the future.
The destination image includes factors such as safety, friendliness, many beautiful landscapes, many entertainment and leisure sciences.
The perceived risk: according to Sonmez, 1998, the perceived risk is an important factor
when examining outbound tourism. Peacefulness, quietness and safety are top conditions to attract visitors to come to any destinations.
Sonmez Graefe (1998) defined nine types of risks which are related to international tourism: finance, health, physics, political instability, psychology, satisfaction, society, terrorism and time. For American tourists, terrorism, transporting reliability and political instability are regularly related to outbound tourism.
The perceived risk is also defined as the subjective judgment of people on the nature and 8
severity of a risk. This term is most commonly used in reference materials of natural hazards and threats to the environment or health, such as nuclear energy. (Source: Wikipedia.org)
The risk is defined in different ways, but normally this is considered as an ability of an individual in the experience of dangerous effects (Short Jr, 1984). The nature of the risk which includes the probability of the incident and its consequences level is defined in a consensus way in every discussions (Rayner and Cantor, 1987).
According to Rosa (2003:56), defining the risk is a situation or an event in which something of human value (plus artificial things) are threatened and the results are uncertain.
The recent researches have showed that the perceived risk has increasing influences on decision making of tourism (Lepp & Gibson, 2003, 2008; Reisinger & Mavondo, 2005).
According to Beirman, 2003, perceived safety and security are important factors in the making decision of tourism destination.
A research press about Thailand tourism has indicated that visitors will not ignore the personal safety even the travelling cost is low. If customers perceive the terrorism risk about one destination, they will choose another one which is safer. However, some visitors still come to destination of risk, especially backpackers. This result is as same as that of Elsrud (2001) and Lepp and Gibson (2003). It indicates that discoverers like young travelers will see the tourism risk as additional value to attract them to generate their motivation.
Obviously, this is a small amount of people. A destination with many risks will be not able to attract many visitors. If they come there, they also do not satisfy and feel unsafe. Therefore, the perceived risk has great influence on the satisfaction of customers.
2.3 RESEARCH MODEL
Many researchers have defined the satisfaction of customers as “the result of the interaction between perceived value and the expectation of customers of the destination” (Pizam, Neumann, Reichel, 1978 and Oliver, 1980).
Oliver (1980) assumed that the difference between the expected value and the perceived value about the way by which tourism affect customers’ feeling will decide satisfaction level. This definition might make the confusion between the satisfaction and the service quality. However, many researchers have affirmed that the satisfaction and the service quality are related to each other, but they are clearly different definitions (Bitner, 1990; Parasuraman et al., 1988; Baker & Crompton, 2000). They said that the service quality is the result in assessment of supplier, while the satisfaction is the feeling of customers when they contact or have transactions with suppliers.
According to Tribe & Snaith (1998), nowadays, there are four popular models to assess the satisfaction level. They are Important-Performance Analysis (IPA), SERVQUAL (Service Quality), HOLSAT (Holiday Satisfaction), and SERVPERF (Service Performance).
+ Holsat model (Holiday satisfaction)
Tribe and Snaith (1998) had developed and used the HOLSAT to assess the satisfaction in famous resort in Varadero, Cuba. This model measures the satisfaction of a customer with his trip experience of the destination, not specific service. Moreover, it does not use fixed list of all general attributes, but a list of particular specific ones. One important feature of the HOLSAT is to consider positive attributes as well as negative ones when it demonstrates primary attribute of a destination. Thus, a destination can be defined with a combination of both types of attributes.
The specialty of this model is the questionnaire in which the respondents will be asked to assess the expectation level of each holiday attribute (their impression before the holiday), and their experience or perception on the ground of the same set of attributes after the holiday. The Likert scale (5 options) is used to give score to each attribute both in “expectation” and in “perception”. The differences in the scores for each attribute will demonstrate the level of customer satisfaction.
The results are illustrated in a matrix whereby the scores of positive and negative attributes will appear in separated matrixes with the Perception (axis X) and the Expectation (axis Y). The “won” and “lost” regions are assigned by “line” – 45 degree diagonal one. “Won” represents attributes which consumers meet or exceed. “Lost” represents expectations of consumers that are not met. “Line” is the close combination of the perception and the expectation. Depending on positive or negative characteristics of attributes, the region “Won”, “Lost” will be on left side or on right side of the “Line”. The further the gap between points of attributes and the “Line” is, the greater the satisfaction or dissatisfaction levels of customers are. In case the point is on the “Line”, it means that the perception is not different from customers’ expectation. They are satisfied.
Some research models of the satisfaction of visitors:
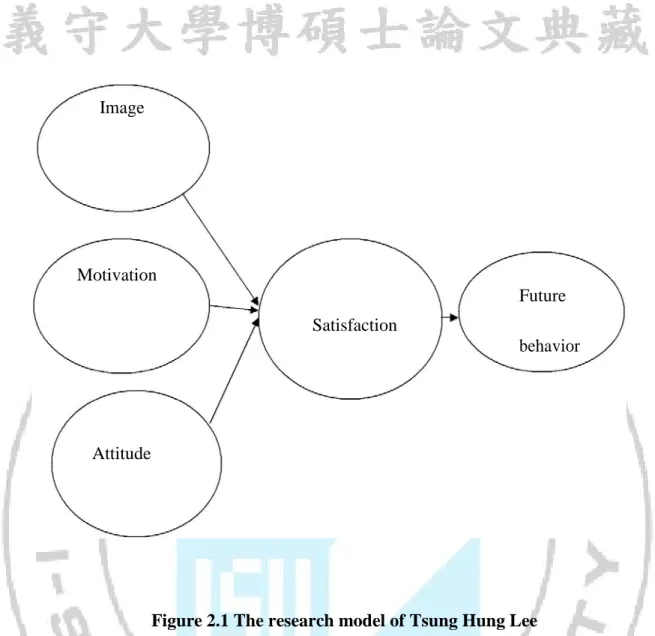
11 Image Motivation Future Satisfaction behavior Attitude
Figure 2.1 The research model of Tsung Hung Lee
The result of this research including image, motivation, attitude, the influence on the satisfaction and future behavior assumes that the destination image, tourism attitude and motivation have direct influence on the satisfaction and indirect influence on the behavior of customers in the future
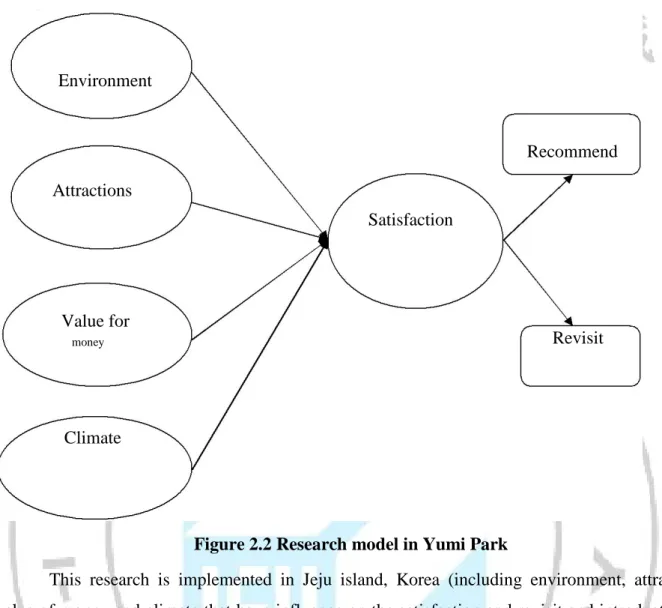
12 Environment Recommend Attractions Satisfaction Value for money Revisit Climate
Figure 2.2 Research model in Yumi Park
This research is implemented in Jeju island, Korea (including environment, attraction, value of money and climate that have influence on the satisfaction and revisit and introduction to other people). The result illustrates that:
Images of Jeju Island are assessed by four factors: “environment”, “attraction”, “value for money” and “climate”. Three factors including “environment”, “attraction”, and “value for money” have great influence on the satisfaction of customers. Moreover, the satisfaction has influence on the future behaviors. In general, respondents have positive attitude towards the island and they intend to recommend the island to other people.
13
Figure 2.3: Research model of Rita Faullant et al.
This research is implemented in Alpine ski resorts. The result demonstrated that the image of a ski destination is analyzed by three factors “luxury”, “family” and “fun”. They have strong interaction between the satisfaction and the image.
Image
Satisfaction
Perceived Risk
14
Image and perceived risk: A study of Uganda and its official tourism website. This research was implemented in Uganda, Africa (including the image and the perceived risk). The result demonstrates that before coming to Uganda, 99% of visitors say that they do not know or know a little about Uganda. 95% of visitors reckon its location in Africa. Africa seems to be considered as a dangerous destination. It is difficult to prove it false because there are wild animals in Africa. However, there is the culture which is considered as the Western originality to attract tourists. Therefore, Africa has established a website and other modern promotional materials to reduce the perceived risk and create a positive image in visitors’ eyes. If Africa can handle this aspect as the proposed research, probably they can reduce the perceive risk and improve the destination image.
Perceived Risk Satisfaction
Figure 2.5: Research model of Christine et al.
The research was implemented in China (the perceived risk has influences on the satisfaction). The result demonstrates that over 48% of participants have safe trip. 38.1% of those consider that China is not either “dangerous” or “safe”. 13.9% considers it as “dangerous” or “extreme dangerous” destination. From these comments, we know that whether customers are satisfied with China or not and they will have decisions in the future.
Depending on the different locations, each author chooses the variables which are related to the satisfaction of customers. Here, the author of the thesis can see a very important feature of Vietnam in general and of Nha Trang City in particular. It is the political stability, good security and safety. Besides, Nha Trang has warm weather and does not have the influence of the disaster. In addition, the local people are hospitable and a beautiful long beach is suitable for tourism, especially for relaxation tourism. For these reasons, the author decides to use “the perceived risk” and “the destination image” for the research model.
The proposed research model:
The hypotheses:
H1: The infrastructure and entertainment have positive effect on customer satisfaction. H2: The attractive destination has positive effect on customer satisfaction.
H3: The perceived risk has negative effect on customer satisfaction.
Thus, the hypotheses demonstrate that the one-way effect of independent variables (the infrastructure and entertainment, the attractive destination and the perceived risk) on dependent ones (the satisfaction of customers).
Conclusion:
In this chapter, the author presents the theoretical foundation related to the satisfaction and builds the proposed research model of customer satisfaction in Nha Trang. The next Chapter 3 illustrates the research methods.
Perceived Risk Attractive Destination Infrastructure Satisfaction 15
CHAPTER 3 RESEARCH METHODS
Chapter 2 demonstrates the theoretical foundation and proposes research models with hypotheses. This Chapter aims at introducing about the research methods to assess measurement scales of research concepts, model testing and hypotheses for research, examine the satisfaction of customers through analysis of collected data by SPSS Software.
This research is implemented by quantitative method through direct interview with international visitors in Nha Trang. The sample size in this research is 180 visitors. The objective of this research is to test the proposed theoretical model and to measure factors which affect customer satisfaction with Nha Trang.
3.1 METHODOF DATA COLLECTION
− Secondary data regarding the number of visitors over the years from 2012 - 2014, the length of stay and revenue was collected via Internet, Khanh Hoa tourism press.
− Primary data was collected by distribution of questionnaires to 180 international visitors. The convenience sampling method is used.
3.2 DATA ANALYZING METHOD + The 5-point Likert scale
The scales are classified into five categories: Totally agree; Agree; Normal (neither disagreeing nor objectionable); Disagree and Totally disagree
This scale was proposed by Rennis Likert with 5 popular levels. Typical questions of this type of scales are:
“Please read carefully following statements. After each statement, please circle the correctanswer that best represents your opinion. Please tell us that you totally agree, agree, feel neutral, disagree, and totally disagree for each statement?”
The 5-point scalesmay become 3 or 7-point scales represent the “agree or disagree”, “accept or not accept”, “acceptance or rejection”, “excellent or bad”, however, the principle is unchanged. All of them are called the Likert scale.
The building method of the Likert scale is to make a list of the parts that can be measured for the concept and to gather the sections of questionnaire to measure the different aspects of the concept. If the concept refers to the single aspect, the scale only seeks one set of section. If the concept covers the multi-aspect, it needs to have many sets of sections.
To build and test this measurement scale, it is necessary to implement following steps: (1) Identifying and naming variables that you would like to measure
(2) Making a list of comments or questions which are representative (3) Defining quantity and types of answers
(4) Checking all sections of questionnaire which are answered
(5) Analyzing all questionnaires to make a set of these to build a single measurement scale that you would like to measure
(6) Applying the above measurement scale to ensure its reliability + The method of multiple correlation regression analysis:
- The multiple correlation regression analysis is an advantage technique. It is the type of analysis of multivariate regression model under general form:
Y = f(Xi)
- Of which, Y is dependent variable, Xi = X1, X2, X3, X4… are independent ones. If the relationship is non-linear, the multiple linear regression function will be:
Y = A1X1 + A2X2 + A3X3 + … + AnXn + B
- If it is the non-linear relationship, it is normally manifested in a variety of forms such as exponential form... In case of the non-linear function; it may be the logarithmic form of straight line.
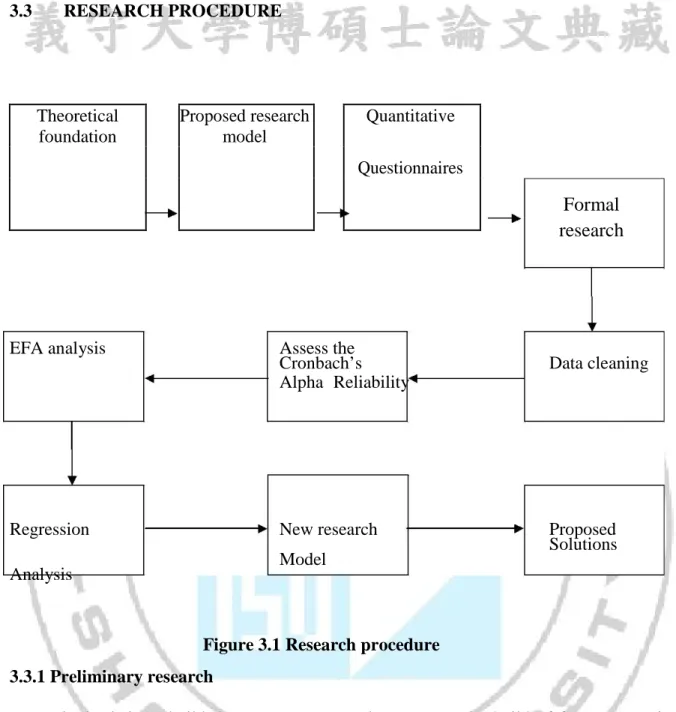
18 3.3 RESEARCH PROCEDURE Theoretical foundation Proposed research model Quantitative Questionnaires
EFA analysis Assess the
Cronbach’s Data cleaning Alpha Reliability
Regression New research Proposed Solutions Model Analysis
Figure 3.1 Research procedure 3.3.1 Preliminary research
Firstly, it is to build the measurement scale. It means the build of factors (or criteria) to assess the satisfaction and observed variables (questions) in each criteria. Based on the theoretical foundation, we can present the proposed research model with 4 factors/components and 25 observed variables. They include (1) the attractive destination measured by 11 observed variables, (2) the infrastructure and entertainment measured by 5 observed variables, (3) the perceived risk measured by 5 observed variables, (4) the satisfaction which is unidimensional constructs with 4 observed variables in order to measure the concept of customer satisfaction with Nha Trang. All measurement scales are measured by the 5-point Likert scale from level 1: totally disagree to level 5: totally agree.
Formal research
Then, the qualitative research method is applied (in-depth interview– structured interview) by interviewing 180 international visitors following the interview questions (see Appendix 1).
The variables which are used in interview questions are:
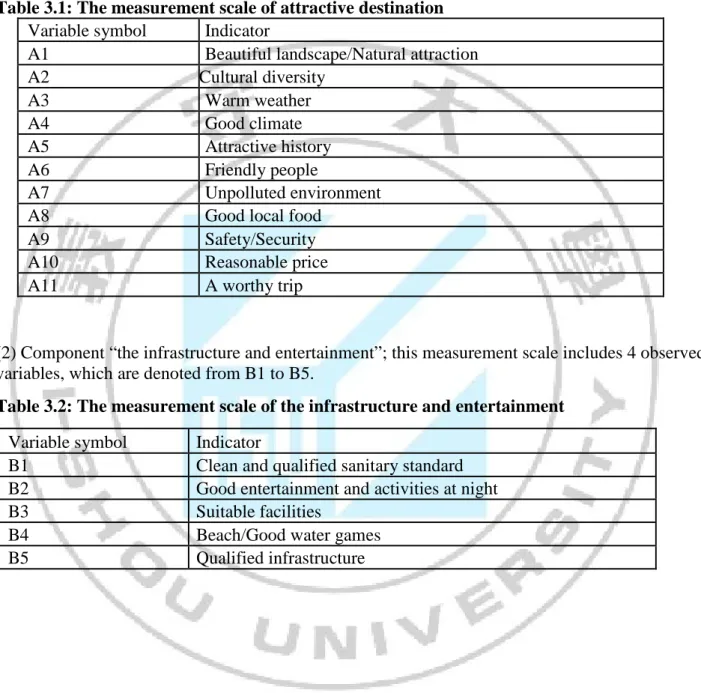
(1) Component “the attractive destination.” This measurement scale includes 11 observed variables, which are denoted from A1 to A11.
Table 3.1: The measurement scale of attractive destination
Variable symbol Indicator
A1 Beautiful landscape/Natural attraction A2 Cultural diversity A3 Warm weather A4 Good climate A5 Attractive history A6 Friendly people A7 Unpolluted environment A8 Good local food
A9 Safety/Security A10 Reasonable price A11 A worthy trip
(2) Component “the infrastructure and entertainment”; this measurement scale includes 4 observed variables, which are denoted from B1 to B5.
Table 3.2: The measurement scale of the infrastructure and entertainment
Variable symbol Indicator
B1 Clean and qualified sanitary standard B2 Good entertainment and activities at night B3 Suitable facilities
B4 Beach/Good water games B5 Qualified infrastructure
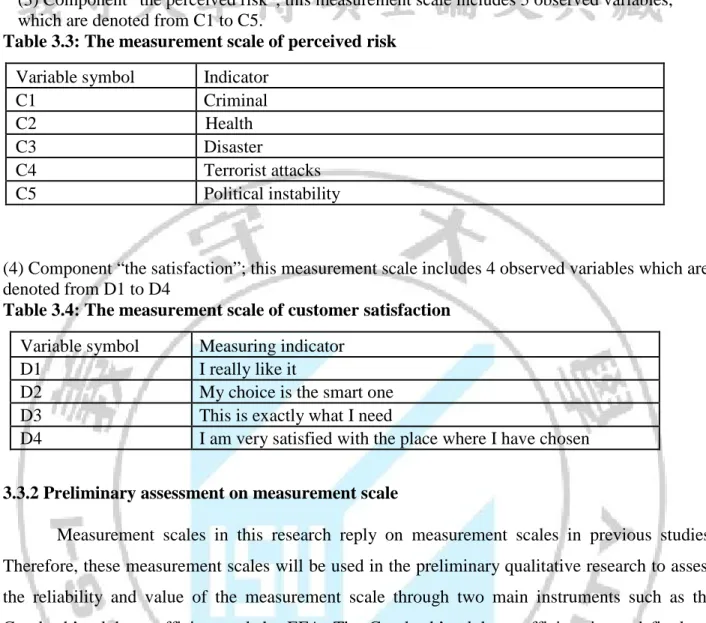
(3) Component “the perceived risk”; this measurement scale includes 5 observed variables, which are denoted from C1 to C5.
Table 3.3: The measurement scale of perceived risk
Variable symbol Indicator C1 Criminal C2 Health C3 Disaster
C4 Terrorist attacks C5 Political instability
(4) Component “the satisfaction”; this measurement scale includes 4 observed variables which are denoted from D1 to D4
Table 3.4: The measurement scale of customer satisfaction
Variable symbol Measuring indicator D1 I really like it
D2 My choice is the smart one D3 This is exactly what I need
D4 I am very satisfied with the place where I have chosen
3.3.2 Preliminary assessment on measurement scale
Measurement scales in this research reply on measurement scales in previous studies. Therefore, these measurement scales will be used in the preliminary qualitative research to assess the reliability and value of the measurement scale through two main instruments such as the Cronbach’s alpha coefficient and the EFA. The Cronbach’s alpha coefficient is used firstly to remove mismatch variables. The item-total correlation which is less than 0.30 will be deleted and the standard for choosing the measurement scale is when the reliability is greater than 0.60 according to the Cronbach’s alpha coefficient. The next is the EFA. The factor loading which is less than 0.5 in the EFA will be deleted continuously.
The method of deduction coefficient used is principal components with perpendicular rotation and stop point when extracted factors of eigenvalue = 1. The measurement scale is accepted when total variance explained is or higher than 50%, c and the factor loading are from 0.5 and above.
3.4 INTRODUCTION OF FORMAL STUDY
Formal quantitative research samples are selected by the convenience sampling method with sample size n = 180 for observation. Primary method of data analysis is the Exploratory
Factor Analysis (EFA) and the regression analysis. To achieve the reliability for these analyses, sample is large normally (n ≥ 200; Hoelter, 1983 cited in Nguyen Dinh Tho & Nguyen Thi Mai Trang, 2009). On the other hand, in fact, researchers normally use the experience rule to define the size of sample for corresponding method of analysis.
According to Bollen (1989, cited in Nguyen Dinh Tho & Nguyen Thi Mai Trang, 2009) every variable for observation needs to be collected as 5 at least. Thus, this formal study needs at least 25 x 5 = 125 samples. In fact, it needs 180 samples because during the interview with visitors, the author had difficulty in asking visitors to complete the questions.
Collected data will be encoded, cleaned and analyzed by SPSS 16.0 software with these steps:
1/ making all data clear
2/ describing attributes of sample
3/testing the reliability of factors through Cronbach’s alpha coefficient 4/ Factor analysis
5/ Regression analysis
Conclusion:
This Chapter performs the research methods to assess measurement scale of research concepts and theoretical models. The next Chapter presents the data analyzing method and researching outcomes which include the examination of research hypotheses by the regression analysis.
CHAPTER 4
RESEARCH RESULTS
4.1 INTRODUCTION
Chapter 3 represents the research methods to evaluate the scales. The purpose of Chapter 4 is to show results of the scale evaluation by the Cronbach’s alpha together with EFA and test the research hypotheses via the regression analysis.
4.2 RESULT OF THE QUANTITATIVE ANALYSIS
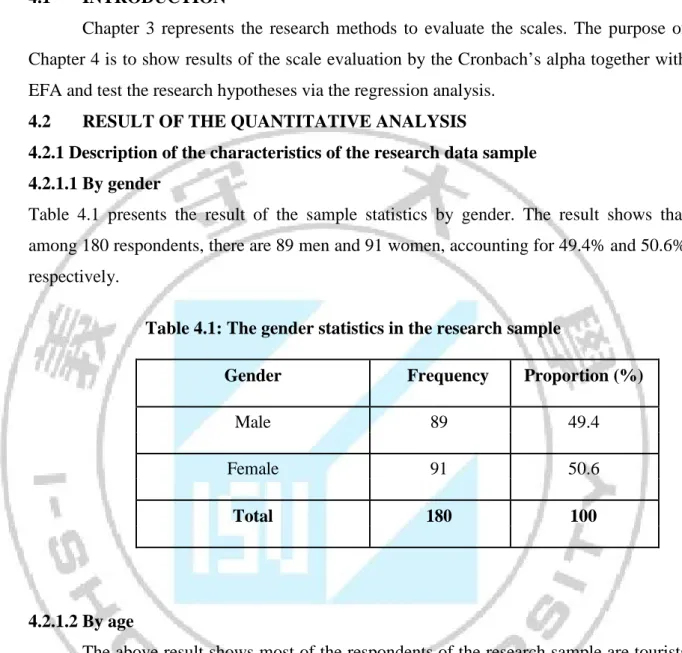
4.2.1 Description of the characteristics of the research data sample 4.2.1.1 By gender
Table 4.1 presents the result of the sample statistics by gender. The result shows that among 180 respondents, there are 89 men and 91 women, accounting for 49.4% and 50.6% respectively.
Table 4.1: The gender statistics in the research sample
Gender Frequency Proportion (%)
Male 89 49.4
Female 91 50.6
Total 180 100
4.2.1.2 By age
The above result shows most of the respondents of the research sample are tourists from 18 to 30 years old. This is basically reasonable because this survey has been conducted in the summer or holidays. Therefore, these occasions are suitable for people in this group of age.
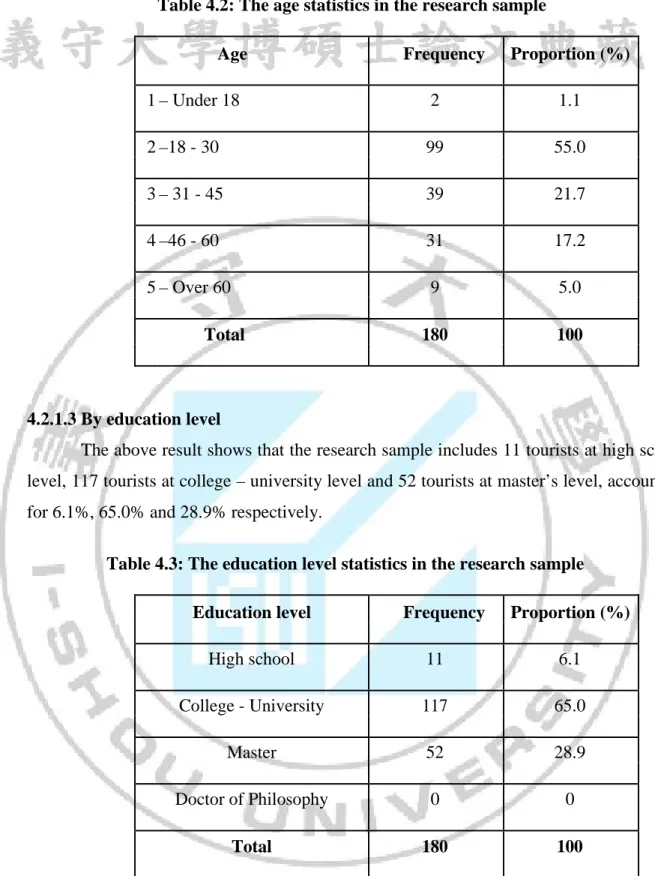
Table 4.2: The age statistics in the research sample
Age Frequency Proportion (%)
1 – Under 18 2 1.1 2 –18 - 30 99 55.0 3 – 31 - 45 39 21.7 4 –46 - 60 31 17.2 5 – Over 60 9 5.0 Total 180 100 4.2.1.3 By education level
The above result shows that the research sample includes 11 tourists at high school level, 117 tourists at college – university level and 52 tourists at master’s level, accounting for 6.1%, 65.0% and 28.9% respectively.
Table 4.3: The education level statistics in the research sample Education level Frequency Proportion (%)
High school 11 6.1 College - University 117 65.0 Master 52 28.9 Doctor of Philosophy 0 0 Total 180 100 4.2.1.4 By occupation
The above result shows that the research sample includes tourists who mainly are students, followed by specific occupation, manager, retiree, staff and housewife and others, accounting for 43.3%; 18.9%; 16.7%; 4.4%; 1.7% and 15% respectively.
Table 4.4: The education level statistics in the research sample Occupation Frequency Proportion (%) Manager 30 16.7 Staff 3 1.7 Housewife 1 0.6 Student 78 43.3
Specific occupation (doctor, 34 18.9 teacher, etc.)
Retiree 8 4.4
Others 26 14.4
Total 180 100
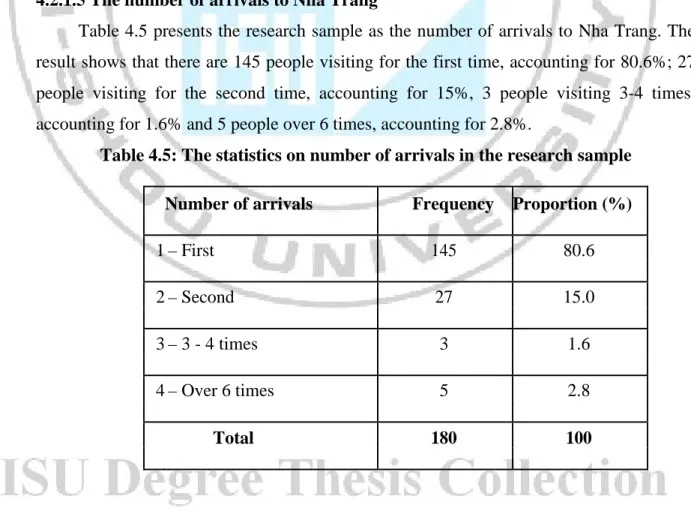
4.2.1.5 The number of arrivals to Nha Trang
Table 4.5 presents the research sample as the number of arrivals to Nha Trang. The result shows that there are 145 people visiting for the first time, accounting for 80.6%; 27 people visiting for the second time, accounting for 15%, 3 people visiting 3-4 times, accounting for 1.6% and 5 people over 6 times, accounting for 2.8%.
Table 4.5: The statistics on number of arrivals in the research sample
Number of arrivals Frequency Proportion (%)
1 – First 145 80.6 2 – Second 27 15.0 3 – 3 - 4 times 3 1.6 4 – Over 6 times 5 2.8 Total 180 100 24
4.2.1.6 Duration of stay in Nha Trang
The result shows that there are a highest proportion of tourists who stay in Nha Trang for 3 - 5 days with 144 people, accounting for 80%. It is followed by the number of tourists who stay for 1 week with 17 people, accounting for 9.4%. The number of those who stay for 1 - 2 days and more than 1 week, accounting for 6.7% and 3.9%, respectively.
Table 4.6: The statistics on tourists’ duration of stay in Nha Trang Duration of stay Frequency Proportion (%)
1 –1 - 2 days 12 6.7 2 – 3 - 5 days 144 80.0 3 – 1 week 17 9.4 4 – Over 1 week 7 3.9 Total 180 100
4.2.1.7 By the number of those who accompany tourists
The result shows that the majority of tourists are accompanied by friends, with 93 people, accounting for 51.6%, followed by the number of those who go alone, accounting for 30.6%. The number of those who go with their families accounts for 15.6% and the number of those who go with groups accounts for 2.2%.
Table 4.7: The statistics of the number of those who accompany tourists Number of people Frequency Proportion (%)
1 – Alone 55 30.6 2 – Business Partner 0 0 3 – Family 28 15.6 4 – Friends 93 51.6 5 – Group 4 2.2 Total 180 100 25
4.2.1.8 Annual income
The result shows that the majority of travelers are those whose income from 25,000 to 49,999 USD, followed by those who earn 50,000 - 79,999 USD, 80,000 - 99,999 USD, less than 25,000 USD and higher than 100,000 USD, accounting for 51.1%, 33.9%, 7.2%, 4.4%, and 3.3% respectively.
Table 4.8: The statistics of tourists’ annual income
Annual income Frequency Proportion (%)
1 – Under 25,000 USD 8 4.4 2 – 25,000-49,999 USD 92 51.1 3 – 50,000-79,999 USD 61 33.9 4 – 80,000-99,999 USD 13 7.2 5 – Over 100,000 USD 6 3.3 Total 180 100 4.2.1.9 Nationality:
According to the result, the travelers coming from Europe make up the highest proportion of 80%, followed by those who come from Americas and Asia, accounting for 12.2% and 7.8%, respectively.
Table 4.9: The nationality statistics
Nationality Frequency Proportion (%)
1 –European 144 80.0 2 –Asian 14 7.8 3 –American 22 12.2 Total 180 100 26
4.2.1.10 How to know Nha Trang:
According to the result, the majority of travelers know about Nha Trang through advertisement, brochures and tourist guidebooks (86%), followed by Internet (66.1%), travel agencies (42.2%), word of mouth (19.4%) and the last trip and others (7.7%). Because tourists can make more than one selection to this question, the proportion can be exceeded 100%.
Table 4.10: The statistics of the ways tourists know about Nha Trang Source Frequency Proportion (%)
1 – The last trip 9 5 2 – Travel agency 76 42.2 3 – Advertisement, 156 86.6 Tourist guidebooks 4 – Internet 119 66.1 5 – Word of mouth 35 19.4 6 – Others 5 2.7
4.3 EVALUATING THE RELIABILITY OF THE SCALES BY CRONBACH’S ALPHA
In this research, the author evaluates the reliability of the scales in the sample size n = 180 to affirm the appropriateness of the scales of research concepts. The Cronbach’s alpha analytical results of the scales are presented in the Table 4.11.
The result shows that most of the scales are qualified because the observed variables of the scales have the corrected item-total correlation greater than 0.3 and the Cronbach’s alpha coefficient greater than 0.6. However, there are 5 variables with Cronbach’s alpha coefficient greater than 0.6 and the corrected item-total correlation less than 0.3 including A1, A2, A3, A4, and B4. Therefore, these 5 variables are eliminated from the scales.
Table 4.11 The Cronbach’s Alpha result of the scales
Observed variable Scale mean Scale Corrected Item - Cronbach’s variance Total Correlation Alpha
Attractive destination: Cronbach’s Alpha = 0.734
A1 41.42 15.888 .233 .733 A2 41.63 14.894 .259 .718 A3 41.25 15.987 .187 .740 A4 41.43 16.190 .209 .735 A5 41.97 13.871 .476 .699 A6 41.58 14.289 .569 .690 A7 41.93 14.320 .340 .724 A8 41.64 14.824 .440 .707 A9 41.72 14.171 .571 .689 A10 41.79 14.175 .458 .703 A11 41.63 15.463 .378 .716
Infrastructure and entertainment: Cronbach’s Alpha = 0.698
B1 16.26 4.839 .579 .654
B2 16.13 4.693 .585 .621
B3 15.99 5.670 .459 .648
B4 15.66 6.998 .178 .735
B5 16.30 4.982 .466 .646
Perceived Risk: Cronbach’s Alpha = 0.788
C1 7.79 6.648 .531 .761
C2 7.81 6.344 .647 .721
C3 7.56 6.293 .597 .738
C4 8.20 7.010 .580 .746
C5 8.29 7.335 .484 .773
Satisfaction: Cronbach’s Alpha = 0.866
D1 13.01 4.123 .596 .875
D2 13.06 3.544 .716 .830
D3 13.16 2.836 .822 .786
D4 13.06 3.338 .765 .809
Table 4.12 The Cronbach’s Alpha result of the scales after eliminating the variables
Observed variable Scale mean Scale Corrected Item - Cronbach’s variance Total Correlation Alpha
Attractive destination: Cranach’s Alpha = 0.752
A5 24.26 9.836 .399 .754 A6 23.87 10.257 .463 .740 A7 24.26 8.998 .538 .723 A8 24.13 8.619 .586 .711 A9 24.00 9.922 .455 .741 A10 24.08 9.775 .448 .742 A11 23.92 10.273 .536 .731
Infrastructure and entertainment: Cronbach’s Alpha = 0.735
B1 11.83 4.065 .597 .633
B2 11.70 3.887 .617 .619
B3 11.57 4.917 .449 .716
B5 11.87 4.268 .457 .719
Perceived risk: Cronbach’s Alpha = 0.788
Risk1 7.79 6.648 .531 .761 Risk2 7.81 6.344 .647 .721 Risk3 7.56 6.293 .597 .738 Risk4 8.20 7.010 .580 .746 Risk5 8.29 7.335 .484 .773
Satisfaction: Cronbach’s Alpha = 0.866
Sat1 13.01 4.123 .596 .875 Sat2 13.06 3.544 .716 .830 Sat3 13.16 2.836 .822 .786 Sat4 13.06 3.338 .765 .809
After eliminating the unsatisfactory variables, we can see that the Cronbach’s alpha analytical result of the destination is higher than it was and the scales of the concepts presented in Table 4.12 are qualified because the observed variables of all the scales have the Corrected Item -Total Correlation greater than 0.3 and the Cronbach’s alpha coefficient greater than 0.6.
4.4 EXPLORATORY FACTOR ANALYSIS EFA
The result of the reliability evaluation through the Cronbach’s Alpha coefficient above indicates that most of the scales are qualified. After that, the scales are assessed by the exploratory factor analysis EFA. EFA is used simultaneously for all the research concepts because the formal research has the large sample size (n = 180) which is reliable enough to conduct EFA. This way ensures the appropriateness of EFA because it is actually the method for the correlation and scale evaluation of this concept in its relationship with the scales of other concepts. In the exploratory factor analysis (EFA), the author uses the principal components extraction with the varimax rotation.
When conducting EFA, we should consider a number of criteria to ensure that EFA is suitable. Firstly, KMO indicator is used to evaluate the appropriateness of EFA, if 0.5 ≤ 1 ≤ KMO, the factor analysis is appropriate. The Bartlett’s test considers the hypothesis H0: correlation coefficient of the observed variables equals to zero in general. If this test has the statistical significance (sig < 0.05), the observed variables have the correlation in general (Hoang Trong & Chu Nguyen Mong Ngoc, 2005).
After we implement the analysis, the result shows the variance extracted and the component matrix rotation in the KMO table as follows:
Table 4.13: KMO and Bartlett’s test
Kaiser-Meyer-Olkin Measure of Sampling Adequacy. 0.757 Bartlett's Test of Sphericity Approx. Chi-Square 1.476E3
Df 190
Sig. .000
The result in Table 4.13 shows the significance of Bartlett’s test = 0.000 <0.05. It indicates that the observed variables are correlated with each other overall. KMO indicator = 0.757 demonstrates that the factor analysis is appropriate for the data.
Table 4.14: Total variance explained
Extraction Sums of Rotation Sums of Squared Com
pone nt
Initial Eigenvalues Squared Loadings Loadings
% of Cumulative % of Cumulative % of Cumulative % Total Variance % Total Variance % Total Variance
1 4.910 24.548 24.548 4.910 24.548 24.548 3.062 15.309 15.309 2 2.946 14.729 39.278 2.946 14.729 39.278 2.340 11.702 27.011 3 2.104 10.520 49.797 2.104 10.520 49.797 2.191 10.956 37.967 4 1.312 6.562 56.359 1.312 6.562 56.359 2.045 10.223 48.190 5 1.170 5.851 62.210 1.170 5.851 62.210 1.970 9.850 58.040 6 1.036 5.182 67.392 1.036 5.182 67.392 1.870 9.352 67.392 7 .929 4.644 72.035 8 .859 4.295 76.330 9 .721 3.604 79.934 10 .690 3.450 83.384 11 .503 2.517 85.902 12 .439 2.193 88.095 13 .420 2.100 90.195 14 .385 1.923 92.118 15 .354 1.769 93.887 16 .304 1.521 95.408 17 .286 1.431 96.839 18 .246 1.229 98.068 19 .239 1.193 99.262 20 .148 .738 100.000
The result in Table 4.14 indicates that the total variance of components (6 factors) extracted from 20 observed variables (including 3 components: destination, perceived risk and satisfaction) has the eigenvalue = 1.036 and the variance extracted (eigenvalues cumulative %) = 67.392%. Therefore, 67.392% of the variance of the data is explained by 6 factors. The total variance extracted is over 50% (from 60% and higher is good). Consequently, the EFA is suitable.
Table 4.15: The rotated factor matrix Factor 1 2 3 4 5 6 D3 .912 D 4 .857 D 2 .773 D 1 .732 A 7 .650 A 9 .640 .614 A 5 .610 A 8 .579 A 6 .570 B 2 .809 B 1 .743 B 3 .613 B 5 .521 C 5 .882 C 4 .881 C 3 .599 .541 C 1 .885 C 2 .864 A 10 .791 A 11 .725
We can see that the attractive destination 9 and perceived risk 3 appear twice in the table of the factor loading. Therefore, we will eliminate the smaller ones so that the data table will satisfy conditions.
Table 4.16: The rotated factor matrix after eliminating the smaller factor loadings Factor 1 2 3 4 5 6 D3 .912 D4 .857 D2 .773 D1 .732 A7 .650 A9 .640 A5 .610 A8 .579 A6 .570 B2 .809 B1 .743 B3 .613 B5 .521 C5 .882 C4 .881 C3 .599 C1 .885 C2 .864 A10 .791 A11 .725
Table 4.16 represents the result of the rotated factor matrix. We can see that there are 6 factors extracted after rotating factors by PCA and varimax rotation. These extracted factors are not consistent with the original components of the scale. Therefore, the research concepts in this case do not reach the distinction.
When the observed variables of the scale components in the formal research model are compared, we can discover that two observed variables are not included in the scale components as in the research model. Therefore, names of the variables are edited to suit the factors. The first factor consists of 4 observed variables (D3, D4, D2 and D1), these observed variables are of the concept of tourist satisfaction; the second factor is the attractive destination including 5 observed variables (A5, A6, A7, A8 and A9); the third factor includes 4 observed variables (B1, B2, B3 and B5) which belong to the
infrastructure scale; the forth factor consists of 3 observed variables (C5, C4 and C3) adjusted as Objective risk; the fifth factor includes 2 observed variables (C1 and C2) adjusted as Subjective risk; and the sixth factor contains 2 observed variables (A15 and A16) adjusted as Perceived value. After the adjustment in terms of factors, these scales are appropriate.
The value factors after conducting EFA are calculated by the arithmetic mean of the measurement variables of the factors in the model for the regression analysis and ANOVA. These factors after multiplied are saved as the variables as follows:
- The factor “Satisfaction” is saved as the SHL variable.
- The factor “Attractive destination” is saved as the ĐĐHD variable. - The factor “Infrastructure” is saved as the CSHT variable.
- The factor “Objective risk” is saved as the RRKQ variable. - The factor “Subjective risk” is saved as the RRCQ variable. - The factor “Perceived value” is saved as the GTCN variable.
4.5 CALCULATING THE QUANTITY OF THE DESCRIPTIVE STATISTICS FOR THE OBSERVED VARIABLES
To assess the level of customer satisfaction of Nha Trang tourism, it is necessary to analyze the descriptive statistics of the observed variables. The figures of descriptive statistics show the preliminary result about the evaluation of tourists of Nha Trang tourism. The quantity used is the Mean and Standard Deviation (SD). In order to facilitate the review, we have some conventions as follows:
- Mean < 3.00: very low - 3.00 ≤ Mean ≤ 3.24: low - 3.25 ≤ Mean ≤ 3.49: average - 3.5 ≤ Mean ≤ 3.74: good - 3.75 ≤ Mean ≤ 3.99: good/high - Mean > 4.00: very good/very high
4.5.1. The descriptive statistics of the observed variables of the scales Table 4.17: Descriptive statistics of the scales
Observed variables
Sample
Minimum Maximum Mean
SD value value size D3 180 2 5 4.40 .613 D 4 180 2 5 4.37 .692 D 2 180 1 5 4.27 .845 D 1 180 1 5 4.39 .704 A 7 180 1 5 3.87 .930 A 9 180 2 5 4.08 .684 A 5 180 2 5 3.83 .845 A 8 180 1 5 4.16 .678 A 6 180 2 5 4.22 .662 B 2 180 1 5 3.83 .890 B 1 180 2 5 3.96 .926 B 3 180 2 5 4.09 .757 B 5 180 1 5 3.78 .959 C 5 180 1 4 2.10 .879 C 4 180 1 4 1.71 .773 C 3 180 1 4 1.62 .778 C 1 180 1 4 2.12 .913 C 2 180 1 4 2.36 .937 A 10 180 2 5 4.01 .802 A 11 180 2 5 4.17 .593
The analytical results of the descriptive statistics of the observed variables in the satisfaction scale show that tourist satisfaction is at very high level. It is also represented in the mean of the observed variables D1, D2, D3 and D4 which are 4.39, 4.27, 4.37 and 4.40 respectively. The results demonstrate that Nha Trang tourism has fully met the demands of travelers; however, it should be continuously improved in every aspect to increase the satisfaction of visitors.
The analytical result of the descriptive statistics of the observed variables in the attractive destination scale shows that tourists evaluate the attraction at good level. It is represented in the mean of the observed variables A7, A9, A5, A8 and A6, which are 3.87, 4.08, 3.83, 4.16 and 4.22 respectively. We can see that visitors are quite satisfied with Nha
Trang City. However, it should be improved the specialties, environment and security to get higher appreciation.
The analytical results of the descriptive statistics of the observed variables in the infrastructure scale show that tourists evaluate the infrastructure at good level. It is represented in the mean of the observed variables B2, B1, B3 and B5, which are 3.83, 3.96, 4.09 and 3.87 respectively. The results indicate that the hygiene, infrastructure and entertainment have basically met the demands of visitors. However, the mean is not really high. Therefore, it should be improved the quality of hygiene, infrastructure and entertainment centers and night activities.
The analytical results of the descriptive statistics of the observed variables in the objective risk scale show that tourists rate the political instability and disasters at less than 2.10, represented in the mean of the observed variables C5, C4 and C3 which are 2.10, 1.71 and 1.62 respectively. It indicates that visitors evaluate political instability and disasters at very low level. As a result, they feel assured when travel to Nha Trang.
The analytical result of the descriptive statistics of the observed variables in the scale of subjective risk show that tourists rate the risk of health and crime at low level, represented in the observed variables C1 and C2, which are 2.12 and 2.361 respectively. It indicates that visitors evaluate the risk of health and crime at low level. As a result, they feel assured when travel to Nha Trang.
The analytical result of the descriptive statistics of the observed variables in the scale of perceived value show that tourists have the perceived value at good level, represented in the mean of the observed variables A10 and A11, which are 4.01 and 4.17 respectively. The result show that visitors evaluate their trip to Nha Trang as valuable one and its prices is reasonable.
4.6 REGRESSION ANALYSIS AND TEST OF THE RESEARCH HYPOTHESES
4.6.1 Test of the correlation coefficient of the variables
Table 4.18: The matrix of the coefficient of correlation of the variables SHL GTC ĐĐH CSH RRK RRC N D T Q Q SHL Pearson 1 .400** .325** .219** -.035 -.190* Correlation Sig. (2-tailed) .000 .000 .003 .638 .011 N 180 180 180 180 180 180 GTCN Pearson .400** 1 .442** .396** .006 -.028 Correlation Sig. (2-tailed) .000 .000 .000 .940 .706 N 180 180 180 180 180 180 ĐĐHD Pearson .325** .442** 1 .532** -.118 -.054 Correlation Sig. (2-tailed) .000 .000 .000 .114 .472 N 180 180 180 180 180 180 CSHT Pearson .219** .396** .532** 1 -.067 -.080 Correlation Sig. (2-tailed) .003 .000 .000 .369 .288 N 180 180 180 180 180 180 RRKQ Pearson -.035 .006 -.118 -.067 1 .414** Correlation Sig. (2-tailed) .638 .940 .114 .369 .000 37
N 180 180 180 180 180 180 RRCQ Pearson .190* -.028 -.054 -.080 .414** 1 Correlation Sig. (2-tailed) .011 .706 .472 .288 .000 N 180 180 180 180 180 180
Table 4.18 demonstrates the test results of the coefficient of correlation of the variables in the research model. The results illustrate that the coefficient of correlation of the variables are less than 0.6. Consequently, it can be come into the preliminary conclusion that the independent variables do not have the high multicollinearity. Therefore, the assumption that there is no multicollinearity among the independent variables in the next regression analysis is qualified. The results also indicate that there exists a linear relationship between the satisfaction and perceived value, attractive destination, infrastructure and subjective risk variables because sig <0.05. The objective risk variable does not correlate with the satisfaction variable because sig = 0.638> 0.05. To identify them more clearly, we implement the regression analysis to evaluate the suitability of the research model.
4.6.2 The result of regression analysis
As mentioned above, after evaluating the scales by Cronbach’s alpha and EFA, the author uses the arithmetic mean method of the measurement variables (observed variables) towards the factors with the aim of conducting regression analysis. The analytical result of the multiple regression in this research has been implemented by using the statistical software SPSS 16.0 and the ordinary least squares estimation together with ENTER method (simultaneously) because the purpose of this research is to confirm and in the research, the author hypothesizes that the destination image and perceived risk have positive correlation with visitor satisfaction.
After conducting the regression analysis, the author tests the hypotheses of the linear regression model, especially the hypothesis of the normal distribution of residuals, multicollinearity and heteroscedasticity. The results show that the residuals comply with the normal distribution law, because the mean of residuals approximately equals to zero and the variance approximately equals to 1 (see Chart 4.19).
When checking by the chart (see chart 4.20) which describes the relationship between the standardized residual and the estimated value, we discover that the residuals evenly allocate around mean (mean of the residual is zero). Therefore, the heteroscedasticity does not appear in this regression model. As a result, after testing assumptions of the linear regression model, the results show that these assumptions are not violated. Consequently, the results of the regression model are reliable.
Table 4.19: Model summary
Model R R Square Adjusted R Square Std. Error of the Estimate
1 .494a .244 .222 .53617
a. Predictors: (Constant), RRCQ, GTCN, CSHT, RRKQ, ĐĐHD b. Dependent Variable: SHL
According to the results of the multiple regression analysis, the coefficient of determination R2 = 0.244 (≠ 0) and Adjusted R2 = 0.222. We realize that Adjusted R2 is smaller than R2 because the variable RRKQ - Objective risk does not explain further the variable SHL - Satisfaction.
Table 4.20: ANOVA Results
Sum of
Model Squares df Mean F Sig. Square 1 Regression 16.107 5 3.221 11.206 .000a Residual 50.021 174 .287 Total 66.129 179 a. Predictors: (Constant), RRCQ, GTCN,CSHT, RRKQ, ĐĐHD b. Dependent Variable: SHL
F-Test (Table of ANOVA analysis) shows sig. = 0.000. Thus, the regression
model is suitable. In other words, the independent variables such as attractive destination; infrastructure; objective risk; subjective risk and perceived value can explain approximately 22.2% of the variance of the dependent variable.
Table 4.21: Factors influencing tourist satisfaction
Unstandardized Standardized Coefficients Coefficients
Model Std.
B Error Beta t Sig.
1 (Constant) 1.976 .383 5.155 .000 ĐĐHD .206 .097 .174 2.123 .035 CSHT .008 .073 .009 .115 .049 RRKQ -.111 .065 -.124 -1.695 .092 GTCN .319 .073 .328 4.344 .000 RRCQ -.085 .052 -.253 -1.288 .003 a. Dependent Variable: SHL
The results in Table 4.21 show there are 5 factors that have influence on the satisfaction of tourists: attractive destination; infrastructure; perceived value, subjective risk and objective risk. If we compare the impact of these variables on the satisfaction of visitors, we can see that the standardized coefficients Beta of the variable ĐĐHD (attractive destination) is 0.174 (sig = 0.035 <0.1), the variable CSHT (infrastructure) is 0.009 (sig = 0.049 <0.1), the variable GTCN (perceived value) is 0.328 (sig = 0.000 <0.1), the variable RRCQ (subjective risk) is -0.253 (sig = 0.003 <0.1), and the variable RRKQ - objective risk is -0.124 (sig = 0.092 <0.1). In conclusion, the variable GTCN (perceived value) has the greatest influence on the satisfaction of tourists, followed by the variables of attractive destination, objective risk, subjective risk, and infrastructure. (There is a value of sig = 0.092> 0.05, so the author uses alpha = 0.1 to compare so that this variable can be appropriate to put into the research model).
The result shows that the relationship between the factors and the satisfaction level is presented via the standardized regression equation below:
SHL = 0.174ĐĐHD + 0.009CSHT – 0.124RRKQ + 0.328GTCN – 0.253RRCQ
The result of the regression analysis gives the same result as the descriptive statistics 40