L
Journal of Alloys and Compounds 266 (1998) 276–282
Room-temperature phases observed in Ti
532xNi Zr high-temperature
47 xshape memory alloys
*
S.F. Hsieh, S.K. Wu
Institute of Materials Science and Engineering, National Taiwan University, Taipei, Taiwan 106, Republic of China Received 29 June 1997
Abstract
Ti532xNi Zr47 x (x55|20 at %) shape memory alloys exhibit martensitic transformation characteristics and their transformation temperatures increase linearly with increasing Zr content. There are three different phases observed in 9008C homogenized alloys for Zr content $10 at %, including the grey (Ti,Zr)Ni matrix, the black (Ti,Zr) Ni particles and the white l phase. But only the former two2 1
phases are found in the Ti Ni Zr alloy. DTA test results show that the homogenized Ti Ni Zr48 47 5 38 47 15alloy has three endothermic peaks in the thermograph, in which the 9308C endothermic peak is associated with the solid↔liquid transition of l phase, the peak at 9908C is1
associated with the reverse peritectic transformation of (Ti,Zr) Ni2 →(Ti,Zr)Ni1liquid and the one at 11608C is the dissolution reaction of the (Ti,Zr)Ni→liquid. 1998 Elsevier Science S.A.
Keywords: Ti532xNi Zr shape memory alloys; (Ti,Zr)Ni phase; (Ti,Zr) Ni phase; l phase; Peritectic reaction47 x 2 1
1. Introduction temperatures above 1208C can be obtained in TiNiZr alloys with Zr content above 10 at % and Ni content below
1
Shape memory alloys (SMAs) with Ms temperature 49.5 at %. They also studied the microstructures of parent higher than 1008C have drawn much attention recently. It and martensitic phases in these alloys by optical and is well known that Ti Ni50 502yX ternary SMAs with X5y electron microscope and found (Ti,Zr) Ni precipitates exist2
Pd, Pt or Au have a Ms temperature much higher than in these alloys. In 1995, Meisner reported that (Ti,Zr) Ni ,2 7
1008C and exhibit an one-way shape memory effect [1–4]. (Ti,Zr) Ni7 10 and NiZr phases can be observed in Ni-rich However, the high cost of precious metals will limit the Ti502xNi Zr alloys with the Zr content in the range of50 x
practical applications of these SMAs. For this reason, other 30–50 at % at room temperature [8].
ternary TiNiX SMAs with lower costs need to be investi- For Ti-rich TiNi binary alloys, a peritectic reaction of gated. Among them, the most prospective candidates are liquid 1 TiNi→Ti Ni occurs during the solidification.2
TiNiZr and TiNiHf alloys with Zr and Hf being used to Therefore, a relatively large volume fraction of Ti Ni2
replace Ti in these alloys. particles forms in these alloys, which in turn affects the Eckelmeyer [5] showed that a small amount of Ti mechanical strength and formability of Ti-rich TiNi binary replaced by Zr in the Ti Ni50 50 alloy can raise the Ms alloys [9,10]. This peritectic reaction may also occur in temperature in TiNiZr SMAs. In 1990, Krupp et al. ternary TiNiZr alloys. However the effect of Zr content on
2
obtained a patent on TiNiZr SMAs with As temperature the characteristics of this peritectic reaction in ternary ranging from 1088C for 10.8 at % Zr to 1708C for 20.2 TiNiZr alloys is still not clarified. Furthermore, phases at % Zr [6]. In 1992, Mulder et al. [7] reported that the Ms other than (Ti,Zr) Ni in TiNiZr SMAs can also possibly2
form. Since the shape memory behaviour of a SMA is strongly dependent on its microstructure, it is important to
*Corresponding author. know what microstructural evolution occurred in this
1
Ms means the starting temperature of martensitic transformation, and
SMA. The aim of the present work is to investigate the
As means the starting temperature of reverse martensitic transformation.
2 characteristics of peritectic reaction associated with the
Ms means the starting temperature of martensitic transformation, and
As means the starting temperature of reverse martensitic transformation. (Ti,Zr) Ni phase in Ti-rich Ti2 532xNi Zr alloys with x547 x
0925-8388 / 98 / $19.00 1998 Elsevier Science S.A. All rights reserved.
5|20 at %. The observed phases excluding the (Ti,Zr) Ni2
in these Ti-rich TiNiZr alloys are also discussed in this study.
2. Experimental procedure
The conventional tungsten vacuum arc melting tech-nique was employed to prepare Ti532xNi Zr (x55, 10,47 x
15, 20 at %) alloys. The symbols Zr , Zr , Zr5 10 15 and Zr20
are hereinafter used to denote specimens of Ti Ni Zr ,48 47 5
Ti Ni Zr , Ti Ni Zr43 47 10 38 47 15 and Ti Ni Zr33 47 20 alloys, re-spectively. Titanium (purity: 99.9%), nickel (purity: 99.9%) and zirconium (purity: 99.8%), totalling about 100 g, were melted and remelted at least six times in an argon atmosphere. Pure titanium button was also melted and used as a getter. The mass loss during the melting was negligib-ly small. The as-melted buttons were homogenized holding at 9008C for 72 h and furnace-cooled. The homogenized buttons were cut into several plates with a low speed diamond saw. In order to identify phases, some of the cut plates were heated up to 9508C and 10008C, respectively, and then quenched in liquid nitrogen. The acquired speci-mens were polished for DSC / DTA measurements and EPMA examination.
DSC measurement was conducted by a Dupont 2000 thermal analyzer equipped with a quantitative scanning system 910 DSC cell for controlled heating and cooling runs on a sample encapsulated in an aluminum pan. The running temperature range was from 08C to 4008C with a
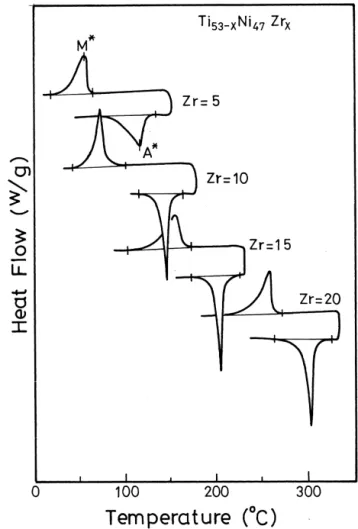
21 Fig. 1. DSC curves of homogenized Ti532xNi Zr (x55–20 at %) alloys47 x
heating / cooling rate of 108C min . The continuous
heat-in which M* and A* are peak temperatures of forward and reverse
ing experiments were conducted using a differential ther- martensitic transformations, respectively. mal analyzer (DTA) in which a bulk sample was analyzed
in an Al O crucible using a Dupont 2000 DTA under a2 3 508C to 3008C with increasing Zr content. Therefore, based
flowing purified argon atmosphere. The running tempera- on the results of Fig. 2, a TiNiZr SMA alloy with the ture range was from 8008C to 12508C with a heating rate desired transformation temperature can be obtained by
21
of 108C min . Microstructure observations employed carefully controlling its corresponding Zr content. The JEOL JXA-8600 SX EPMA, which was utilized to take the more detailed shape memory properties of Ti Ni Zr
532x 47 x
image, line-scanning profiles (LSPs) and quantitative chemical compositions. The EPMA was operated at 15 kV with a probe current 100 nA.
3. Experimental results and discussion
3.1. The transformation behaviours of Ti532 xNi Zr47 x shape memory alloys
Fig. 1 shows the experimental results of DSC measure-ments for the homogenized Zr , Zr , Zr5 10 15 and Zr20alloys, respectively, in both forward and reverse transformations. Peaks appearing in Fig. 1 are identified as being associated with the martensitic transformation of B2↔B199 [7]. The transformation peak temperatures versus Zr-content shown
in Fig. 1 is plotted in Fig. 2. From Fig. 2, it is clear that the Fig. 2. Transformation temperatures of A* and M* versus Zr content for
Table 1
alloys after different thermomechanical processes are
The compositional analyses for 9008C homogenized Ti532xNi Zr (x55–47 x
reported in other investigations [11].
20 at %) alloys
9008C372 h homogenized specimens (in at %)
3.2. The phases in homogenized specimens
Ti Ni Zr
Fig. 3a–d show the EPMA back-scattering electron Zr M 46.560.3 48.460.3 5.160.2
5
images(BEIs) of 9008C homogenized Zr , Zr , Zr5 10 15 and S1 62.360.3 32.860.3 4.960.2
S – – –
Zr20 alloys, respectively. Because the intensity of the 2
Zr10 M 42.160.3 48.460.3 9.560.3
back-scattering electron is proportional to the atomic
S1 58.460.4 32.960.3 8.760.4
number of the individual element in the illuminated area,
S2 43.860.3 36.860.4 19.460.3
the brighter areas in Fig. 3 indicate the regions of the Zr M 37.360.4 48.260.3 14.560.3
15
higher Zr content. On the contrary, the darker ones have S1 53.260.4 33.160.4 13.760.3 S 40.460.3 37.360.4 22.360.3
the higher Ti content. It is clear that there are three 2
Zr20 M 31.760.4 48.560.3 19.860.3
different contrast areas, including the grey matrix, the
S1 48.760.3 33.560.4 17.860.4
darker (i.e. black) particles and the brighter (i.e. white)
S2 37.860.3 37.560.3 24.760.3
ones, coexisting in the alloys of Zr content $10 at %, as
M: Matrix; S : Black precipitate; S : White precipitate.1 2
shown in Fig. 3b–d. Only black particles located around the grain boundaries appear in the Fig. 3a of Zr5 alloy.
Noted that the white particles in Fig. 3d are not so clear as the Zr20 alloy is smaller than that in the Zr10 and Zr15
those shown in Fig. 3b and c because the difference of Zr alloys, as shown in Table 1.
(at %) content between white particles and grey matrix in The chemical compositions of these particles and matrix
determined by the EPMA Wave Dispersed Spectrometer (WDS) are shown in Table 1. In Table 1, the ratio of (Ti1Zr) / Ni in the matrix, black particles and white ones are about 1, 2 and 1.7, respectively. Compared with the Ti–Ni binary phase diagram [12], the results of Table 1 indicate that the grey matrix in Fig. 3 is the (Ti,Zr)Ni phase and the black particles are the (Ti,Zr) Ni phase.2
Here, the Zr atoms replace Ti atoms in Ti532xNi Zr47 x
alloys due to the isomorphologic solid solution effects of Ti and Zr atoms in Ti–Zr binary phase diagram [13]. The white particles in Fig. 3 should be a new Ti–Ni–Zr ternary phase due to the lack of Ti1.7Ni phase in the Ti–Ni binary
diagram and Zr1.7Ni phase in Zr–Ni binary diagram [14]. Fig. 5. The 7008C Ti–Ni–Zr Eremenko’s isotherm diagram with some boundary shift of those domains near Ti Ni corner (indicated by the
In order to clarify the relations among these three phases, a 50 50
dotted lines) can be used to be the 9008C isotherm for Ti532xNi Zr47 x
further experiment is conducted in Section 3.3. In this
specimens.
experiment, only the Zr15 alloy is selected because the microstructural morphologies of Zr , Zr10 15 and Zr20 alloys
are very similar. clearly shows that the grey matrix, black and white Fig. 4 is the BEI with Ti, Ni and Zr line-scanning particles in Fig. 3 should be the d (TiNi-base B2 phase), h1
profiles for the Zr15 alloy homogenized at 9008C for 72 h. (Ti Ni-base phase) and l (TiNiZr ternary phase) phases,2 1
Note that the Ni concentration decreases in both black and respectively. In this analysis, we suggested that the 7008C white particles to almost the same extent. However, the Ti–Ni–Zr isotherm diagram near the Ti Ni50 50 corner is black particles have higher Ti and lower Zr contents than still suitable for the 9008C homogenized specimens except the white particles. The primary difference between the for a slight boundary shift of the domains h, h1d , h1l ,1 1
black and white particles is thus their Ti / Zr ratio. The d 1h1l , d 1l , l etc., as indicated in the broken lines1 1 1 1 1
compositional partition phenomena [15] of Ti and Zr in Fig. 5. elements in both particles is why they have a distinct
contrasting image in the observed microstructures of Figs.
3 and 4. 3.3. The DTA thermograph of Zr15 alloy and the
According to the 7008C Ti–Ni–Zr ternary isotherm characteristic of each phase
diagram proposed by Eremenko et al. [16], there is a
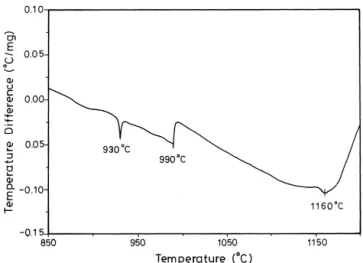
ternary l phase (Laves phase with MgZn type structure)1 2 In order to understand the characteristics of the above existing in the Ti–Ni–Zr ternary alloy system. Based on mentioned three phases, a DTA analysis was conducted on the data of Table 1, the average compositional loci of the homogenized Zr15 alloy, as shown in Fig. 6. In Fig. 6, phases existing in Fig. 3 can be plotted on a 7008C ternary three endothermic peaks appear at about 9308C, 9908C, Ti–Ni–Zr Eremenko’s isotherm, as shown in Fig. 5. Fig. 5 and 11608C, respectively. To understand the phase trans-formation related to each peak of Fig. 6, some specimens of Zr15 alloy were heated up to 9508C or 10008C. The experimental results are discussed as follows.
Fig. 4. The BEI with Ti, Ni and Zr line-scanning profiles for Ti Ni Zr38 47 15
3.3.1. The characteristic of l -phase1 9508C. Fig. 7b shows the Ti, Ni and Zr line-scanning In order to reveal which phase transition is associated profiles (LSPs) on the microstructure of Fig. 7a. Obvious-with the 9308C endothermic peak shown in Fig. 6, one ly, these elemental concentration profiles are very similar homogenized Zr15 specimen was heat-treated at 9508C for to those of the homogenized ones of Fig. 4. The com-2 h and then quenched in liquid nitrogen. The micro- position of the white particles detected by the EPMA WDS structure of this specimen observed by BEIs of EPMA is is consistent with that of l phase. Therefore, the phase1
shown in Fig. 7. As the specimen was heated to 9508C, it liquefied at 9508C should be the l phase and the 9308C1
was discovered that a small amount of liquid phase flowed endothermic peak occurring in Fig. 6 is associated with the out on this specimen’s surface, indicating that the 9308C solid↔liquid transition of l phase.1
phase transition involves a liquid phase reaction. There are some black (Ti,Zr) Ni particles that have been2
As seen in Fig. 7a, the (Ti,Zr)Ni grains have obviously trapped inside the (Ti,Zr)Ni grains, as shown by the single grown and they are larger than the as-homogenized ones arrows in Fig. 7a. This phenomenon is quite different from shown in Fig. 3c. In Fig. 7a, the morphology of the black that exhibited in 9008C homogenized specimens of Fig. (Ti,Zr) Ni particles remains unchanged just as the as-2 3(c) in which all particles are located around the (Ti,Zr)Ni homogenized ones. Only the white l1 particles change grain boundaries. It is speculated that these particles their morphology and spread out along (Ti,Zr)Ni grain trapped inside the (Ti,Zr)Ni grains and without contacting boundaries due to their changing into a liquid phase at the liquid phase were produced by the rapid moving velocity of (Ti,Zr)Ni grain boundary at a high temperature. The higher the heating temperature, the larger the growth rate of (Ti,Zr)Ni grains and the faster the moving velocity of (Ti,Zr)Ni grain boundaries. Thus, if the (Ti,Zr) Ni2
particles can not move in the same direction as the moving (Ti,Zr)Ni grain boundaries, they will be trapped inside the (Ti,Zr)Ni grains, as those mentioned above. Certainly, the liquid l1 phase can move rapidly due to its fluidity. Therefore, some of (Ti,Zr) Ni particles can move with the2
flowing liquid and then be confined locally at (Ti,Zr)Ni grain boundaries after the specimen has cooled down, as shown by the double arrows in Fig. 7a.
3.3.2. The characteristic of (Ti,Zr) Ni phase2
In order to clarify what reaction is associated with the 9908C endothermic peak of Fig. 6, another homogenized Zr15 specimen was heated at 10008C for 1.5 h and then quenched in liquid nitrogen. The microstructure of this specimen observed by BEIs of EPMA is shown in Fig. 8. In Fig. 8, the black particles have been proven by the EPMA WDS analysis to be the (Ti,Zr) Ni2 phase (Ti53.92Ni32.35Zr13.73). Obviously, there are two different morphologies of trapped black particles coexisting in Fig. 8a. One is the isolated black (Ti,Zr) Ni particles in the2
(Ti,Zr)Ni grain or in the l1 phase at (Ti,Zr)Ni grain boundaries, as shown by the single arrows in Fig. 8a. The other is the massive agglomerate of (Ti,Zr) Ni particles2
surrounded by a liquid phase, as shown by the double arrows in Fig. 8a.
By comparing with Figs. 7 and 8, it is known that the (Ti,Zr)Ni grains have grown more significantly at 10008C. In Fig. 8a, most of the isolated (Ti,Zr) Ni particles and the2
massive agglomerates of (Ti,Zr) Ni particles are trapped2
inside the giant (Ti,Zr)Ni grains. This is the major differ-ence in microstructures between the specimen held at 9508C for 2 h and that held at 10008C for 1.5 h, as seen in Figs. 7 and 8.
Fig. 7. (a) The EPMA back-scattering electron image, and (b) Ti, Ni and
According to the Ti–Ni binary phase diagram [12], there
Zr line-scanning profiles, of Ti Ni Zr38 47 15alloy heat-treated at 9508C for 2
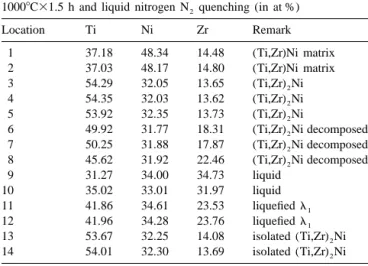
Table 2
The compositional analyses for Ti Ni Zr38 47 15 alloy heat-treated at 10008C31.5 h and then quenched in liquid nitrogen
10008C31.5 h and liquid nitrogen N quenching (in at %)2
Location Ti Ni Zr Remark 1 37.18 48.34 14.48 (Ti,Zr)Ni matrix 2 37.03 48.17 14.80 (Ti,Zr)Ni matrix 3 54.29 32.05 13.65 (Ti,Zr) Ni2 4 54.35 32.03 13.62 (Ti,Zr) Ni2 5 53.92 32.35 13.73 (Ti,Zr) Ni2 6 49.92 31.77 18.31 (Ti,Zr) Ni decomposed2 7 50.25 31.88 17.87 (Ti,Zr) Ni decomposed2 8 45.62 31.92 22.46 (Ti,Zr) Ni decomposed2 9 31.27 34.00 34.73 liquid 10 35.02 33.01 31.97 liquid 11 41.86 34.61 23.53 liquefied l1 12 41.96 34.28 23.76 liquefied l1 13 53.67 32.25 14.08 isolated (Ti,Zr) Ni2 14 54.01 32.30 13.69 isolated (Ti,Zr) Ni2
indicate the locations of compositional analyses by EPMA WDS. The acquired compositions are shown in Table 2. The last column of Table 2 also shows the corresponding phase of each location, estimated from the Ti–Ni–Zr ternary isotherm of Fig. 5 and the analytic results of Section 3.2. For examples, in Fig. 8b, the grey matrix ([1–[2), the black particles ([13–[14) and the
continu-ous white zone ([11–[12) are the (Ti,Zr)Ni phase,
(Ti,Zr) Ni phase and liquefied l phase, respectively. The2 1
black areas ([3–[5) and the grey ones ([6–[8) in the
agglomerate are still the (Ti,Zr) Ni phase with the former2
ones having a lower Zr% than the latter ones. The brightest location ([9–[10) showing much higher Zr% (about 32
at %) is also a liquid phase at 10008C and is distinguish-able from the liquefied l phase (1 [11–[12) in which the
Zr content is around 22 at %–23 at %, as indicated in
Fig. 8. (a) The EPMA back-scattering electron image, and (b) the
Tables 1 and 2.
locations of compositional analyses shown by arrows, for Ti Ni Zr38 47 15
alloy heat-treated at 10008C for 1.5 h and then quenched in liquid Based on the data of Table 2, the phases existing inside
nitrogen. the agglomerate do not include (Ti,Zr)Ni phase and all the
phases show a lower Ni content than their original ones in 9858C isotherm. Thus, we expected that (Ti,Zr) Ni par-2 Table 1. This feature indicates that the new (Ti,Zr)Ni ticles have decomposed into (Ti,Zr)Ni1Liq. by the reverse phase forms during the reverse peritectic reaction and it peritectic reaction when the specimen was held at 10008C grows on the interface of the original (Ti,Zr)Ni matrix. for 1.5 h. Fig. 8b clearly shows that several (Ti,Zr) Ni2 Meanwhile, the interdiffusion of Ti, Ni and Zr atoms particles have decomposed in an agglomerate. This feature among (Ti,Zr) Ni, (Ti,Zr)Ni and liquid phases during the2
indicates that the 9908C endothermic peak appearing in reverse peritectic reaction make the (Ti,Zr) Ni and liquid2
Fig. 6 is associated with the reverse peritectic reaction of phases decrease their Ti and Ni content but increase their (Ti,Zr) Ni2 →(Ti,Zr)Ni1Liq. However, there are still many Zr content, as seen with locations [6–[8 for the former
black (Ti,Zr) Ni particles retained in this agglomerate. It is2 and locations[9–[10 for the latter in Fig. 8b. In Fig. 8b,
reported that the time needed for the completion of the some isolated (Ti,Zr) Ni particles (2 [13–[14) do not
peritectic reaction is a function of the undercooling degree occur the reverse peritectic reaction even when the speci-and of the solute diffusion coefficient [17]. We suggest that men has been heated up to 10008C. From Table 1, it is this phenomena may also occur in the reverse peritectic known that the composition of (Ti1Zr) in (Ti,Zr) Ni2
transformation of (Ti,Zr) Ni particles which need a rather2 particles exhibit a small fluctuation (about 0.8 at %) which long time to fully decompose at 10008C due to the small makes different (Ti,Zr) Ni particles have different melting2
superheating in this study. points. We suggest that this compositional fluctuation in The numbers [1–[14 shown by arrows in Fig. 8b these particles accounts for the reason why some of
(Ti,Zr) Ni particles decomposed by the reverse peritectic2 Acknowledgements
reaction at 10008C, but the others do not decompose in
Fig. 8. The authors are pleased to acknowledge the financial The endothermic peak at 9908C is not as sharp as the support of this research by the National Science Council one at 9308C in Fig. 6 because the volume fraction (NSC), Republic of China under Grant NSC 86-2216-occupied by (Ti,Zr) Ni particles is less than that of l2 1 E002-033. The authors are also grateful to Mr. S. J. Lee, phase in Fig. 3(c) and the reverse peritectic reaction of Institute of Materials Science and Engineering, National (Ti,Zr) Ni may proceed gradually, not like the l phases2 1 Taiwan University, for his helpful discussion.
which can dissolve quickly at 9308C.
3.3.3. The characteristic of (Ti,Zr)Ni phase References
Concerning the endothermic peak appearing at 11608C
in Fig. 6, we suggest that it is the dissolution reaction of [1] V.P. Sivokha, V.N. Khachin, Fizika Metallovi Metallovedenie 62 (1986) 534.
the (Ti,Zr)Ni→Liquid. From a thermodynamic point of
[2] V.N. Khachin, N.M. Matveea, V.P. Sivokha, Doklady AN SSSR 257
view, the solid-soluted impurity will lower the melting
(1981) 167.
point of the original pure material. This phenomenon [3] V.P. Sivokha, A.S. Saviononv, V.N. Khachin, Fizika Metallovi should also occur in Zr soluted TiNi alloys, in which the Metallovedenie 56 (1983) 112.
melting point of TiNi is 13128C [12], but that of (Ti,Zr)Ni [4] S.K. Wu, C.M. Wayman, Metallography 20 (1987) 359. [5] K.H. Eckelmeyer, Scripta Metall. 10 (1976) 667.
is around 11608C.
[6] Krupp Gmbh, Essen, Patentschrift DE 4006076 CI, Fried, 1990. [7] J.H. Mulder, J.H. Mass, J. Beyer, ICOMAT, 1992, 869. [8] L. Meisner, V. Sivokha, J. Physique IV, 1995, C8–765.
4. Conclusion [9] H.C. Lin, S.K. Wu, J.C. Lin, Materials Chem. Phys. 37 (1994) 184. [10] H.F. Lopez, A. Salinas-Rodriguez, J.L. Rodriguez-Galicia, Scripta
metall. 34 (1996) 659.
1. Ti532xNi Zr (x55–20 at %) alloys exhibit martensitic47 x
[11] S.F. Hsieh, Ph.D. thesis, Institute of Materials Science and
Engineer-transformation characteristics, in which the DSC
trans-ing, National Taiwan University, Taipei, Taiwan, 1997.
formation peak temperatures increase linearly from [12] D.T. Hawkins, R. Hultgren, Alloy Phase Diagram, ASM Handbook, 508C to 3008C with increasing Zr content. Vol. 3 ASM International, OH, 1992, 2–319.
2. There are three different phases in 9008C homogenized [13] D.T. Hawkins, R. Hultgren, Alloy Phase Diagram, ASM Handbook, Vol. 3 ASM International, OH, 1992, 2–380.
Ti532xNi Zr alloys for Zr content $10 at %. They are47 x
[14] D.T. Hawkins, R. Hultgren, Alloy Phase Diagram, ASM Handbook,
the grey (Ti,Zr)Ni matrix, the black (Ti,Zr) Ni particles2 Vol. 3 ASM International, OH, 1992, 2–322.
and the white l phase. However, only the former two1 [15] E.W. Collings, The Physical Metallurgy of Titanium Alloys, ASM,
phases are found in the Ti Ni Zr alloy.48 47 5 Metals Park, OH, 1984, 9.
3. There are three endothermic peaks in the DTA thermog- [16] V.N. Eremenko, E.L. Semenova, L.A. Tret’yachenko, Doklady AN UKSSR, Ser A 2 (1988) 76.
raph of the homogenized Ti Ni Zr38 47 15 alloy. The
[17] H.F. Lopez, Acta Metall. 39 (1991) 1543.
peak at 9308C is associated with the solid↔liquid transition of l phase. The peak at 9908C is associated1
with the reverse peritectic transformation of (Ti,Zr) Ni2 →(Ti,Zr)Ni1Liq. The peak at 11608C is the dissolution reaction of (Ti,Zr)Ni→Liquid.