______________________________________ Transmitted by Associate Editor HJS Fernando ASME Reprint No AMR292 $14
Appl Mech Rev vol 53, no 8, August 2000 207 2000 American Society of Mechanical Engineers
Smoke propagation in road tunnels
Falin Chen
Institute of Applied Mechanics, National Taiwan University, Taipei, Taiwan 107, ROC
In tunnel fires, the most immediate threat to life is not the direct exposure to fire, but smoke inhala-tion. Efficient control of smoke propagation, therefore, is one of the most important issues in design-ing tunnel ventilation and a full understanddesign-ing of the characteristics of smoke propagation in tunnels is a necessity in order to proceed with a successful design. In the present article, we review the prog-ress of research on smoke propagation in tunnels, wherein the tests in full-scale tunnels, the nature of fire, the computational fluid dynamic-field model approach (CFD-FMA), and the Froude number preservation approach (FNPA) are discussed. The gravity current approach (GCA) is also developed to predict the smoke propagation behavior in tunnels and a CFD-FMA example is given from which the features of smoke propagation can be closely examined. The analytical results from FNPA indi-cate that, in the upstream of fire, the critical ventilation velocity is generally proportional to the one-third power of the heat release rate (HRR); some modifications to this power law are necessary for special cases. In the downstream of fire, the GCA results show that smoke propagates along the tun-nel with a constant speed, which is essentially linearly proportional to the ventilation velocity. The numerical results from CFD-FMA determine a safety domain in terms of the ventilation velocity and the HRR of fire. In view of rapidly increasing computational power, the CFD-FMA is becoming a major approach in studying smoke propagation in tunnels, while the GCA and FNPA are useful in engineering design. This review article includes 60 references.
1 INTRODUCTION
In road tunnels, an efficient ventilation system is one of the important criteria in the design process to ensure that adequate fresh air can be supplied to guarantee the health and safety of tunnel users. Among various considerations in the design of a ventilation system, to evacuate the smoke generated by tunnel fire is the most important issue to be attacked by engineers; it is also an inevitable, difficult task that the authority in charge must face. Three types of ventilation systems, in terms of dif-ferent mechanical equipment, are commonly employed. They are the longitudinal, the transverse, and the semi-transverse systems. The longitudinal system is equipped with a series of jet fans along the tunnel, pushing the air forward to exhaust it to the atmosphere while make up fresh air flows into the tun-nel. The transverse system comprises two independent me-chanical systems: one supplies fresh air and one extracts pol-luted air, both installed along the tunnel, respectively, above the ceiling and below the road level. The semi-transverse sys-tem is a combination of transverse and longitudinal syssys-tems. A longitudinal system has become popular for road tunnels, be-cause the piston effect due to moving vehicles provides a cost-free force to push air along the tunnel. Moreover, the progress of the high-performance jet fan technology has improved sub-stantially, which can be used to provide economic and high-efficiency fresh air supply and control. In fact, experiences with both tunnel fires and research results indicate that smoke control in longitudinal systems is effective and successful. This is the major issue to be discussed in the present article.
There is a growing risk of fire in tunnels, which increases because of burgeoning traffic density, increase of the speed of travel, increase of the length of modern tunnels, and worse still, the increase of risks for vandalism and terrorism at-tacks. Statistics [1] reveal that fire in roads occurs once in 10 million vehicle-kilometers traveled (about 20 to 25 times as high as in railway). Experiences from fires [2] have made in-delible imprints in our memories: for example, in 1949 the fire in the Holland Tunnel located between New York and New Jersey; in 1979 the Nihonzaka Tunnel of Japan; and in 1982 the Caldecott Tunnel in California. One of the most se-rious tunnel-fires in history happened on March 26, 1999. A truck carrying flour and margarine exploded and started a fire in the 11-km-long Mont Blanc Tunnel located on the border between France and Italy. The fire sustained for more than five days and hot air and toxic smoke killed at least 40 people, with some of the bodies charred and unidentifiable. Experience shows that the most immediate threat to life is not the direct exposure to fire, but the smoke inhalation. Moreover, low visibility due to thick smoke creates danger to the fire fighters, hindering prompt emergency evacuation. Therefore, deriving proper and efficient ventilation schemes to control the propagation of smoke in modern road tunnels is an absolute necessity.
It has recently been shown that an optimized ventilation for fire safety in tunnels may not necessarily be associated with a strong ventilation flow. Under strong ventilation, the hot smoke front tends to mix with surrounding cold fresh air, thus endangering the tunnel users downstream. A typical
scenario of smoke control in the longitudinal system can be described as follows. When a fire emergency is alarmed, the system provides fresh air from the upstream of the fire, cre-ating a smoke-free zone in the upstream, allowing the fire services to move to the scene (see Fig 1). In the downstream, the ventilation keeps the smoke moving forward as a stably stratified flow while attached to the ceiling, leaving another smoke-free zone above the road surface for the tunnel users. In the upstream of fire, the critical velocity beyond which the fire-induced buoyant flow (or back-layering) is stopped moving against the ventilation flow is a major criterion to be identified in tunnel designs. In the downstream of fire, to maintain a well-stratified smoke layer propagating along the tunnel is a desired goal for ventilation design.
Analyzing the smoke propagation along ventilation flow is by no means an easy task because physical mechanisms in-volved are extremely complex. The interactions between myriad processes related to mechanisms such as combustion, fluid dynamics, thermodynamics, and heat and mass transfer, are very difficult to handle either experimentally or analyti-cally. To date, various approaches such as the computational fluid dynamic-field model approach (CFD-FMA), the Froude number preservation approach (FNPA), and, more recently, the gravity current approach (GCA) to simulate the stratified layering have been developed. All these approaches will be discussed in this paper. Also discussed is the progress on the fire tests in full-scale tunnels and the nature of heat and smoke generated by the fire because they are important in model de-velopment as well as in engineering design. Recently, Grant, Jagger, and Lea [4] have presented a review on fires in tunnels by paying special attention to the determination of the critical velocity of back-layering. In the present paper we will review recent progress on tunnel fire research, paying particular at-tention to the characteristics of smoke propagation along the tunnel both up- and downstream of fire.
We will review the fire tests in full-scale tunnels in Section 2 and discuss the nature of fire in Section 3. Characteristics of the smoke propagation along tunnels based on the CFD-FMA are given in Section 4. The analogy between smoke propaga-tion and the gravity current movement is elucidated in Secpropaga-tion 5. The FNPA based on empirical models of back-layering is discussed in Section 6. Finally, several concluding remarks and topics for future research are given in Section 7.
2 FULL-SCALE TUNNEL FIRE TESTS
Although it has been recognized that experimental data pro-vide indisputable information for tunnel fire and are important in determining relevant physical parameters in model
ap-proaches, there have been only a few full-scale fire tests. The reasons for this paucity of data are three-fold: high cost of ex-periments, logistical and planning difficulties, and the time-consuming nature of implementation. Among successful ex-periments is the Swiss test in Ofenegg Tunnel in 1965 [5], which was the first test carried out to obtain scientific and en-gineering information. The Glasgow series and the Austrian test in Zwenberg Tunnel were held between 1974 and 1975 [6]. The Japanese test carried out in an experimental tunnel was completed in 1980 [7]. The EUREKA test in Repparfjord Tunnel in Norway in the early '90s [8] and the US test in the Memorial Tunnel between 1993 and 1995 [9] were the two largest-scale experiments carried out thus far, covering virtu-ally all aspects of concern to tunnel engineers in the past. Be-low, we highlight the content and major results of these two tests. For more details, the readers may refer to the proceed-ings of the international conference on fire in tunnels [10]. 2.1 Memorial Tunnel Fire Ventilation Test Program (MTFVTP)
The Memorial Tunnel was a two-lane, 853-meter-long road tunnel, a part of the West Virginia Turnpike. It was built in 1953 and had been out of service since 1987. The tunnel had a 3.2% upgrade from south to north portal. The cross-sectional area of the tunnel was 60.4m2 without ceiling and became 36.2m2 when the ceiling was in place. The tunnel was originally designed with a transverse ventilation system, while during the test the tunnel was converted into a longitu-dinal ventilation system by installing 24 reversible axial jet fans along the top of tunnel (without ceiling). They gener-ated the fire by burning low-sulfur No 2 fuel oil in four pools, creating various heat sources ranging nominally from 10MW to 100MW. The instruments measuring the air tem-perature, air velocity, and the concentrations of CO, CO2 and THC (total hydrocarbon content) were installed at 12 cross-sections along the tunnel. In total, there were approxi-mately 1400 measuring points. Each point was recorded once every second during the test; each recording lasted from 20 to 45 minutes. The construction of the test facility began in early 1991 and two commissioning tests were held in mid-1993. Actual testing began in September of 1993 and ended in March of 1995, with a total of 98 tests.
The objectives of MTFVTP were two-fold: first, to develop a comprehensive database so that a definitive comparative evaluation between the capabilities of transverse and longitu-dinal ventilation systems to manage smoke and heat could be made; and second, to determine the relative effectiveness of various ventilation configurations, ventilation rates, and op-eration modes in the management of the smoke and heat for fires of varying intensities. Test results included a large as-semblage of data covering various aspects such as the propa-gation of smoke and heat, performance of jet fans, effect of physical parameters, and the ventilation performance of differ-ent vdiffer-entilation configurations. Here we outline conclusions made during this study regarding smoke propagation.
1. The ventilation velocity of 2.5 to 3m/s was sufficient to block the back-layering in the Memorial Tunnel over a fire size ranging from 10MW to 100MW.
2. Both the direction and the propagation speed of smoke depend on the fire size, tunnel grade, pre-fire condition in the tunnel, and external meteorological conditions when the jet fans were not in operation.
3. The throttling effect of air flow in the tunnel due to fire was significant. For a 10MW fire, the airflow velocity can be reduced by 10% from the non-fire situation and more than 50% for a 100MW fire.
The throttle effect was also examined by Lee, Chaiken, and Singer [11] by carrying out a series of experiments in a re-duced-scale model. They concluded that the flow resistance due to fire could increase by a factor of 6 in the fire zone and by approximately a factor of 1.5 in either upstream or down-stream of the fire. The factor may nevertheless vary when the HRR of fire changes and/or the blockage ratio of fire varies. 2.2 EUREKA-EU 499 Test
EUREKA-EU 499 Test was performed in an abandoned nel named Repparfjord Tunnel in northern Norway. The tun-nel was 2.5km in length and had a 2.3% upgrade slope near the fire site. The cross section was a horseshoe shape with a rather flat roof. The width varied from 5.3 to 7.0m and the maximum height in the center changed from 4.8 to 5.5m. The project was initiated in Germany and was later joined by eight other European countries – Austria, France, Great Brit-ain, Italy, Norway, Sweden, and Switzerland. The main ob-jectives of the EUREKA-EU 499 Test were to investigate the fire phenomena, to seek the possibilities of escape, rescue, and fire extinguish, to see the damage of tunnel structure caused by fires, and so on. Major results have been reported in [12] to which the reader can refer for details.
In the following, we briefly outline major results of EUREKA-EU 499 regarding smoke propagation in tunnels. 1. Unlike the other full-scale tests that used oil pools to
gen-erate fires, the EUREKA-EU 499 Test used real, contem-porary vehicles as the fire source. Results showed that generally the temperature of subway-coach or school bus fires could reach 800°C or higher and the HRR was about 30MW. For a passenger car, the highest temperature was between 400 and 500°C and the HRR was 3 to 5MW; for a heavy-loaded truck, the corresponding data were 1000 to 1200°C and 50 to 100MW.
2. The propagation speed of smoke front was constant along the tunnel, implying that the behavior of smoke propaga-tion was similar to the movement of gravity currents (see Section 5). In the test of a 10MW fire, for example, the propagation speed of smoke front was about 1.1m/s when the ventilation air velocity was about 1.2m/s, which is very close to the CFD-FMA results to be shown in Section 4. 3. The characteristics of fire were strongly influenced by the
ventilation condition. As ventilation prevails, both the maximum HRR and the maximum temperature of the fire were significantly higher than that without ventilation. 3 FIRE: SOURCE OF SMOKE AND HEAT
Fire generates smoke and heat. Its characteristics determine the content of smoke and the HRR and thus influence the ven-tilation in tunnel. Fire develops into flame, either a laminar
flame or a turbulent flame. The flame of tunnel fire belongs to the latter [13]. In this section, we review the works regarding the characteristics of fire in a tunnel: flame propagation, source of smoke, and source of heat. All of these affect the characteristics of smoke propagation during tunnel ventilation. 3.1 Flame development and propagation
A large volume of research on turbulent flame propagation has been reviewed by Libby and Williams [14], in which both the development of turbulent flame models and the pro-gress of relevant investigations into reacting flows were re-ported. Urtiew, Brandeis and Hogan [15] studied experi-mentally the effects of obstacles on flame propagation in gaseous media and found that obstacles could increase the speed of flame propagation since they changed the turbulent structure in flame. Later Brandeis [16] investigated system-atically the effects of obstacle configurations on flame propagation through a 2D numerical computation. Results confirmed that distributed obstacles can accelerate the flame speed to values much larger than its nominal speed. Barr [17] also concluded, through a 2D computational study, that the combustion-generated flow caused turbulent recirculation regions in the downstream of obstacles. As the flame inter-acted with the turbulent flow, the burning rate increased, re-sulting in a stronger flow and, in turn, an accelerated flame. Recently, Beard, and Drysdale [18] developed a nonlinear model of fire spread in a longitudinal ventilation tunnel to examine the conditions that give rise to the flashover of fire, so that the unstable states and associated instability of fire spread could be identified. They concluded that a higher ventilation flow tended to increase the HRR of fire as the fire spread from one vehicle to another.
3.2 Source of smoke
Generally, smoke is thought to be visible because it results mainly from the combustion of materials containing particu-lates, water vapor, unburned fuel, and so on. However, a large part of smoke consists of invisible components, such as carbon dioxide, carbon monoxide, and other toxic and corrosive gases. Smoke hazards occur due to toxicity, temperature rise, and light obscuration [19]. Exposure to high temperature and toxic gases can threaten life and the reduced visibility in-creases the difficulty of rescue operations during tunnel fires. In general, although various investigations have suggested that the toxic gases in smoke may include more than 20 kinds (see Table 2.3 of [20]), carbon monoxide (CO) poisoning accounts for roughly one-half of the fire-deaths. A dry air of tempera-ture higher than 350°C [21] and a vapor-saturated air of tem-perature higher than 204°C [22] can lead to damage of all components of the respiratory tract (larynx, trachea, and lungs). The low visibility of smoke causes people to be disori-ented and eventually become victims of toxic gases and ele-vated temperatures. We note that in either analysis or compu-tation, it is virtually impossible to take all the components contained in smoke into account. Instead, smoke is accounted for by CO2, see, for example, reference [23]. Results predicted
on the basis of this approximation have shown satisfactory agreement with the experimental data.
3.3 Source of heat
The heat release rate (HRR) of tunnel fire is one of the im-portant parameters in determining the characteristics of smoke propagation in tunnels. Ingason [24] in the project EUREKA-EU 499 implemented a series of HRR measure-ments of burning vehicles by employing the so-called oxy-gen consumption technique. Results show that HRR in-creases dramatically after the ignition of fire, reaches a maximum in 10 to 20 minutes, sustains at this high level of HRR for a short period, and then decreases monotonically. The time required for HRR to reach the maximum was about 10 minutes for school buses and subway coaches and was about 20 minutes for passenger trains and wood cribs with force ventilation. The maximum HRR was about 30MW for school buses, wood cribs with force ventilation, and subway coaches, and was about 10MW for wood cribs without force ventilation and passenger trains. The maximum temperature of the fire was also investigated by Blume [25]. He showed that the temperature could reach as high as 1000°C for sub-way coaches, 800°C for school buses, and 600°C for passen-ger trains. By and large, according to the long-used category of fire size defined by the PIARC (Permanent International Association of Road Congress), the HRR is about 10MW for passenger cars, 50MW for trucks or buses, and 100MW for trucks carrying fuel or combustible gas.
4 CHARACTERISTICS OF SMOKE PROPAGATION—CFD-FMA
Figure 1 describes schematically a typical case of smoke propagation in tunnel fire, in which the ventilation flow moves to the right. The smoke generated by the fire moves either towards upstream, forming the back-layering, or to-wards downstream, propagating with the ventilation flow by a constant speed. Under some circumstances, the smoke in both up- and downstream is well stratified vertically, a de-sired outcome for the ventilation design. In the upstream, be-fore encountering the back-layering smoke, the flow is a classical longitudinal motion and can be described by a 1D model. In the back-layering zone, the flow consists of two stratified layers, ie, the hot smoke at the top and the cold fresh air below. The two layers move in opposite directions, inducing a strong shear at the interface between the two lay-ers that may eventually lead to a mixing of smoke and air. In the vicinity of fire, the flow is three-dimensional and fully turbulent, and the radiation accounting for a large percentage of heat transfer from the fire should be taken into account. Under some circumstances the combustion mechanism may also influence the flow structure. At downstream the smoke propagates along with the ventilation flow. The smoke may either mix with the fresh air or form a stratified layer above the fresh air, depending on the ventilation flow velocity. The flow is essentially turbulent, while due to the strong stratifi-cation in the vertical direction, a 2D model may be sufficient to describe the flow characteristics.
To simulate the complex flow of Fig 1, the CFD-FMA is one of the successful methods that has been used. This ap-proach originated in the mid-’80s, but the progress has been
rather slow due to the limitation of computer power. To date only a few studies have successfully simulated fire and/or smoke movement in tunnels, with Hwang et al [26] playing a pioneering role. They developed a 2D model with a control volume approach to study the flow resulting from the inter-action between fire and ventilation flow. They focused on the development of back-layering flow and its response to the change of both ventilation flow and fire source. Markatos et al [27] also developed a 2D model to study the buoyancy-induced smoke flow in which the standard k-ε turbulent model was considered. The fire was considered as a source of heat and smoke and the equations were solved numeri-cally by SIMPLE and NEAT algorithms. Special attention was paid to identify the validity of turbulent models. Kumar and Cox [28] employed the JASMINE code developed by the Fire Research Station of UK to analyze the flow in tunnel fires and compared their CFD results with the experimental results obtained from the tests conducted in Zwenberg Tun-nel. Comparisons of temperature, CO2, O2, and fuel
concen-tration were satisfactory for the case of steady flow and in areas remote from the fire. Kotoh and Yamanaka [29] devel-oped their own code based on SIMPLE and ADI schemes and considered fire as a source of heat and smoke; but ne-glected radiation. They showed that computational results were in good agreement with the experimental data in the far downstream of fire where the smoke layer is well stratified.
In the late ’80s, the AEA of UK developed FLOW3D code based on the finite volume approach, which has been successfully employed to compute flow in tunnel fires. Among successful examples, Ierotheou and Galea [30] ap-plied FLOW3D on a fire field model in a parallel-computing environment. They reduced the computing time from four days in a regular environment to eight hours in paral-lel/vector environment. Tabarra et al [31] employed FLOW3D and a standard k-ε turbulent model without radia-tion to study the smoke behavior downstream of fire. They also conducted a reduced-model experiment with an equiva-lent-4MW fire to observe the motion of the stratified smoke layer. In general, their CFD results were able to capture qualitative characteristics of smoke propagation observed in experiments; quantitative comparisons were not satisfactory. They attributed this discrepancy to the inaccuracies of the turbulent model and to the neglect of radiation.
By focusing on the downstream flow, Xue and co-workers [32-34] implemented a series of CFD studies and found that the ventilation flow was influential in generating the stratification of smoke in downstream, and the smoke flow was essentially two-dimensional due to the stratifica-tion. These findings were consistent with the results of Ko-toh and Yamanaka [29] and Brandeis and Bergmann [35], both of whom indicated that, in the vicinity of fire, the ven-tilation flow had negligible effect on the flame development, although in the far downstream the ventilation flow was in-fluential on the smoke propagation. Chow [36] employed PHOENIX code to study the 3D flow in the tunnel fire. A fire of 5MW was considered and the standard k-ε model was applied. Focus was placed on the influence of the air en-trainment rate and the HRR of fire on the flow in the tunnel.
Recently, Woodburn and Britter [37, 38] carried out a systematic study to investigate the conditions that sensitively determine the accuracy of CFD results of the flow in tunnel fires. This sensitivity study was implemented for the fire area [37], the region around the fire, and the region downstream to the fire [38]. These two studies could be the most com-plete CFD studies so far reported on tunnel fires, and cover many of the critical issues in this field. We therefore will delve into their results in more detail in the following discus-sion. In the fire area, attention was paid to the back-layering phenomena. In the downstream area, smoke propagation along with ventilation was investigated. They concluded that an accurate simulation of fire area required precise specifi-cations of the ventilation velocity profile, the HRR of fire, and the realistic model of turbulence. The use of a partially developed ventilation velocity profile rather than a uniform profile led to a longer back-layering length. An increase of 7% in ventilation velocity caused a reduction of back-layering length by 70%. Their conclusion implied that the discrepancy between the computational results and the ex-perimental data might be due to the insufficient information regarding the real ventilation velocity profile.
With regard to the turbulence model, they found that the standard k-ε model leads to an under-prediction of the back-layering length. They modified the standard k-ε model based on the fact that, in the back-layering flow, the density is strongly stratified vertically and hence the turbulent diffusion in the vertical direction is very different from the diffusive transport in other directions. As a result, a careful choice of turbulent parameters could greatly enhance the agreement between the computational and experimental results. The combustion was modeled using the so-called eddy-break-up model, in which the chemical reactions were assumed to be one-step chemistry and of infinite reaction rate. It turns out that the model over-predicted the reaction rate as well as the HRR, when compared with the experiments. It is not clear how much of a reduction of HRR could have been appropri-ate for the simulation.
In the study of the downstream area, Woodburn and Brit-ter [37, 38] pointed out that the factors influencing the smoke propagation were natural convection, radiation, and wall roughness, while the downstream boundary position and the turbulent model were essentially not influential. They showed that the consideration of natural convection on the wall led to an 18% increase of heat transfer and an inclusion of a radiative heat transfer in simulations that caused a 40% increase in heat transfer to the wall and a 32°K decrease in downstream temperature. Also shown was that the consid-eration of wall roughness increased the rate of heat transfer at walls by 20 to 26% over that of smooth wall. It was nev-ertheless difficult to model the actual wall roughness of a tunnel because of the existence of the cable truss, wires, ducts, signs, fans, and walkways. They also indicated that the wall temperature at downstream boundary was insensitive to the roughness of the wall, contrary to the results of Kumar and Cox [28]. On the other hand, their numerical evidence showed that the downstream flow is insensitive to the turbu-lence model, as it is highly stratified vertically and the
strati-fication virtually damps out the turbulent diffusion in the vertical direction. The effect of the downstream boundary condition was found to be negligible, due to the fact that the waves in the stratified flow at downstream were of a velocity greater than the ventilation velocity and therefore no wave would move upstream of the boundary.
The studies reviewed above indicated that CFD-FMA is becoming a powerful tool to investigate flow in tunnel fires. The commercialization of the CFD codes, such as JASMINE, FLOW3D, and PHOENIX, has enhanced the power of computation. A reliable CFD result can be obtained when the following points revealed by previous studies are carefully treated:
1) The flow in tunnel fire is essentially two-dimensional in both up- and downstream of fire, while in the fire re-gion, the flow is three-dimensional (see Fig 1).
2) Generally, a careful choice of a turbulent model and the corresponding input parameters are crucial. Due to the two-dimensionality, the flow remote from the fire can be well simulated by the k-ε turbulent model.
3) The velocity profile of ventilation flow is influential on the propagation of back-layering in the upstream direction. 4) The boundary condition at the exit portal and the wall
roughness have negligible effects on the smoke propa-gation in downstream.
5) In the fire region, the flow is fully turbulent and influ-enced largely by radiation and the selection of the tur-bulent model and combustion mechanisms.
To illustrate the elegance of CFD-FMA, following we show an example of this approach to elucidate the character-istics of the smoke propagation under the influence of venti-lation flow. The analysis focuses on the smoke movement in both up- and downstream of fire. The fire is taken as a source of heat and smoke (accounted for by CO2 [23]) in which no
combustion is considered. A 2D flow is considered [34] and the standard k-ε model is employed [38]. A comparison be-tween the CFD result and the experimental observation from fire tests will be given and the similarity between CFD-FMA and GCA will be discussed in Section 5.
In CFD-FMA, the following equations serve well to simulate this 2D turbulent flow in which a source of heat and smoke is present [27]. They are :
the continuity equation 0 ) (ρ = • ∇ + ∂ ρ ∂ U t , (1)
the momentum equations
σ • ∇ + = ρ • ∇ + ρ ∂ ∂ B U U U t( ) ( ) , (2)
the energy equation
Q U U B t P T H U H t + • τ • ∇ + • + ∂ ∂ + ∇ λ • ∇ = ρ • ∇ + ρ ∂ ∂ ) ( ) ( ) ( ) ( , (3)
and the mass generation equation
C C C C UY Y S Y t ρ +∇• ρ =∇• κ∇ + ∂ ∂ ) ( ) ( ) ( . (4)
In the above equations, ρ accounts for the density, U the ve-locity vector (u,v), B the body force,
I U U U I P +µe(∇ +∇ T)−(2/3)µe(∇• ) − = σ
the stress tensor, H the total enthalpy, λ the heat conductiv-ity, T the temperature, P the pressure,
U U U T e e ∇ +∇ − µ ∇• µ = τ ( ) (2/3) , Q
the heat source, YC the mass fraction of CO2, κ the mass
dif-fusivity, and SC the mass source. Note that the use of k−ε
model yields µe = µt + µ and µt =ρCk2/ε, where µ is the
dy-namic viscosity, C = 0.09 [27], k is the local kinetic energy of fluctuation motion, and ε is the energy dissipation rate.
To solve the above equations, we employ FLOW3D code. The computational domain is a 2D tunnel of a length being 100 times the height of tunnel. A steady Poisuelle flow enters into the tunnel from the left portal and on the right portal the pressure is assumed to be atmospheric [37]. The tunnel wall and the road surface are assumed to be adiabatic. From the product analysis of combustion, the smoke source strength was found to be 1.4 × 10⁵ ppm/s and the heat source strength can vary from 1MW to 100MW [24]. In the analysis, we vary the ventilation velocity from 1m/s to 10m/s. Accompanied with the variation of heat source strength mentioned above, we can systematically study the propagation of smoke in the tun-nel under various heat sources and ventilation velocities.
By observing the evolution of smoke profiles under vari-ous ventilation conditions, we summarize in Fig 2 the com-putational results on the propagation velocity of smoke front towards downstream and its dependence on the ventilation velocity for four different heat sources, ie, 2MW, 10MW, 50MW, and 100MW. It is seen that the relationship between the smoke propagation velocity and the ventilation flow ve-locity is essentially linear. It implies that, for all heat sources considered, the smoke moves invariably with a constant speed along with the ventilation flow, which is consistent
with the experimental results of EUREKA EU-499 test [12]. This fact also implies that the behavior of smoke propagation is similar to that of gravity currents. It is noted that in most of the cases considered, the smoke propagation speed is gerally higher than the ventilation velocity, due to the en-hancement of velocity contributed by buoyancy. On the other hand, as the ventilation velocity is large enough, the ventila-tion flow dominates over buoyancy effects, so that the ven-tilation velocity is higher than the smoke propagation speed. This is especially obvious in the case of low HRR fire be-cause of the low buoyancy. Note that the error bars shown on each line were estimated according to the possible error re-sulting from the observation on the movement of the smoke front. By applying curve fitting technique, we can find a re-lation v = B + 0.55V where B = 0.3626 + 0.06772Q – 0.003874Q2 and Q represents the HRR of a unit MW.
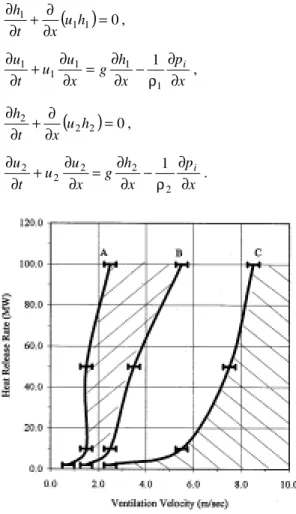
In view of the safety issues associated with the design of ventilation systems, the smoke stratification should remain under ventilation so that the smoke can be confined to a horizontal layer under the ceiling, leaving the fresh air above the road surface for tunnel users. Another safety criterion is that the ventilation flow should be strong enough to stop the back-layering while should not be so strong as to result in mixing of smoke with the fresh air below. The worst case is that the hot and toxic smoke mixes with the fresh air and moves rapidly along the road surface, threatening the life of tunnel users [39]. Figure 3 illustrates this safety point of view. Three curves accounting for different situations are drawn to separate the figure into four different regimes. The regime lying on the left of curve A accounts for the case where the ventilation velocity is too small to stop the back-layering. The regime lying between curves A and B repre-sents the case in which no back-layering occurs upstream and at downstream the smoke is well stratified vertically. The regime lying between curves B and C shows the case where the smoke stratification at downstream breaks down. The regime on the right of curve C denotes the situation where the smoke mixes with fresh air and moves along the road surface. The regime between curves A and B is there-fore a safe region in which the ventilation velocity should be chosen. The regime on the right of curve C is an extremely dangerous situation, and should definitely be prevented. We note that the report of PIARC [39] recommended that the ventilation velocity be from 2 to 4m/s irrespective of fire size and that the test of MTFVTP [9] found that the critical ve-locity should lie within 2.5 to 3m/s for fire sizes ranging from 10MW to 100MW. Both these recommended data lie within the safe regime of Fig 3, implying that the CFD re-sults are reliable for engineering design practice of tunnels.
5 GRAVITY CURRENT APPROACH (GCA)
The smoke generated from fire contains hot gases. Due to buoyancy, the hot smoke rises to impinge on the ceiling of the tunnel and turns to move against or along the ventilation flow. Although the existence of a mixing layer in the approaching front of the stratified smoke layer leads to a major difference between the smoke movement and the gravity current motion,
Fig 2. The relationship between the ventilation flow velocity V and the propagation speed of smoke ν for fires of various HRRs
the smoke under most of the circumstances moves in the form of a stratified flow, behaving like a gravity current commonly found in nature [40]. An example can be seen in underground coal mines, where the stratified methane layer attached to the ceiling of the mineshaft moves along the tunnel with a con-stant speed. Due to the evident analogy between the smoke propagation and the gravity current motion, in this section we develop the GCA to describe the propagation of smoke in both up- and downstream of fire.
Consider an inviscid and incompressible 2D flow (see Fig 4) in which the hot smoke is attached to the ceiling of tunnel and moves with the ventilation flow with a constant speed. The vertical velocity is much smaller than the horizontal ve-locity, namely, u >> v. The governing equations in both smoke (zone 1) and ventilation air (zone 2) are the following simplified equations [41]: 0 = ∂ ∂ + ∂ ∂ v y u x , (5)
( )
( )
p x uv y u x t u ∂ ∂ ρ − = ∂ ∂ − ∂ ∂ + ∂ ∂ 2 1 , (6) g p y =ρ ∂ ∂ . (7)By integrating these equations vertically over these two zones and by applying the continuity condition at the inter-face, Eqs (5) to (7) can be reduced into
( )
1 1 0 1 = ∂ ∂ + ∂ ∂ h u x t h , (8) x p x h g x u u t u i ∂ ∂ ρ − ∂ ∂ = ∂ ∂ + ∂ ∂ 1 1 1 1 1 1 , (9)(
2 2)
0 2 = ∂ ∂ + ∂ ∂ h u x t h , (10) x p x h g x u u t u i ∂ ∂ ρ − ∂ ∂ = ∂ ∂ + ∂ ∂ 2 2 2 2 2 1 . (11)Note that h1 + h2 = H, the height of tunnel, is a constant. In
above equations the subscripts 1 and 2 denote the two zones. By combining Eqs (8) and (10), one obtains (∂/∂x)(u1h1 +
u2h2) = 0. As the volume of smoke generated from fire at x =
0 as well as the volume of air transported with ventilation flow are considered, the relation of mass conservation can be obtained: UH qt h u h u1 1+ 2 2 =α α−1+ , (12) in which qtα accounts for the volume of smoke per unit width (so that αqtα-1 represents the rate of smoke generation per unit width) and UH is the volume of ventilation air per unit width. We assume α = 1 so that the rate of smoke generation is constant. By eliminating pi, u2, and h2 from Eqs (10) and
(11), one obtains the following equations for
u
1 andh
1 as( )
( )
( )
(
)
( )
(
( )
)
. 1 1 1 1 1 1 2 1 1 1 1 1 2 1 3 2 1 1 1 1 1 − α φ − − α γα = ∂ ∂ ′ φ − ′ − γ − + ∂ ∂ − φ + φ − φ + γφ + + ∂ ∂ φ − γφ + t H q x h g H g u A x u u u A t u (13)In the above equation, we define
1 2 ρ ρ = γ , H h1 = φ , U H qt A=α + − α1 and g g ρ ρ − ρ = ′ 1 1 2 .
Note that Eqs (8) and (13) are the governing equations for u1
and h1.
To solve Eqs (12) and (13), the following boundary con-ditions need to be considered. At the smoke source x = 0
1 1
1h =αqtα−
u , (14)
at the smoke front [42] x = xf
(
)( )
( )
+φ φ − φ − β = ′ 1 1 2 2 2 1 2 1 h g u , (15) where xf is to be solved by . 0 1 α =∫
xf hdx qt (16)In Eq (15), β is a constant to be determined by experiments. Rottman and Simpson [41] found that for a saline current in fresh water 1 ≤β≤ 1.2, and β = 1 is considered in the present analysis. By assuming γ≈ 1, φ= 1 <<1 H h and
(
)
1 2 1 << ′ − H g u A ,Fay [43] obtained a similarity solution for the above equations.
Fig 3. The three curves separating the figure into four regimes, each accounting for a ventilation situation from an engineering viewpoint
Fig 4. A schematic description of the gravity current approach (GCA)
( )
2 13 1 qg u = β ′ , (17)(
2 2 1)
13 1= β− q g′− h , (18) t u xf = 1 . (19)Note that the solutions in Eqs (17) to (19) are good for the smoke propagation in both downstream and upstream. We employ (β2g'Q)1/3 to nondimensionalize the velocity, where Q is the volume flux of smoke; then the solution of Eq (17) can be rewritten into the dimensionless form as
3 1 + +=q
u , u− =−q1−3, (20) where q and + q account respectively for the downstream− and upstream smoke volume flux. By applying mass conser-vation and momentum conserconser-vation in horizontal direction, one obtains 1 = + − + q q , q+u++q−u−=cU. (21)
Note that c is the correction factor, which should be deter-mined empirically. In the present study we assume c = 1.
Equations (20) and (21) are to be solved for the propa-gation velocity of smoke in both up- and downstream. By substituting Eq (20) into (16), one obtains
cV q
q+43− −43 = (22)
Note that when there is no back-layering, one has q = 0,− −
u = 0, q+ =1, 1u+ = , and Vc = c−1. The critical velocity
can thus be rewritten into a dimensional form as
(
2)
13 1 Q g c Vc= − β ′ . (23)Since the rate of smoke generation q is equivalent to the HRR denoted by Ec, one obtains that the critical velocity to
stop back-layering is proportional to q1/3 (or E1c/3). Similar
results have also been obtained by Hinckley [43] who
de-rived the critical velocity Vc for the smoke propagating in a
enclosed shopping mall.
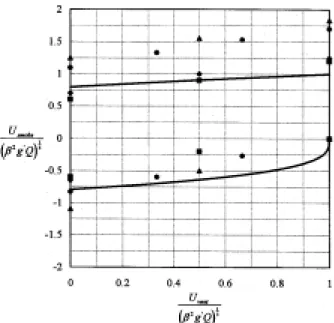
To show more concretely the analogy between smoke propagation and gravity current movement, we make a compari-son in Fig 5 between the results in terms of the relation between the smoke propagation speed (vertical axis) and the ventilation velocity (horizontal axis) obtained by CFD-FMA (markers) and GCA (curves). The CFD-FMA results are for fires of various HRRs and the GCA results are for a fire of 2MW. It is found for the 2MW case that the comparison for the downstream smoke is fairly good, while for the upstream (back-layering) smoke there is a relatively larger discrepancy. This may be due to the fact that in GCA the assumption c = 1 is not particularly good for the present case; it should actually be determined through relevant experiments. In addition, the velocity profile of ventilation flow can be another factor causing this discrepancy [37]. In CFD-FMA the Poiseulle flow of parabolic profile was considered, while in GCA an inviscid flow of uniform profile was taken into account. As we shall show in the next section, for back-layering flow the FNPA leads to a better result and has accordingly been widely used in the past. Figure 5 shows that the propagation speed of back-layering is essentially independent of the HRR, corroborating the conclusions of Grant et al [4].
6 FROUDE NUMBER PRESERVATION APPROACH (FNPA)
The buoyant current rising from the fire overcomes the ac-tion of ventilating air, sets up a countercurrent flow stream-ing back from the fire against the ventilation flow, and forms the back-layering flow. The back-layering is a stratified flow if Ri < Ric, where Ri ≈ g(∂T/∂z)/T(∂u/∂z)2 is the Richardson number; Ric = 0.05eRe/4200 is the critical Richardson number beyond which the stratification breaks down, and RE =UL/ν is the Reynolds number [44]. As back-layering occurs, the smoke containing hot toxic gases moves into upstream. Thomas [45, 46] showed that the back-layering might occur if the ratio of the buoyancy head H∆T/T to the velocity head V2/g is greater than unity, where g is the gravity acceleration constant and ∆T the change in temperature due to fire. This approach had later been developed into the so-called Froude number preservation approach (FNPA). Based on this ap-proach, there have been a number of experimental and theo-retical investigations devoted to the determination of the critical velocity of ventilation flow necessary to prevent the occurrence of back-layering; see the reviews by Lea et al [47], Kennedy [48] and references therein. One of the most successful examples of applying FNPA is the SES code, which was developed by Parsons Brinckerhoff [49].
The details of FNPA can be explained as follows. We de-fine the Froude number as
(
)
2 V gH Fr f ρ ρ − ρ = (24)where ρ is the average density of the approach air and ρf is
the average density of the air at the fire site. By applying the perfect gas law p = ρRT and the energy balance equation
f p c pT E mc T c m! + = ! , (25)
Fig 5. A comparison between the results from GCA (curves) for a 2MW fire and the CFD-FMA results (markers for various HRRs; !: 2MW ; ": 10 MW ; ▲: 50 MW ; #: 100 MW).
where m! =ρAV, one obtains that 3 V AT c gHE Fr f p c ρ = , (26)
where cp is the specific heat of air, A the cross-section area of
tunnel, and Tf the average temperature of the air at the fire
site. At the critical Froude number (Frc) the ventilation
ve-locity is also critical (Vc) [50], namely,
3 1 1 ρ = f p c c AT c gHE K V , (27) where 61 . 0 3 1 1=Frc− ≅ K . (28)
Equations (25) and (27) can be used to solve Vc and Tf
si-multaneously. Note that since A = HW, where W is the width of tunnel, as W→∞, one obtains Tf→T and Vc→0. On the
other hand, as H→∞, we have Tf→T and Eq (27) holds.
Kennedy [48] employed the result of Eq (27) to compare with the experimental results from the Memorial Tunnel Fire Ventilation Test [51] and indicated that the FNPA, or the SES methodology, over-predicted the critical velocity by 4 to 16 percent, depending on the scale of the fire. In the other experiment, Kwack et al [52] investigated the interaction between the back-layering induced by a fire of about 0.3MW and the ventilation flow in an aircraft cabin and concluded that Eq (27) predicted the penetration length of back-layering fairly well. Nevertheless, that Vc is proportional toE1c/3
pre-dicted by FNPA has been challenged recently by Oka et al [53], who showed that, based on an analysis, the relation Vc
~ Ec1/3 is only good for small fires; for large fires Vc is
inde-pendent of Ec. This scenario was supported by the
experi-mental results obtained by Bettis et al [54], who conducted a series of large-scale fire tests and observed that Vc is weakly
dependent on Ec, particularly when the flame extended up to
and along the ceiling of the tunnel. The weak dependence of Vcon Ec is also supported by the CFD-FMA results of §4
where we have shown that for a fire of Ec ranging from
10MW to 100MW, the value of Vc is essentially independent
of Ec (see the lower markers of Fig 5).
It is known that for tunnels with downhill slope, the criti-cal velocity must be greater than that of a horizontal tunnel. To clarify the difference, Bakke and Leach [55] conducted an experiment by observing the movement of methane layers in coal mines to study the effect of grade of tunnel on Vc. It
turned out that Eq (27) was modified into 3 1 1 ρ = f p c g c AT c gHE K K V (29) in which
( )
0.8 0374 . 0 1 G Kg = + (30)where G is the absolute value of the grade of slope, ex-pressed as a percent. Recently, Atkinson and Wu [56] had
extended the work of Bakke and Leach [55] and argued that the experimental results obtained by model testing have sig-nificant limitations, and that factors such as the shape, size, and location of fires have significant effects on the amplitude of critical velocity. Based on the results obtained by the model testing, Oka and Atkinson [57] showed that the cor-rection of the critical velocity in a downhill slope tunnel could be expressed as ] 014 . 0 1 [ ] 2 . 1 [ * G E V gH Vc = m α + (31) where α = 1/3 if E* ≤ 0.12, α = 0 if E* > 0.12, and E* = Ec/ρcpTfg1/2H5/2.
In some sense the value of Vm depends on the shape and
location of fire in tunnel. For a fire of much narrower width than the tunnel, one has Vm≈ 0.35. For a fire spreading over
the full width of the tunnel, one may have Vm ≈ 0.31. We
note also that for a horizontal tunnel (G = 0), Eq (31) can be a correction for the critical velocity when the fire shape causes a significant blockage within the tunnel.
7 CONCLUDING REMARKS AND FUTURE WORK Smoke is a buoyant current rising from a fire; it impinges on the ceiling of the tunnel and then moves to both up- and downstream of the fire. Both experimental and computa-tional results have shown that, under some circumstances, the smoke moving against the ventilation flow forms a strati-fied layer, in which a countercurrent flow steadily attaches to the ceiling of the tunnel until the buoyancy is reduced by heat loss to the strata. In the downstream, under a safe ven-tilation condition, the smoke propagating at a constant ve-locity with the ventilation flow is also a stratified layer, not unlike the gravity current moving under a constant buoyancy force. The flows in both up- and downstream are generally two-dimensional and the density stratification dominates the flow. The flow in the vicinity of fire, nevertheless, is a fully 3D turbulent flow, and the computational results are strongly dependent on the combustion mechanism and the radiation model. Some low-frequency small-amplitude gravity waves have been observed in the experiment [40] moving along the interface between the hot smoke and clear cold air. These unsteady oscillation waves may turn unstable, leading to the breakdown of the smoke stratification downstream. Brandeis and Bergmann [35] pointed out that the unsteady waves are a result of the interaction between the pressure waves resulting from combustion and the free boundary at the tunnel exit. The waves are generated from the flame, travel along the ventilation flow, reflect from the free boundary, and finally return to the flame. It is well recognized that the flow de-scribed above is so complicated that no single approach can be employed to simulate the complete flow successfully. This will be a tough challenge to the researchers in this field.
In the present article, we have focused on the smoke propagating both up- and downstream and made a detailed discussion on the progress of relevant research work. Due to the fact that the experimental data are crucial to the model development on tunnel fires, we first reviewed the
mental works carried out in full-scale tunnels. These experi-ments provided valuable data, such as the HRR of different kinds of combustion materials and vehicles of various sizes, the propagation speed of smoke under ventilation, the tem-perature distribution around the fire, and so on. We pointed out that, in the distant past, the experimental data have suf-fered from a lack of adequate quality to provide sufficient in-formation to allow effective model development and valida-tion. Two recent tests, the MTFVTP and the EUREKA-499, however, have implemented an intense series of tests and obtained a great deal of high quality data to meet the needs of both engineering design and model development. Based on these results, some computational and analytical results can be confirmed or used in the engineering-design process.
We then reviewed the work on the nature of fire, which is thought to be influential on smoke propagation in the tunnel. We focused on the work regarding flame propagation, the source of smoke and heat, and the interaction between fire and flow. The interaction of combustion and ventilation flow in tunnel fires is so complex that so far there have been no con-clusive results on this problem. It is generally shown by vari-ous approaches that neither the combustion mechanism nor the components of smoke is influential on the smoke propagation behavior both up- and downstream of the fire. The HRR of the fire, however, can be the sole factor that determines the propa-gation of smoke. This fact has been well established experi-mentally during the past decade [8, 9, 10, 39].
To analyze smoke propagation in a tunnel, three different approaches have been discussed: the CFD-FMA, the GCA, and the FNPA. The CFD-FMA provides the detailed flow structure of the smoke propagating with the ventilation flow. This approach has become powerful since the speed of com-putation had increased rapidly in the past decade and the cost of computations has been reduced dramatically. This trend will become more obvious and the advantage of the approach is expected to enhance with time. More importantly, due to the commercialization of the computer codes in which the so-called user-friendly working interfaces are built, CFD use will become more mundane. The CFD-FMA has great potential to be widely used in the future and to become a major tool in de-sign and analysis. The major concern with CFD-FMA stems mainly from the accuracy of the mathematical models considered. The factors of concern can be seen from the sensi-tivity studies of Woodburn and Britter [37, 38], in which the governing factors to be included in theoretical models and the role of boundary conditions in determining the accuracy of computational results were discussed. Nevertheless, the results from sensitivity studies need to be confirmed by experimental works, which have been insufficiently done.
To predict the behavior of smoke propagating in the downstream, the GCA can be an efficient method. This ap-proach is based on the fact that the smoke propagates with a constant speed, like the movement of gravity current above a flat surface. The model is established upon a simplified mathematical model in which an inviscid 2D flow is consid-ered. Consequently, the propagation speed of smoke in both up- and downstream of fire is shown to be constant, and the results regarding downstream smoke have been shown to
compare favorably with the CFD-FMA results. The advan-tage of this approach is two-fold: first, the major features of the smoke flow can be identified before any detailed analysis is to be made; second, the cost of development is low so that repeated application becomes possible. Nevertheless, the major disadvantage has been that reliable results from this approach are not possible if no sufficient knowledge of the flow characteristics is available a priori. In particular, as shown in Section 5, some physical parameters of the model require confirmation by experiments, which has become a major deficiency of this approach.
The FNPA is another simplified model developed espe-cially for the back-layering by Thomas [45, 46]. It has become a major issue discussed by a great majority of research on tun-nel fire. This approach has recently been challenged by Oka et al [53] on the grounds that the dependence of the critical ve-locity of back-layering on the one-third power of HRR of fire is only valid for small fires. For larger fires, nevertheless, the critical velocity has been shown to be essentially independent of HRR. The FNPA is even simpler to use than the GCA, and has been employed successfully in SES programs. Due to the fact that a great deal of research effort has been devoted to the development of FNPA, this simplified empirical approach has been modified on the basis of experimental results and has be-come an efficient tool for special designs. This approach holds the same advantages and disadvantages as those of GCA, and major improvements can only stem from new supporting ex-perimental results.
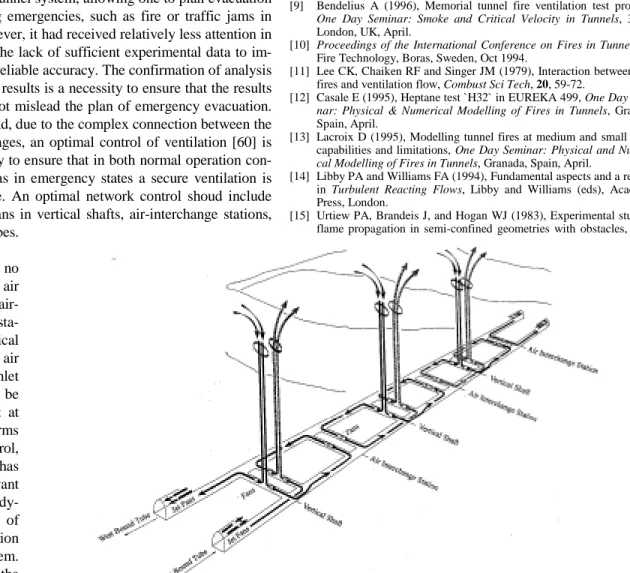
Recently, the design of ventilation systems in modern long road tunnels has been extended to a so-called network model, in which the tunnel is considered as a system in terms of ventilation. In this approach, the smoke movement in all air passages of the network must be analyzed simultaneously so that the gross effects of fire on tunnel ventilation can be assessed and a global solution of fire fighting and smoke evacuation can be made. A good example of a ventilation network can be seen from the Ping-Lin Tunnel, whose ven-tilation system is designed with a modern concept and there-fore shall be representative for this issue (see Fig 6). The Ping-Lin Tunnel is one of five long tunnels in the freeway connecting Taipei (the capital of Taiwan) and I-lan county, cutting through the northeastern Central Mountain Range with an eastern-downward gradient of 1.26%. The tunnel consists of two one-bound-traffic tubes. Each of them is about 12.9km long and has two lanes; it is the longest twin-tube freeway tunnel in the world. In addition, the Ping-Lin Tunnel is also the first tunnel adapted to the ventilation con-cept proposed by Berner and Day [58]. The concon-cept is based on the consideration that if the tunnel can be considered as a single unit with an averaged required flow rate rather than as two separated tubes with two different maximum flow rates, the capital of investment and the cost of operation can be largely reduced. The basic principle of this consideration is based on the utilization of common vertical shafts as well as the air-interchange stations. The vertical shafts serve to pro-vide the fresh air to the system and evacuate the polluted air from the system. The air-interchange stations are set up to
mix the more-polluted air in the uphill tube and the less-polluted air in the downhill tube.
A schematic illustration of the ventilation system of the Ping-Lin Tunnel is shown in Fig 6. The fresh air enters into the sys-tem either from vertical shafts or from inlet portals, travels along one tube, and moves to the other tube through air-inter-change stations, and finally evacuates out of the system through either vertical shafts or outlet portals. The downhill tube is filled with less-polluted air, acting as an auxiliary fresher air supply to the uphill tube in which the air is filled with heavily smoke-pol-luted air. To analyze such a ventilation system as a whole, there is no alternative but to employ the network model. The network is considered to be a combination of various single tunnel tubes and intersecting junctions consisting of a closed circuit of air-ways in which the ventilation flow moves around. In tubes, the 1D aerodynamic model is employed and the results can provide the boundary conditions for the 3D flow computations for the junctions. Typical network analyses can be seen from the SES program developed by Parsons Brinckerhoff Inc of the US [49] and the VENDIS-FS tunnel network code developed by the In-stitut National de l’Environment Industriel et des Risques [59].
A network approach provides global information about the ventilation in a tunnel system, allowing one to plan evacuation strategies during emergencies, such as fire or traffic jams in the tunnel. However, it had received relatively less attention in the past due to the lack of sufficient experimental data to im-plement it with reliable accuracy. The confirmation of analysis by experimental results is a necessity to ensure that the results of analysis do not mislead the plan of emergency evacuation. On the other hand, due to the complex connection between the ventilation passages, an optimal control of ventilation [60] is another necessity to ensure that in both normal operation con-ditions as well as in emergency states a secure ventilation is always available. An optimal network control shoud include the control of fans in vertical shafts, air-interchange stations, and traffic tubes.
Consequently, there shoud be no recirculation of air near air-interchange sta-tions or vertical shafts and the air pressure at the inlet should always be higher than that at the outlet. In terms of smoke control, thus far there has been no relevant research on study-ing the strategy of smoke evacuation from the system. This is one of the most important is-sues that merits immediate study.
ACKNOWLEDGMENTS
This research has been supported by the National Science Council through research grant NSC 89-2212-E-002-034 and by the National Expressway Engineering Bureau through grant 830-N046, which are gratefully acknowledged.
REFERENCES
[1] Haack A (1998), Fire protection in traffic tunnels: General aspects and results of the EUREKA project, Tunnelling and Underground Space
Tech, 13(4), 377-381.
[2] Rerolle J (1987), Technical committee report on road tunnel, 18th
World Road Congress, Brussels, 13-19 Sept. 1987, 66-78.
[3] Gonzalez JA and Danziger NH (1988), Tunnel ventilation design for fire safety, Paper J2, 6th Int. Symp on Aerodynamics and Ventilation of
Vehicle Tunnels, Sept 1988, Durham, England.
[4] Grant GB, Jagger SF and Lea CJ (1998), Fires in tunnels, Phil. Trans
R. Soc Lond. A, 356, 2873-2906.
[5] Heselden AJM (1976), Studies of fire and smoke behavior relevant to tunnels,” Paper J1, BHRA, 2nd Int Symp on Aerodynamics and
Venti-lation of Vehicle Tunnels, March, Cambridge, UK.
[6] Feizlmayr AH (1976), Research in Austria on tunnel fire, paper J2, BHRA, 2nd Intl Symp on Aerodynamics and Ventilation of Vehicle
Tunnels, Cambridge, UK, March.
[7] Mizutani T (1982), Experimental study of tunnel fires, Japan Road Assn.
[8] Haack A (1998), Fire protection in traffic tunnels: General aspects and results of the EUREKA project, Tunnelling and Underground Space
Tech, 13(4), 377-381.
[9] Bendelius A (1996), Memorial tunnel fire ventilation test program,
One Day Seminar: Smoke and Critical Velocity in Tunnels, 39-57,
London, UK, April.
[10] Proceedings of the International Conference on Fires in Tunnels, SP Fire Technology, Boras, Sweden, Oct 1994.
[11] Lee CK, Chaiken RF and Singer JM (1979), Interaction between duct fires and ventilation flow, Combust Sci Tech, 20, 59-72.
[12] Casale E (1995), Heptane test `H32` in EUREKA 499, One Day
Semi-nar: Physical & Numerical Modelling of Fires in Tunnels, Granada,
Spain, April.
[13] Lacroix D (1995), Modelling tunnel fires at medium and small scale: capabilities and limitations, One Day Seminar: Physical and
Numeri-cal Modelling of Fires in Tunnels, Granada, Spain, April.
[14] Libby PA and Williams FA (1994), Fundamental aspects and a review, in Turbulent Reacting Flows, Libby and Williams (eds), Academic Press, London.
[15] Urtiew PA, Brandeis J, and Hogan WJ (1983), Experimental study of flame propagation in semi-confined geometries with obstacles,
Com-Fig 6. A schematic drawing of the ventilation system of Ping-Lin Tunnel (Courtesy of National Expressway Engi-neering Bureau, Ministry of Transportation and Communications, Taiwan).
bustion Sci Tech, 30, 105-119.
[16] Brandeis J (1985), Effect of obstacles on flames, Combustion Sci Tech, 44, 61-73.
[17] Barr PK (1990), Acceleration of a flame by flame-vortex interactions,
Combust Flame, 82, 111-125.
[18] Beard AN and Drysdale DD (1995), A nonlinear model of major fire spread in a tunnel, Fire Safety J, 24, 333-357.
[19] Klote JH and Milke JA (1992), Design of smoke management systems, ASHRAE special publications, Ch 2.
[20] Berl WG and Halpin BM (1976), Fire-related fatalities: An analysis of their demography, physical origins, and medical causes, Fire Standard
and Safety, ASTM STP 614, AF Robertson (ed), 26-54.
[21] Purser DA (1988), Toxicity assessment of combustion products, The
SFPF Handbook of Fire Protection Engineering, CL Beyler (ed), Ch
3, Quincy, MA, Natl Fire Protection Assn.
[22] Spieth HH, Gaume JG, Luoto RE, and Klinck DM (1982), A com-bined hazard index fire test methodology for aircraft cabin materials, Vol I & II, DOT/FAA/CT-82/36-1 and DOT/FAA/CT-82/36-11, At-lantic City NJ, Dept of Transportation.
[23] Malhotra HL (1995), Goods vehicle fire test in a tunnel, Proc Of the
2nd Int Conf On Safety in Road and Rail Tunnels, paper no 28,
237-244, April 1995, Granada, Spain.
[24] Ingason H (1994), HRR measurements in tunnel fires, Proc of Int Conf
on Fires in Tunnels, Boras, Sweden, Oct 1994, 86-103.
[25] Blume G (1994), Smoke and heat production in tunnel fires – Smoke and hot gas hazards, Proc of Int Conf on Fires in Tunnels, Boras, Swe-den, Oct 1994, 138-146.
[26] Hwang CC, Chaiken RF, Singer JM, and Chi DNH (1977), Reverse stratified flow in duct fires: A two-dimensional approach, 16th Symp
(Int) on Combustion, Combustion Inst, Pittsburg, 1385-1395.
[27] Markatos NC, Malin MR, and Cox G (1982), Mathematical modelling of buoyancy-induced smoke flow in enclosures, Int J Heat Mass
Transfer, 25, 63-75.
[28] Kumar S and Cox G (1998), Radiant heat and surface roughness ef-fects in the numerical modelling of tunnel fires, 6th Int Symp on
Aero-dynamics and Ventilation of Vehicle Tunnels, BMRA, The Fluid Eng
Centre.
[29] Kotoh S and Yamanaka G (1991), Air flow analyses in a longitudi-nally ventilated road tunnel on a fire, ASME/JSME Thermal
Engi-neering Proc, 5, 347-354.
[30] Ierotheou CS and Galea ER (1992), A fire field model implemented in a parallel computing environment, Int J for Numer Meth in Fluids, 14, 175-187.
[31] Tabarra M, Kenrick B, and Matthews RD (1996), CFD validation of natural smoke movement in a model tunnel, Fluids Eng Div Conf, ASME, 238, 543-546.
[32] Xue H, Hihara E and Saito T (1993), Turbulence model of fire-induced air flow in a ventilated tunnel, Int J Heat Mass Transfer, 36, 1739-1748.
[33] Xue H, Hihara E and Saito T (1994), Temperature stratification of heated air flow in a fire tunnel, JSME Int J, Series B, 37, 187-194. [34] Xue H, Chew TC and Cheong HF (1995), Transient three-dimensional
fire-induced airflow in a full scale ventilated tunnel, Combust Sci
Tech, 105, 117-129.
[35] Brandeis J and Bergmann DJ (1983), A numerical study of tunnel fires, Combustion Sci Tech, 35, 133-155.
[36] Chow WK (1998), On smoke control for tunnels by longitudinal ven-tilation, Tunnelling and Underground Space Tech, 13(3), 271-275. [37] Woodburn PJ and Britter RE (1996) CFD simulations of a tunnel fire –
Part I, Fire Safety J, 26, 35-62.
[38] Woodburn PJ and Britter RE (1996), CFD simulations of a tunnel fire – Part II, Fire Safety J, 26, 63-90.
[39] PIARC (1992), Fire in road tunnels, Protection for civil engineering structures, electrical circuits and equipment, PIARC Committee on
Road Tunnels, 175.
[40] Benjamin TB (1968), Gravity currents and related phenomena, J Fluid
Mech, 31, 209-248.
[41] Rottman JW and Simpson JE (1983), Gravity currents produced by in-stantaneous releases of a heavy fluid in a rectangular channel, J Fluid
Mech, 135, 95-110.
[42] Fay JA (1969), The spread of oil slicks on a calm sea, In Oil on the
Sea DP Hoult (ed ), 53-63, Plenum, New York.
[43] Hinckley PL (1970), The flow of hot gases along an enclosed shopping mall: a tentative theory,” Fire Research Note no. 807, Fire Res Station. [44] Hwang CC and Wargo JD (1986), Experimental study of thermally generated reverse stratified layers in a fire tunnel, Combust Flame, 66, 171-180.
[45] Thomas PH (1958), The movement of buoyant fluid against a stream and the venting of underground fires, Fire Research Note 351/1958, Fire Research Station, Borehamwook, Herts, England.
[46] Thomas PH (1968), The movement of smoke in horizontal passages against an air flow, Fire Research Note 723/1968, Fire Research Sta-tion, Borehamwook, Herts, England.
[47] Lea CJ, Bettis RJ, and Jagger SF (1995), A review of available data models for tunnel fires, HSE Project Report, IR/L/FR/94/12, Health and Safety Executive, UK.
[48] Kennedy WD (1996), Critical velocity: Past, present and future, One Day Seminar, Smoke and Critical Velocity in Tunnels,. JFL Lowndes (ed), London, UK, April.
[49] Kennedy WD, Gonzalez JA, and Sanchez JG (1996), Derivation and application of the SES critical velocity equations, Paper H-0053,
ASHRAE J, Summer.
[50] Lee CK, Chaiken RF, and Singer JM (1979) Interaction between duct fires and ventilation flow: An experimental study, Combust Sci Tech, 20, 59-72.
[51] Kennedy WD (1995), Memorial Tunnel Fire Ventilation Test Program, Comprehensive test report, Bechtel/Parsons Brinckerhoff Inc., pre-pared for Massachusetts Highway Dept.
[52] Kwack EY, Bankston CP, Shakkottai P, and Back LH (1991), On the reverse flow ceiling jet in pool fire-ventilation cross flow interactions in a simulated aircraft cabin interior, J Heat Transfer, ASME Trans, 113, 446-450.
[53] Oka Y, Atkinson GT, Jagger SF and Deall A (1996), Control of smoke flow in tunnel fires, Fire Safety J, 25, 305-322.
[54] Bettis RJ, Jagger SF, and Wu Y (1993), Interim validation of tunnel fire consequence models: summary of phase 2 tests, Health and Safety Lab Project Report IR/L/FR/93/11.
[55] Bakke P and Leach SJ (1960), Methane roof layers, Safety in Mines
Research Establishment, Research Report No 195, Buxton, England.
[56] Atkinson GT and Wu Y (1996), Smoke control in slopping tunnels,
Fire Safety J, 27, 335-341.
[57] Oka Y and Atkinson GT (1995) Control of smoke flow in tunnel fires,
Fire Safety J, 25, 305-322.
[58] Berner MA and Day JR (1991), A new concept for ventilation long twin-tube tunnels, 7th Int Symp on Aero and Vent of Vehicle Tunnels, Brighton, UK, 811-820.
[59] D’Albrand N and Bessiere C (1992), Fire in a road tunnel: comparison of tunnel sections, In Proc 1st Int Conf on Safety in Road and Rail
Tunnels, Basel, Switzerland, 439-449.
[60] Ishida M, Mori T, Nishimori S, and Fukuhara M (1995), Optimal computer control of Kakuto road tunnel ventilation system, Company Report, Matsushita Ind Equip Co, Ltd.
___________________________________________________________________________________________________________________________ Falin Chen received his PhD from the University of Arizona and joined the faculty of Na-tional Taiwan University in 1989, where he was promoted to full professor in 1994. His re-search interest focuses mainly on hydrodynamic stability, applied to various engineering disciplines, such as alloy casting, film coating, and underground water motion. Recently, he has devoted himself to the research of the ventilation of road tunnels and subway sys-tems because of the booming infrastructure development in Taiwan. Due to his contribu-tion to this engineering research, the Ministry of Communicacontribu-tion and Transportacontribu-tion of Taiwan granted him the Superior Research Award in 1997, and the Society of Chinese En-gineers chose him as the Distinguished Engineering Professor of the year 2000.