Development of Probabilistic Response Spectra in Kinmen
許宗傑
1陳冠雄
2* 1國立金門大學土木與工程管理系助理教授(89250 金門縣金寧鄉大學路一號)
2國立金門大學土木與工程管理系副教授(89250 金門縣金寧鄉大學路一號)
*[email protected]
Chung-Chieh Hsu
1Kuan-Hsoung Chen
2*1 Assistant Professor, Department of Civil and Construction Engineering, National
Quemoy University, Taiwan
2
Associate Professor, Department of Civil and Construction Engineering, National
Quemoy University, Taiwan
*
Kuan-Hsoung Chen: [email protected]
ABSTRACT
Site response spectra are important in seismic design. The scope of this study is to develop probabilistic response spectra in Kinmen. A nonlinear time history analysis is performed to achieve the site amplification factors. Input seismic waves at bedrocks propagate through various soil layers to reach ground surface with amplifying in amplitudes. The soil profiles adopted in this study are based on the boreholes at various locations along the Kinmen low-rised cable-stayed bridge. The uncertainties of wave shear velocities are in terms of different soil formulation in Taiwan. The simulated response spectra are compared with those in seismic design codes to verify its local site effects.
Keywords: Site response spectra; site amplification factors; nonlinear time history analysis.
1. Introduction
Kinmen is a subduction zone as shown in Figure 1. Kinmen struck at least three destructive earthquakes with magnitude greater than seven since 1600 [1]. The Binhai fault of NE South China Sea runs a length of roughly 500 km through Taiwan Strait in the south of Kinmen. This fault has a shortest distance of 25 km to Kinmen and its depth of focus is ranging from 50 km to 60 km [2]. However, the last destructive earthquake dates back to the pre-instrumental era and hence there is an absence of recorded strong ground motions from earthquakes on the faults located nearest to Kinmen. Therefore, this research will conduct a nonlinear simulation of seismic ground excitations.
The simulation of earthquakes requires a simultaneous consideration of effects of region-specific earthquake source, propagation path, and local site effects. Several studies in the literature have dealt with the spatial variability of soil properties [3-10]. However, due to the current shortages of an acceptable level of scientific information related to this area, this research will focus on the probabilistic design response spectra with uncertainty of empirical shear velocities with local site effects. The scope of this study is to develop probabilistic response spectra in Kinmen and to compare with design spectra in the current seismic design code.
2. Generation of Synthetic Accelerograms
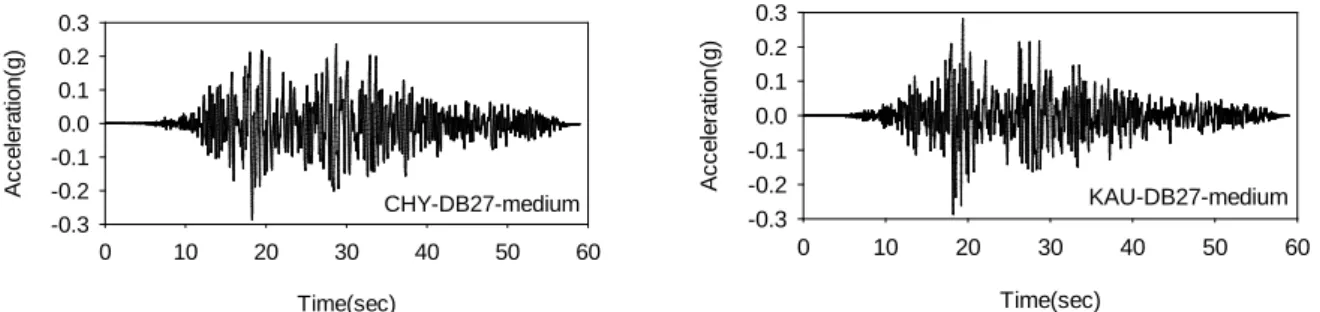
One-dimensional (1D) site response analysis methods are widely used to quantify the effect of soil deposits on propagated ground motion. This study uses DEEPSOIL to generate the synthetic ground excitations [11]. The soil deposit can be assumed to be consisted by the plane parallel layers with the information of borehole logs of geotechnical and geophysical investigation from the site of the Kinment low-rised cable-stayed bridge [12]. The site is not inclined to topographic amplification effects. The shear velocities of stratigraphic layers for the evaluation of site response are based on empirical S-wave velocity equations of seven regions in Taiwan, which includes 1645, 1728 samples, for sand and clay sites, respectively [13]. In this pilot study, the borehole DB27 is selected as an illustrated example. The uncertainties in various site conditions are incorporated to evaluate shear wave velocities in the borehole DB27, as shown in Figure 2. The shear velocity at outcrop is served as input ground excitation at the bedrock. The cracked and weathered effects of rock at outcrop are neglected in this research. The accelerograms of simulated earthquakes with various empirical equations are presented in Figures 3-4 for medium and hard sites, respectively. The frequency contents of accelerations are in terms of Fourier amplitudes on medium and hard sites as depicted in Figure 5. The accelerations in the frequency domain reveal that the medium site predominated frequency is below 3 Hz, whereas those on the hard site are more pronounced in 1.5 Hz and 5 Hz.
3. Site Amplification Factors
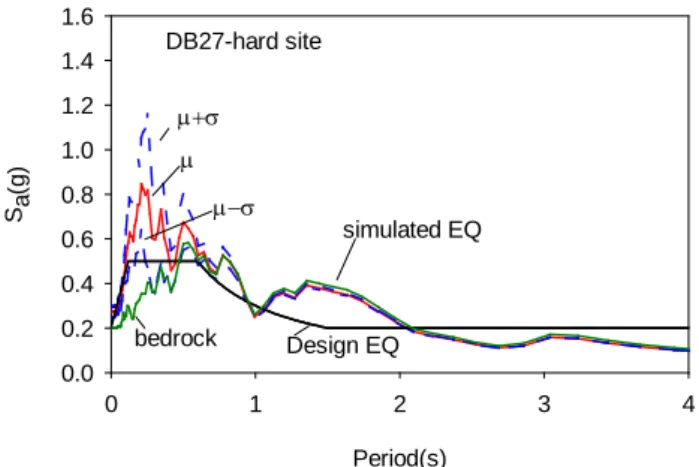
Generated strong ground motion contains the inherent properties of randomness in the generation procedures. The variations of shear wave velocities are accounted to generate acceleration response spectrum as shown in Figure 6. The acceleration response spectrum shows an increase in amplification on hard site. The amplifications of responses start at periods as low as 0.2 s and extend to 0.8 s with an average value of 2, from the spectrum of the bedrock to the mean response spectrum of the ground surface. However, no amplification in simulated spectrum appears when the period greater than 0.8 s. It is worth noting that the generating spectrum has a higher amplification up to 50% than those specified in the current seismic design code.
4. Concluding Remarks
This research investigated the empirical relationship between site response nonlinearity, soil properties, and ground motion characteristics as a pilot study to enable efficient integration of nonlinear analyses in broadband ground motion simulations. A quantitative measure of how strong nonlinear effects are anticipated at a site during a seismic event. The shear velocities of stratigraphic layers for the evaluation of site response are based on empirical S-wave velocity equations of seven regions in Taiwan for sand and clay sites. In this pilot study, the uncertainties in various site conditions are incorporated to evaluate shear wave velocities in the borehole. A suite of synthetic ground accelerations is achieved with nonlinear soil properties. The corresponding acceleration spectra are also developed.
The importance of the uncertainty on the empirical S-wave velocity equations can be incorporated in the ground excitation simulation. The simulated ground excitations can be implemented to perform a nonlinear time history analysis of Kinmen low-rised cable-stayed bridges. The current seismic design response spectra are underestimated site amplification with a period less than 0.8 s.
References
1. Zhao Ming-hui, QrU Xue, Xia Kan-yuan, Ye Chun—ming (2003). The situation and prospect of the research of the Binhai fault of NE South China Sea. South China Journal of Seismology, Vol. 23, No. 1,
March, 2003.
2. Chang Z-Chung et al. (2009). Effect of Taiwan Strait seismic activity to mainland China. ACTA
Seismologica SINICA, Vol. 23, No. 3, 2009.
3. Zhu Jin-Fang et al.(2004). Seismic risk of Fu-Chun active faults. Science Publication Inc.
4. Fenton GA. Estimation for stochastic soil models. ASCE J Geotech Geoenviron Eng 1999;125:470–85.
5. Alonso Rodriguez AF. Development of a two dimensional, stochastic methodology to assess seismic site response. MSc Thesis. ROSE School (IUSS Pavia, Italy); 2008.
6. Assimaki D, Pecker A, Popescu R, Prevost J. Effects of spatial variability of soil properties on surface ground motion. J Earthquake Eng 2003;7(SI 1):1–44.
7. Faccioli E. A stochastic approach to soil amplification. Bull Seismol Soc Am 1976;66(4):1277–91.
8. Bazzurro P, Cornell A. Ground-motion amplification in nonlinear soil sites with uncertain properties. Bull Seismol Soc Am 2004; 94(6):2090–109.
9. Andrade JE, Borja RI. Quantifying sensitivity of local site response models to statistical variations in soil properties. Acta Geotechnica 2006;1:3–14.
10. Nour A, Slimani A, Laouami N, Afra H. Finite element model for the probabilistic seismic response of
heterogeneous soil profile. Soil Dyn Earthquake Eng 2003; 23:331–48.
11. Hashash, Y.M.A, Groholski, D.R., Phillips, C. A., Park, D, Musgrove, M. (2011). DEEPSOIL 5.0, User
Manual and Tutorial. 107 p.
12. CECI. Design Sheets of Kinment low-rised cable-stayed bridge. CECI ENGINEERING CONSULTANTS, INC., TAIWAN
13. C-H Kuo, K-L Wen, , H-H Hsieh, C M Lin, T-M Chang, K-W Kuo. Site classification and Vs30
estimation of free-field TSMIP stations using the logging data of EGDT. Engineering Geology, Volumes 129–130, 19 March 2012, Pages 68-75
Figure 1 Binhai Fault Belt of South China Sea (after Zhao, 2003). shear velocity(m/s) 150 200 250 300 350 400 450 500 550 d e pt h( m ) 0 5 10 15
Figure 2 Various empirical shear wave velocity profiles.
Time(sec) 0 10 20 30 40 50 60 A c c el er a ti on (g ) -0.3 -0.2 -0.1 0.0 0.1 0.2 0.3 CHY-DB27-medium Time(sec) 0 10 20 30 40 50 60 A c c el er a ti on (g ) -0.3 -0.2 -0.1 0.0 0.1 0.2 0.3 KAU-DB27-medium
Time(sec) 0 10 20 30 40 50 60 A c c el er a ti on (g ) -0.3 -0.2 -0.1 0.0 0.1 0.2 0.3 HWA-DB27-hard Time(sec) 0 10 20 30 40 50 60 A c c el er a ti on (g ) -0.3 -0.2 -0.1 0.0 0.1 0.2 0.3 ILA-DB27-hard Time(sec) 0 10 20 30 40 50 60 A c c el er a ti on (g ) -0.3 -0.2 -0.1 0.0 0.1 0.2 0.3 TAP-DB27-hard Time(sec) 0 10 20 30 40 50 60 A c c el er a ti on (g ) -0.3 -0.2 -0.1 0.0 0.1 0.2 0.3 TCU-DB27-hard Time(sec) 0 10 20 30 40 50 60 A c c el er a ti on (g ) -0.3 -0.2 -0.1 0.0 0.1 0.2 0.3 TTN-DB27-hard Time(sec) 0 10 20 30 40 50 60 A c c el er a ti on (g ) -0.3 -0.2 -0.1 0.0 0.1 0.2 0.3 taiwan-DB27-hard
Figure 4 Simulated ground excitations with various shear velocities on hard sites
Frequency(Hz) 0 2 4 6 8 10 F o u ri e r A m pl it ud e (g-s e c ) 0.0 0.1 0.2 0.3 0.4 0.5 boredhole-DB27 medium CHY(200 m/s) hard TCU(488 m/s)
Period(s) 0 1 2 3 4 Sa (g ) 0.0 0.2 0.4 0.6 0.8 1.0 1.2 1.4 1.6 DB27-hard site µ+s µ-s µ simulated EQ Design EQ bedrock