Recently, type 2 diabetes mellitus (DM) become pandemic as a result of aging, change in lifestyle, and obesity. In 2000, people with DM were estimated to be 171 million. Within 30 years, people with DM are predicted to double, to become 366 million in 2030 [1]. A significant proportion of people with DM are asymptomatic and undiagnosed, who are often identified after complications have developed [2]. These impose a heavy burden on personal and public health.
Early detection of DM may improve health outcome through prompt health intervention. Screening for DM
The performance of risk scores and hemoglobin A1c to find
undiagnosed diabetes with isolated postload hyperglycemia
Hung-Yuan Li1), Mao-Shin Lin1), 2), Shyang-Rong Shih1), Cyue-Huei Hua3), Yu-Lai Liu4),Lee-Ming Chuang1), 2), 5), Fung-Chang Sung6), Ming-Fong Chen1), Jin-Chuan Lee7), Ching-Hsiang Chiao8) and Jung-Nan Wei8)
1) Department of Internal Medicine, National Taiwan University Hospital, Taipei, Taiwan
2) Graduate Institute of Clinical Medicine, Medical College, National Taiwan University, Taipei, Taiwan 3) Division of clinical pathology‚ National Taiwan University Hospital Yun-Lin Branch, Yun-Lin, Taiwan 4) Department of Nutrition, National Taiwan University Hospital Yun-Lin Branch, Yun-Lin, Taiwan
5) Graduate Institute of Preventive Medicine, National Taiwan University School of Public Health, Taipei, Taiwan 6) Institute of Environmental Health, China Medical University College of Public Health 404, Taichung, Taiwan 7) Southern Taiwan University, Tainan, Taiwan
8)Chia Nan University of Pharmacy and Science, Tainan, Taiwan
Abstract. The aim of this study is to develop strategies to screen diabetic subjects with isolated postload hyperglycemia (IPH)
in Chinese population. We included 1175 adult subjects who did not report diabetes were included. Diabetes was diagnosed by oral glucose tolerance tests. IPH was defined as fasting plasma glucose (FPG)<7 mmol/L and 2-hour post-load plasma glucose (2hPG) greater than 11.1 mmol/L. Using FPG criteria, only 59.8% of diabetic subjects were not identified, showing a poor agreement between FPG and 2hPG criteria (kappa 0.294). Age, FPG, total cholesterol, triglycerides, blood pressure, body mass index, HbA1c and medication for hypertension were associated factors for IPH. Four scores were constructed using all these factors, age and blood test results, age and HbA1c, and data from non-invasive examinations, respectively. The area under the ROC curve were 0.9296(95%CI 0.8948-0.9643), 0.9111(95%CI 0.8713-0.9508), 0.8902(95%CI 0.8341-0.9646), 0.8924(95%CI 0.7835-0.8753), and 0.8654(95%CI 0.7963-0.9345) for score 1, 2, 3, 4, and HbA1c, respectively. The sensitivity of all four risk scores to detect IPH was better than that of impaired fasting glucose (IFG). The sensitivity and specificity of HbA1c at cutoff 6.2% for detecting IPH was also better than that of IFG. In conclusion, the risk scores and HbA1c are useful to identify subjects with undiagnosed IPH, with better performance than IFG.
Key words: Isolated postload hyperglycemia, Risk score, Impaired fasting glucose
is therefore suggested under certain circumstances. Many reports developed risk scores to identify subjects with undiagnosed DM to receive standard 75-gram oral glucose tolerance test (OGTT) [3-8]. The European Association for the Study of Diabetes and the European Society of Cardiology recommended that primary screening should be done by non-invasive risk scores followed by confirmatory OGTT [9]. The American Diabetes Association (ADA) suggested that subjects older than 45 years or subjects with obesity plus an additional risk factor should be screened for diabetes, by either fasting plasma glucose (FPG) tests or OGTT[10]. Although OGTT is gold standard to diagnose DM, measuring FPG is preferred in clinical settings because it is easier to perform, more convenient for subjects being examined, and less expensive than OGTT. Therefore, FPG test is recommended by the Received Jan. 5, 2011; Accepted Mar. 11, 2011 as K11E-005
Released online in J-STAGE as advance publication Apr. 14, 2011 Correspondence to: Jung-Nan Wei, Ph.D., Professor, Department of Occupational Safety and Health, Chia Nan University of Pharmacy and Science, 60, Erh-Jen RD., Sec.1, Jen-Te, Tainan 717, Taiwan. E-mail: wei.j5209@msa.hinet.net
O
riginalMethods
Body height and weight were recorded to the nearest 0.5cm and 0.1 kg, respectively. BMI was derived from body weight in kilogram divided by the square of body height in meters. Waist and hip circumferences were measured in standard way to the nearest 0.1cm. Waist to hip ratio (WHR) was calculated by divided waist by hip circumference. Blood pressure was recorded by a mer-cury sphygmomanometer to the nearest 2 mm-Hg with the arm supported at heart level after sitting quietly for 10 minutes. Trained nurses took three separate readings at 1-minute intervals. The average of the second and the third readings was used for analysis. A standard 75-gram OGTT was performed for measurements of fasting and 2hPG after fasting at least 8 hours.
Plasma glucose and fasting serum total cholesterol (TC), triglycerides (TG), high-density lipoprotein cho-lesterol (HDL-C), low-density lipoprotein chocho-lesterol (LDL-C) were measured with an automatic analyzer (Toshiba TBA 200 FR, Toshiba Medical Systems Co., Ltd., Tokyo, Japan). LDL-C was measured directly by enzymatic assay (Denka Seiken Co. Ltd, Tokyo, Japan). Briefly, after elimination of chylomicron, very-low-density lipoprotein cholesterol, and HDL-C, LDL-C was determined by chemical reactions catalyzed by cholesterol esterase, cholesterol oxidase, and peroxidase, followed by measuring quinine pigment photometrically.
Definitions
Normal (FPG<5.5 mmol/L and 2hPG<7.8 mmol/L), IFG (FPG 5.6-6.9 mmol/L), IFG and/or impaired glucose tolerace (IGT) (FPG 5.6-6.9 mmol/L and/or 2hPG 7.8-11.0 mmol/L) and DM (FPG ≥7 mmol/L and/ or 2hPG ≥11.1 mmol/L) were diagnosed and classified according to criteria of the ADA [23] and WHO [12] by the results from OGTT. IPH was defined as FPG <7 mmol/L and 2hPG ≥11.1 mmol/L.
Hypertension was defined if the systolic blood pres-sure was higher than 140 mmHg, or the diastolic blood pressure was greater than 90 mmHg, or the subject was taking medication for hypertension. Family history of DM was defined that parents, grandparents or sibling had diabetes.
Statistical analysis
Data were presented as the mean and standard deviation (SD) for continuous variables, and as a percentage for categorical variables. One-way analysis World Health Organization (WHO) and the International
Diabetes Federation (IDF) [11, 12]. Previous studies have demonstrated that hemoglobin A1c (HbA1c) was an alternative screening tool for detecting DM [13, 14]. In Taiwan, the National Health Insurance Program, implemented since March 1995 to cover over 96% of Taiwanese population [15], routinely offers health examination at 3-year intervals beginning at age 40 years for whole population. Fasting plasma glucose (FPG) was used to detect DM in this program.
Many reports have shown that the agreement was low between screening diabetes by FPG tests and OGTT [16-20]. There was high prevalence of diabetes with isolated postload hyperglycemia (IPH) (FPG<7 mmol/L and 2-hour-postload glucose, 2hPG, ≥11.1 mmol/L), especially in the elderly [19]. In other words, subjects with IPH will not be diagnosed correctly by FPG test only, if subsequent OGTT is not done. Therefore, the WHO suggested that subjects with impaired fasting glucose (IFG), i.e. FPG 6.1-6.9 mmol/L, should have an OGTT if resources allowed [12]. The ADA and IDF have similar recommendation with a modification of the IFG definition to be FPG 5.6-6.9 mmol/L [10, 11]. To our best knowledge, there is no report evaluating the performance of IFG in screening subjects with IPH. There was a report demonstrating that using FPG to find subjects with 2hPG ≥11.1 mmol/L is specific but is not sensitive [20]. They also found that the optimal FPG cutoff was influenced by age, gender, body mass index (BMI), and the presence of hypertension.
Therefore, the aim of the present study is to develop a strategy to find subjects with IPH. Simple risk scores were constructed by important risk factors of IPH, including age, BMI, hypertension, and/or data from blood tests. The performance of these risk scores, HbA1c and IFG in screening subjects with IPH was compared.
Materials and Methods
Subjects
During 2006-2009, subjects aged 20 years and above, who did not report diabetes during the interview, were invited to participate in this study (Taiwan Lifestyle Study) [21, 22]. Written informed consent was obtained from each individual, and the study was reviewed and approved by the Institutional Review Board.
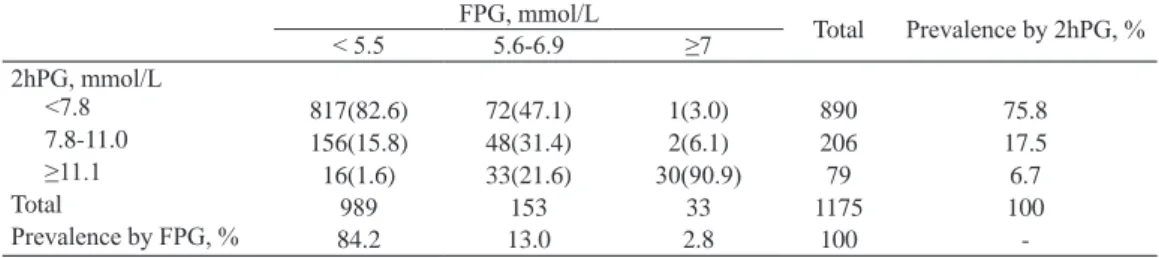
to FPG and 2hPG diagnostic criteria. Of the 1175 participants, 33 subjects (2.8%) were diagnosed as DM according to results from FPG tests; while 79 subjects (6.7%) had DM according to results from 2hPG criteria. There were 82 subjects with DM based on the results of OGTT. Among them, only 40.2% (33 subjects) were diagnosed correctly by FPG tests. In other words, to diagnose DM by FPG test missed 59.8% (49 subjects) of people with DM in this population. Among subjects with FPG <5.5, 5.6-6.9, and ≥7 mmol/L, the percentages of subjects diagnosed as DM by 2hPG ≥11.1 mmol/L are 1.6%, 21.6%, and 90.9%, respectively. The agreement between criteria to diagnose DM by FPG and 2hPG was not good, with the kappa statistic 0.294 (95%CI 0.235-0.353).
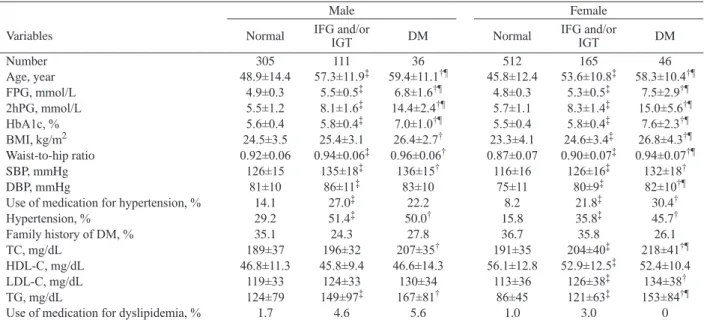
Table 2 shows the demographic and biochemical characteristics among subjects with normal, IFG and/ or IGT, and DM. Subjects with diabetes were older and had a higher HbA1c, BMI, waist-to-hip ratio, SBP, hypertension rate, TC and TG than subjects with normal glycemia in both sexes. Similar trend was observed between subjects with normal glycemia and IFG and/or IGT. There were 22 subjects (1.9%) who were taking medications for dyslipidemia. The percentages of subjects who were taking medications for dyslipidemia were not statistically different among subjects with euglycemia, IFG and/or IGT, and diabetes.
There were 1142 subjects whose FPG were less than 7 mmol/L, including 49 subjects with IPH. Their data were used to assess the associated factors of IPH. As shown in Table 3, age, FPG, TC, TG, SBP, DBP, BMI, HbA1c and medication for hypertension were associated factors for IPH. Four models were constructed. In model 1 (full model), age, FPG, TG, BMI and HbA1c remained to be significant related factors after controlling other factors. In model 2 (blood test model), age, FPG and TG were significant after other factors were adjusted. In model 3, HbA1c was strong associated with detecting IPH after adjusting of variance (ANOVA) and chi-square tests were used
to identify the differences in various demographic and metabolic characteristics among normal, IFG and/ or IGT, and DM. The Bonferroni method was used for post-hoc comparisons in ANOVA. The weighted kappa statistic was used for the degree of agreement between FPG and 2hPG to diagnose diabetes.
Odds ratios (OR) and the 95% confidence inter-vals (CI) for IPH were derived from univariate and multivariate logistic regression models, using subjects with FPG <7 mmol/L and 2hPG <11.1 mmol/L as the reference group (OR=1). Multivariate logistic regression was performed to construct models for IPH. These models were used to construct risk scores, defined as followed.
Risk score = β1X1+β2X2+………+βnXn
β1………βn: logistic regression coefficient
X1………Xn: variable
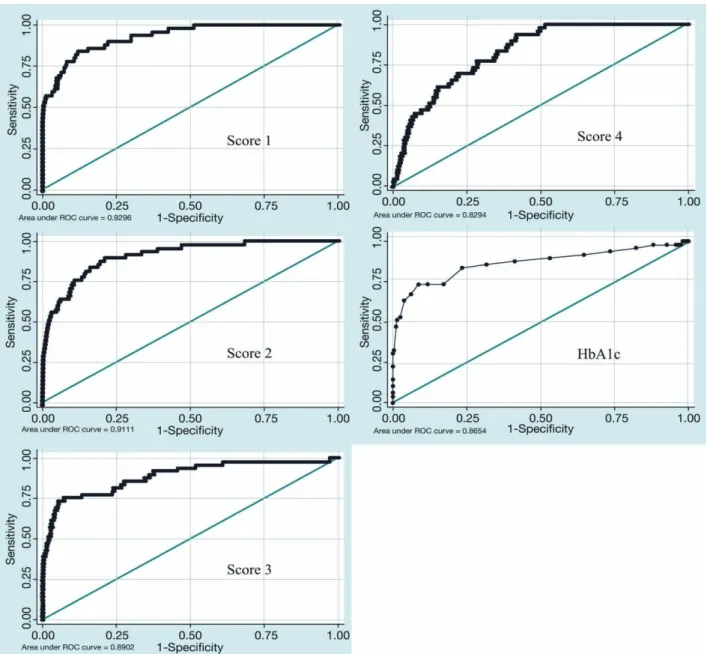
Subsequently, we evaluate the performance of the risk scores by calculating the area under the Receiver-Operator curve (ROC curve) as a measure of diagnosis accuracy. Optimal cutoff point was derived from the ROC curve with shortest distance to sensitivity =1 and 1-specificity =0. The sensitivity of a risk score is the probability that the prediction is positive for subjects with IPH. The specificity of a risk score is the probability that the prediction is negative for subjects without IPH. The performance of IFG and HbA1c for detecting IPH were also calculated.
A p-value below 0.05 was considered significant. The statistical analyses were performed with SPSS 13.0 (SPSS Inc., Chicago, IL) and Stata/SE 9.0 for Windows (StataCorp LP, Texas).
Results
A total of 1175 subjects, aged 20-88 years, including 452 males and 723 females, were included in this study. Table 1 showed the distribution of people according
table 1 Comparison of FPG and OGTT 2-hour postload glucose (2hPG) diagnostic categories for those
without reported diabetes.
FPG, mmol/L Total Prevalence by 2hPG, %
< 5.5 5.6-6.9 ≥7 2hPG, mmol/L <7.8 817(82.6) 72(47.1) 1(3.0) 890 75.8 7.8-11.0 156(15.8) 48(31.4) 2(6.1) 206 17.5 ≥11.1 16(1.6) 33(21.6) 30(90.9) 79 6.7 Total 989 153 33 1175 100 Prevalence by FPG, % 84.2 13.0 2.8 100
table 3 Univariate and multivariate logistic regression analyses for factors associated with IPH.
Univariate
analysis Model 1 Model 2 Model 3 Model 4
variable OR(95% CI)† OR(95% CI)‡ OR(95% CI)‡ OR(95% CI)‡ OR(95% CI)‡
Number, diabetes/non-diabetes 49/1093 49/1093 49/1093 49/1093 49/1093 Age 1.08* (1.06-1.11) 1.06* (1.02-1.11) 1.08* (1.05-1.12) 1.05* (1.01-1.08) 1.08* (1.05-1.11) Sex Male 1.70 (0.96-3.01) Female 1 FPG, mmol/L 15.5* (8.80-27.2) 4.73* (2.26-9.90) 12.3* (6.69-22.6) TC, mmol/L 1.69* (1.27-2.23) 1.20 (0.81-1.76) 1.33 (0.94-1.89) TG, mmol/L 1.51* (1.26-1.80) 1.48* (1.12-1.94) 1.59* (1.25-2.02) SBP 1.04* (1.02-1.05) 1.01 (0.99-1.04) 1.02*(1.00-1.04) DBP 1.04*(1.01-1.06) BMI, mg/m2 1.15* (1.06-1.24) 1.11* (1.03-1.19) 1.14* (1.05-1.22)
Medication for hypertension
No 1 1 1 Yes 2.25* (1.17-4.35) 0.99 (0.41-2.42) 0.79 (0.38-1.22) Family history of DM No 1 Yes 0.48* (0.24-0.97) Use of alcohol No 1 Yes 1.01(0.50-2.06) Smoking No 1 Yes 1.21 (0.61-2.41) HbA1c 39.2*(18.7-82.3) 8.60*(3.67-20.1) 29.7* (13.9-63.4)
* p<0.05 †: odds ratio by univariate logistic regression. ‡: odds ratio by multivariate logistic regression. 2hPG, 2-hour postload plasma glucose; BMI, body mass index; DBP, diastolic blood pressure; DM, diabetes mellitus; FPG, fasting plasma glucose; HDL-C, high-density lipoprotein cholesterol; LDL-C, low-high-density lipoprotein cholesterol; SBP, systolic blood pressure; TC, total cholesterol; TG, triglyceride.
table 2 Demographic and biochemical characteristics among subjects with normal glycemia, impaired fasting glucose (IFG) and/or
impaired glucose tolerance (IGT), and DM.
Male Female
Variables Normal IFG and/or IGT DM Normal IFG and/or IGT DM
Number 305 111 36 512 165 46 Age, year 48.9±14.4 57.3±11.9‡ 59.4±11.1†¶ 45.8±12.4 53.6±10.8‡ 58.3±10.4†¶ FPG, mmol/L 4.9±0.3 5.5±0.5‡ 6.8±1.6†¶ 4.8±0.3 5.3±0.5‡ 7.5±2.9†¶ 2hPG, mmol/L 5.5±1.2 8.1±1.6‡ 14.4±2.4†¶ 5.7±1.1 8.3±1.4‡ 15.0±5.6†¶ HbA1c, % 5.6±0.4 5.8±0.4‡ 7.0±1.0†¶ 5.5±0.4 5.8±0.4‡ 7.6±2.3†¶ BMI, kg/m2 24.5±3.5 25.4±3.1 26.4±2.7† 23.3±4.1 24.6±3.4‡ 26.8±4.3†¶ Waist-to-hip ratio 0.92±0.06 0.94±0.06‡ 0.96±0.06† 0.87±0.07 0.90±0.07‡ 0.94±0.07†¶ SBP, mmHg 126±15 135±18‡ 136±15† 116±16 126±16‡ 132±18† DBP, mmHg 81±10 86±11‡ 83±10 75±11 80±9‡ 82±10†¶
Use of medication for hypertension, % 14.1 27.0‡ 22.2 8.2 21.8‡ 30.4†
Hypertension, % 29.2 51.4‡ 50.0† 15.8 35.8‡ 45.7† Family history of DM, % 35.1 24.3 27.8 36.7 35.8 26.1 TC, mg/dL 189±37 196±32 207±35† 191±35 204±40‡ 218±41†¶ HDL-C, mg/dL 46.8±11.3 45.8±9.4 46.6±14.3 56.1±12.8 52.9±12.5‡ 52.4±10.4 LDL-C, mg/dL 119±33 124±33 130±34 113±36 126±38‡ 134±38† TG, mg/dL 124±79 149±97‡ 167±81† 86±45 121±63‡ 153±84†¶
Use of medication for dyslipidemia, % 1.7 4.6 5.6 1.0 3.0 0
†indicates a significant difference (p<0.05) between normal and DM by ANOVA with post-hoc comparison for male and female separately. ‡indicates a significant difference (p<0.05) between normal and IFG and/or IGT by ANOVA with post-hoc comparison for male and female separately. ¶ indicates a significant difference (p<0.05) between IFG and/or IGT and DM by ANOVA with post-hoc comparison for male and female separately. BMI, body mass index; DBP, diastolic blood pressure; FPG, fasting plasma glucose; SBP, systolic blood pressure; TC, total cholesterol; TG, triglyceride.
Score 3: DM=0.047×Age + 3.390×HbA1c
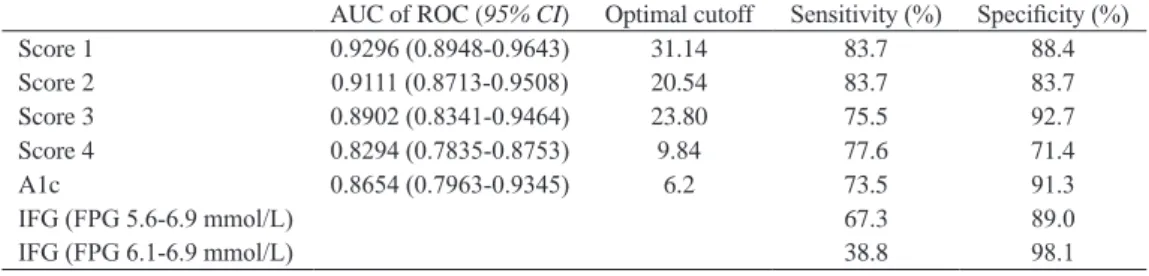
Score 4: DM=0.074×Age + 0.020×SBP + 0.126×BMI - 0.238 if use of drugs for hypertension The area under the ROC curve (AUC) of score 1, 2, 3, 4 and HbA1c were 0.9296 (95%CI 0.8948-0.9643), 0.9111 (95%CI 0.8713-0.9508), 0.8902 (95%CI 0.8341-0.9464), 0.8294 (95%CI 0.7835-0.8753), and 0.8654 (0.7963-0.9345), respectively (Table 4 and Fig. 1). As shown in Table 4, sensitivity of these four scores and HbA1c were higher than the sensitivity of IFG, both defined by FPG 5.6-6.9 mmol/L and defined by FPG 6.1-6.9 mmol/L. The specificity for score 1, 2, 3, 4 and HbA1c were 88.4%, 83.7%, 92.7%, 71.4%, and 91.3%. age. In model 4 (non-invasive model), age, SBP and
BMI remained significant after adjustment.
We constructed fourth risk scores, derived from multivariate logistic models in table 3, for predicting subjects with IPH. The risk scores were described as followed.
Score 1: DM=0.062×Age(year) + 1.555×FPG(mmol/L) + 0.178×TC (mmol/L)+ 0.389×TG(mmol/L) + 0.013×SBP(mm-Hg) + 0.104×BMI(kg/m2)
- 0.008 if use of drugs for hypertension + 2.151×HbA1c(%)
Score 2: DM=0.081×Age + 2.508×FPG + 0.285×TC + 0.462×TG
be performed to find undiagnosed IPH, especially in elderly populations.
The WHO recommended that those with IFG should have an OGTT to ascertain diabetes [12]. The performance of IFG by WHO, i.e. FPG 6.1-6.9 mmol/L, as a screening test for IPH was poor in our study. The sensitivity and specificity were 38.8% and 98.1%, respectively (Table 4), which was similar to the results reported previously in Asian population [20]. Using modified definition of IFG by ADA and IDF, i.e. FPG 5.6-6.9 mmol/L, the sensitivity and specificity were 67.3% and 89.0%, respectively (Table 4). Apparently, the IFG criterion is a specific but insensitive test for IPH in Chinese population, suggesting that the performance of IFG criterion is not good as a screening tool. These results could be explained biologically and epidemiologically. Biologically, the pathophysiology of IFG is different from impaired glucose tolerance or IPH [27]. Subjects with IFG have severe insulin resistance in liver with normal or near-normal insulin sensitivity in muscle. In contrast, subjects with impaired glucose tolerance or IPH have severe muscle insulin resistance with only mild hepatic insulin resistance. Epidemiologically, as shown in Table 3, 2hPG is not only associated to FPG, but also to age, BMI, HbA1c and the other factors. In this study, the sensitivity and specificity for HbA1c at cutoff 6.2% were 73.5% and 91.3%, respectively, which were both better than IFG. Therefore, HbA1c may be an alternative and simple choice for screening IPH.
Based on the four risk scores constructed in this study, we would like to discuss screening strategy for IPH. Score 4 was calculated by data from non-invasive examinations, such as age, systolic blood pressure, BMI, and medication for hypertension. If one-visit screening strategy is preferred and FPG test only is still considered, score 4 could be used to decide if a subject should receive an OGTT or FPG test only. On the other hand, if sequential screening strategy is preferred, i.e.
Discussion
In the present study, we found that the agreement between criteria using FPG and 2hPG to diagnose DM was not good, which was in concordance with previous reports. A total of 59.8% subjects with DM were missed if we used FPG tests only to diagnose DM. Age, FPG, TC, TG, blood pressure, BMI, HbA1c and medication for hypertension were associated risk factors for IPH. The four risk scores and HbA1c had better performance to find subjects with IPH than IFG.
We found that the overall rates of undiagnosed DM were 2.8% according to FPG-based criteria and 6.7% according to 2hPG-based criteria (Table 1). The agreement between the two criteria was not good. In the Strong Heart Study (SHS), they reported a 1.5% more subjects with DM diagnosed by 2hPG than FPG criteria, supporting our findings [16]. Similarly, in the Guía Study (GS), they found a 2.8% difference between the 2 criteria [18]. As shown in Asian population in DECODA study [24] or African population in another study [25], the difference varied when different populations were studied. We also found a significant portion of subjects (4.2%) with undiagnosed DM (IPH) in this population. Using FPG test only, 59.8% of subjects with DM were not identified. A study on Japanese-American men also demonstrated that 66.1% (341/516) of subjects were not identified by FPG tests only [19]. Compared with data from Asian populations, rates of IPH from western countries were lower but still high enough [16-18, 25], 29.0% (154/531) in the SHS [16], 19.7% (27/137) in the GS [18], and 41.1% (125/304) in the Third National Health and Nutrition Examination Survey (NHANES III) [17].
In present study, age was found to be an important risk factor for IPH, which was supported by the findings in NHANES III [17]. Indeed, a study on elderly aged 65-100 years showed a higher prevalence of IPH [26]. Therefore, we strongly suggest that OGTT should
table 4 Comparison of different scores and criteria used to screen isolated postload hyperglycemia.
AUC of ROC (95% CI) Optimal cutoff Sensitivity (%) Specificity (%)
Score 1 0.9296 (0.8948-0.9643) 31.14 83.7 88.4 Score 2 0.9111 (0.8713-0.9508) 20.54 83.7 83.7 Score 3 0.8902 (0.8341-0.9464) 23.80 75.5 92.7 Score 4 0.8294 (0.7835-0.8753) 9.84 77.6 71.4 A1c 0.8654 (0.7963-0.9345) 6.2 73.5 91.3 IFG (FPG 5.6-6.9 mmol/L) 67.3 89.0 IFG (FPG 6.1-6.9 mmol/L) 38.8 98.1
DM may have greater motivation to participate the national free screening program. Once DM is found by the screening program, they will be treated at hospital and will not be recruited to our study. Since most of the countries or cities do not have free screening program, the relationship between family history of DM and IPH found in the present study may not be generalized to other countries or cities. Therefore, we did not include family history of DM into the risk scores.
In conclusion, our results showed that the agreement between FPG and 2hPG to diagnose DM was not good and 59.8% subjects with DM were not identified by FPG tests. Subjects with older age, higher FPG, TC, TG, blood pressure, BMI, HbA1c and use of medications for hypertension were associated with IPH. The performance of the four risk scores and HbA1c are better than IFG in identifying subjects with undiagnosed IPH.
Acknowledgments
The authors would like to thank Ms. Kuan-Yi Wu and Ms. Chia-Jung Yang for their technical and com-puting assistance. This work is supported in part by grants from the National Science Council, Taiwan (96-2628-B-041-002-MY3).
FPG test followed by OGTT in separate visits, score 1 and 2 have shown to be useful to have high AUC, sensitivity, and specificity for IPH. Alternatively, if non-fasting, sequential screening strategy is preferred, i.e. non-fasting blood test followed by OGTT in separate visits, score 3 provided a practical way.
Several predictive models for screening undiagnosed DM have been reported [3-6, 8, 28-31]. The ADA suggests some criteria, including BMI, age, ethnic population, history of gestational DM, hypertension etc., to screen for IFG and/or IGT and DM in asymp-tomatic individuals [28]. A classification tree composed of some risk factors by questionnaire has also been reported with a sensitivity of 79% and specificity of 65% for detecting undiagnosed DM [3]. The latest published models from Chinese population [32-34] and various risk scores from other ethnic population [4-6, 8, 29-31] were all developed to identify people at risk of undetected DM, but not people with IPH. The present study was the first to focus on suggesting effective and practical screening strategies for people with IPH.
In present study, the percentage of family history of DM in subjects with DM was lower, although which was not statistically significant (Table 1). These may result from the consequence of national free screening program in Taiwan. Subjects with family history of
References
1. Wild S, Roglic G, Green A, Sicree R, King H (2004) Global prevalence of diabetes: estimates for the year 2000 and projections for 2030. Diabetes Care 27: 1047-1053.
2. Harris MI, Klein R, Welborn TA, Knuiman MW (1992) Onset of NIDDM occurs at least 4-7 yr before clinical diagnosis. Diabetes Care 15: 815-819.
3. Herman WH, Smith PJ, Thompson TJ, Engelgau MM, Aubert RE (1995) A new and simple questionnaire to identify people at increased risk for undiagnosed diabe-tes. Diabetes Care 18: 382-387.
4. Ruige JB, de Neeling JN, Kostense PJ, Bouter LM, Heine RJ (1997) Performance of an NIDDM screen-ing questionnaire based on symptoms and risk factors.
Diabetes Care 20: 491-496.
5. Baan CA, Ruige JB, Stolk RP, Witteman JC, Dekker JM, Heine RJ et al. (1999) Performance of a predictive model to identify undiagnosed diabetes in a health care setting. Diabetes Care 22: 213-219.
6. Griffin SJ, Little PS, Hales CN, Kinmonth AL, Wareham NJ (2000) Diabetes risk score: towards earlier detection
of type 2 diabetes in general practice. Diabetes Metab
Res Rev 16: 164-171.
7. Colagiuri S, Hussain Z, Zimmet P, Cameron A, Shaw J (2004) Screening for type 2 diabetes and impaired glu-cose metabolism: the Australian experience. Diabetes
Care 27: 367-371.
8. Bindraban NR, van Valkengoed IG, Mairuhu G, Holleman F, Hoekstra JB, Michels BP et al. (2008) Prevalence of diabetes mellitus and the performance of a risk score among Hindustani Surinamese, African Surinamese and ethnic Dutch: a cross-sectional popula-tion-based study. BMC Public Health 8: 271.
9. Ryden L, Standl E, Bartnik M, Van den BG, Betteridge J, de Boer MJ et al. (2007) Guidelines on diabetes, pre-diabetes, and cardiovascular diseases: executive sum-mary. The Task Force on Diabetes and Cardiovascular Diseases of the European Society of Cardiology (ESC) and of the European Association for the Study of Diabetes (EASD). Eur Heart J 28: 88-136.
10. American Diabetes Association (2004) Screening for type 2 diabetes. Diabetes Care 27 Suppl 1: S11-S14.
Chim Acta 404: 149-153.
23. Genuth S, Alberti KG, Bennett P, Buse J, Defronzo R, Kahn R et al. (2003) Follow-up report on the diagnosis of diabetes mellitus. Diabetes Care 26: 3160-3167. 24. Qiao Q, Nakagami T, Tuomilehto J, Borch-Johnsen K,
Balkau B, Iwamoto Y et al. (2000) Comparison of the fasting and the 2-h glucose criteria for diabetes in differ-ent Asian cohorts. Diabetologia 43: 1470-1475. 25. Levitt NS, Unwin NC, Bradshaw D, Kitange HM,
Mbanya JC, Mollentze WF et al. (2000) Application of the new ADA criteria for the diagnosis of diabetes to population studies in sub-Saharan Africa. American dia-betes association. Diabet Med 17: 381-385.
26. Wahl PW, Savage PJ, Psaty BM, Orchard TJ, Robbins JA, Tracy RP (1998) Diabetes in older adults: compari-son of 1997 American Diabetes Association classifica-tion of diabetes mellitus with 1985 WHO classificaclassifica-tion.
Lancet 352: 1012-1015.
27. Abdul-Ghani MA, Tripathy D, DeFronzo RA (2006) Contributions of beta-cell dysfunction and insulin resis-tance to the pathogenesis of impaired glucose tolerance and impaired fasting glucose. Diabetes Care 29: 1130-1139.
28. Bonora E, Corrao G, Bagnardi V, Ceriello A, Comaschi M, Montanari P et al. (2006) Prevalence and correlates of post-prandial hyperglycaemia in a large sample of patients with type 2 diabetes mellitus. Diabetologia 49: 846-854.
29. Spijkerman AM, Yuyun MF, Griffin SJ, Dekker JM, Nijpels G, Wareham NJ (2004) The performance of a risk score as a screening test for undiagnosed hyperg-lycemia in ethnic minority groups: data from the 1999 health survey for England. Diabetes Care 27: 116-122. 30. Alssema M, Vistisen D, Heymans MW, Nijpels G,
Glumer C, Zimmet PZ et al. (2010) The Evaluation of Screening and Early Detection Strategies for Type 2 Diabetes and Impaired Glucose Tolerance (DETECT-2) update of the Finnish diabetes risk score for prediction of incident type 2 diabetes. Diabetologia [Epub ahead of print].
31. Wang J, Stancakova A, Kuusisto J, Laakso M (2010) Identification of undiagnosed type 2 diabetic individu-als by the finnish diabetes risk score and biochemical and genetic markers: a population-based study of 7232 Finnish men. J Clin Endocrinol Metab 95: 3858-3862. 32. Sun F, Tao Q, Zhan S (2009) An accurate risk score
for estimation 5-year risk of type 2 diabetes based on a health screening population in Taiwan. Diabetes Res
Clin Pract 85: 228-234.
33. Gao WG, Dong YH, Pang ZC, Nan HR, Wang SJ, Ren J et al. (2010) A simple Chinese risk score for undiag-nosed diabetes. Diabet Med 27: 274-281.
34. Chien K, Cai T, Hsu H, Su T, Chang W, Chen M et al. (2009) A prediction model for type 2 diabetes risk among Chinese people. Diabetologia 52: 443-450. 11. IDF Clinical Guidelines Task Force, Global guideline
for Type 2 diabetes., International Diabetes Federation, Brussels, 2005,
12. Alberti KG, Zimmet PZ (1998) Definition, diagnosis and classification of diabetes mellitus and its compli-cations. Part 1: diagnosis and classification of diabe-tes mellitus provisional report of a WHO consultation.
Diabet Med 15: 539-553.
13. Bennett CM, Guo M, Dharmage SC (2007) HbA(1c) as a screening tool for detection of Type 2 diabetes: a sys-tematic review. Diabet Med 24: 333-343.
14. Rohlfing CL, Little RR, Wiedmeyer HM, England JD, Madsen R, Harris MI et al. (2000) Use of GHb (HbA1c) in screening for undiagnosed diabetes in the U.S. popu-lation. Diabetes Care 23: 187-191.
15. Chiang TL (1997) Taiwan’s 1995 health care reform.
Health Policy 39: 225-239.
16. Lee ET, Howard BV, Go O, Savage PJ, Fabsitz RR, Robbins DC et al. (2000) Prevalence of undiagnosed dia-betes in three American Indian populations. A compari-son of the 1997 American Diabetes Association diag-nostic criteria and the 1985 World Health Organization diagnostic criteria: the Strong Heart Study. Diabetes
Care 23: 181-186.
17. Resnick HE, Harris MI, Brock DB, Harris TB (2000) American Diabetes Association diabetes diagnostic cri-teria, advancing age, and cardiovascular disease risk profiles: results from the Third National Health and Nutrition Examination Survey. Diabetes Care 23: 176-180.
18. Pablos-Velasco PL, Martinez-Martin FJ, Rodriguez-Perez F, Ania BJ, Losada A, Betancor P (2001) Prevalence and determinants of diabetes mellitus and glucose intolerance in a Canarian Caucasian population - comparison of the 1997 ADA and the 1985 WHO cri-teria. The Guia Study. Diabet Med 18: 235-241. 19. Rodriguez BL, Abbott RD, Fujimoto W, Waitzfelder B,
Chen R, Masaki K et al. (2002) The American Diabetes Association and World Health Organization classifica-tions for diabetes: their impact on diabetes prevalence and total and cardiovascular disease mortality in elderly Japanese-American men. Diabetes Care 25: 951-955. 20. Nakagami T, Qiao Q, Tuomilehto J, Balkau B,
Carstensen B, Tajima N et al. (2002) The fasting plasma glucose cut-point predicting a diabetic 2-h OGTT glu-cose level depends on the phenotype. Diabetes Res Clin
Pract 55: 35-43.
21. Li HY, Lin MS, Wei JN, Hung CS, Chiang FT, Lin CH et al. (2009) Change of serum vascular adhesion pro-tein-1 after glucose loading correlates to carotid intima-medial thickness in non-diabetic subjects. Clin Chim
Acta 403: 97-101.
22. Li HY, Wei JN, Lin MS, Smith DJ, Vainio J, Lin CH et al. (2009) Serum vascular adhesion protein-1 is increased in acute and chronic hyperglycemia. Clin