A point-by-point response MANUSCRIPT 14-0855R1
“Ozone, Particulate Matter, and Newly Diagnosed Alzheimer's Disease: A Population-Based Cohort Study in Taiwan”
REVIEWER 1 REVIEWER:
I have very carefully reviewed their ozone data and indeed their levels are even higher that large cities in the Western hemisphere, however their PM10 data is still not clear. Lacking from the review and critical for this type of work are the graphic trends for both PM10 and PM2.5 data available. Since the strong conclusions are based on PM.25 data, a clear presentation of their PM10 and projected PM2.5 data has to be available.
The way to solve this gap is to present the graphic trend in 24h average concentrations in the entire study period 2000-2010. This type of missing graphic information will be very helpful for researchers across the world. Not showing a clear PM10 information and the real PM2.5 data clouds the results of this paper.
Also interesting are the data related to PM metal concentrations in percentages. Percentages of what? From the atmospheric point of view, the percentage data make absolutely nonsense unless they explain exactly what are they doing. The metal data are commonly expressed in ug/m3.
For somebody with extensive experience in air pollution, the PM10 data presented look sloppy and amateur. There is no justification not to present clear data in a way any atmospheric researcher is capable of evaluating the work and a health researcher is capable of establishing the links.
The PM10 data is critical, since PM2.5 data is only available from 2006 and the authors are drawing key conclusions based on a theoretical estimation of PM2.5 for the missing 6
years of real data.
RESPONSE:
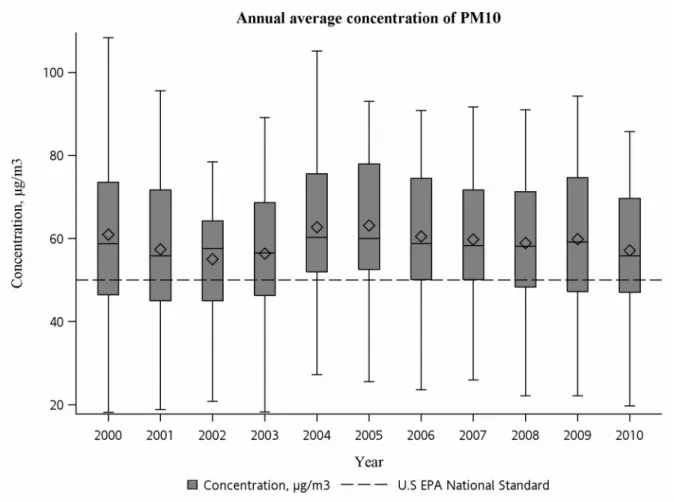
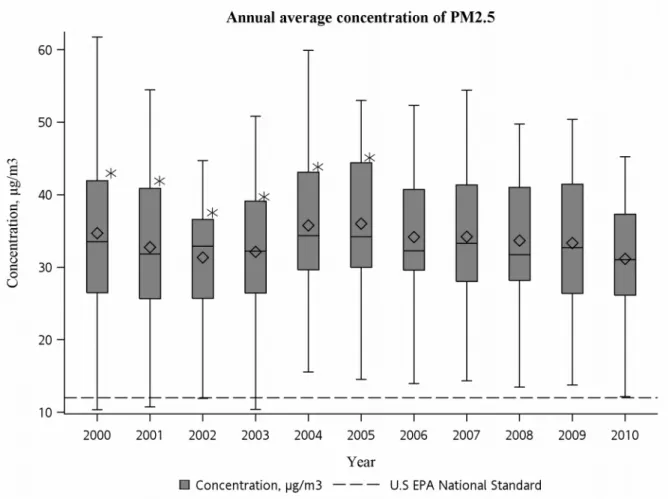
We have added a brief description of air pollutants (page 15) and box plot graphics in the manuscript showing the trends of annual average of PM10 and projected PM2.5 from 2000 to
2010 (Figure 5 and Figure 6, page 47, 48 ). The PM10 data handling was according to the
guidance from U.S. EPA [1] as follow:
1. If effective values are available for at least 75 % (18 or more) of the hours during the 24-hour period, that day’s average is valid.
2. If effective values are available for at least 75% of the scheduled sampling days per quarter, that year’s average is an effective annual average. We used the criteria to calculate the annual arithmetic average of PM10 data.
We agree with reviewer that metal data are expressed in ug/m3. Therefore, we have
revised the manuscript on page 19 as below:
“Fang and colleagues found the annual average metal concentration in the PM2.5-10 were
360.6±115.8 ng/m3 for iron (Fe), 92.1±54.7 ng/m3 for magnesium (Mg), 90.6±54.9 ng/m3 for
lead (Pb), 40.3±33.9 ng/m3 for zinc (Zn), 9.0±13 ng/m3 for chromium (Cr), 4.3±8.1 ng/m3 for
nickel (Ni), 3.8±6.2 ng/m3 for cadmium (Cd), 12.8±11.8 ng/m3 for copper (Cu), and 7.5±3.4
ng/m3 for manganese (Mn); in the PM
2.5 were 162.8±163.3 ng/m3 for Fe, 37.9±50.8 ng/m3 for
Mg, 283.1±252.2 ng/m3 for Pb, 177.8±103 ng/m3 for Zn, 33.5±48 ng/m3 for Cr, 11.8±29.9
ng/m3 for Ni, 4.3±8.5 ng/m3 for Cd, 11.5±19.9 ng/m3 for Cu, 19.1±20.5 ng/m3 for Mn.”
[1] U.S. EPA (1999) Guideline on data handling conventions for the PM NAAQS. EPA Document-454/R-99-008.
REVIEWER: ABSTRACT
Their entire abstract has to be modified to make it clear their entire study period is not based on PM2.5 as they stated, but on 6 years of PM10 and 4 years of PM2.5. Not stating exactly where they are getting their PM2.5 data is not acceoptable.
RESPONSE:
We have added the following text in the abstract to declare our PM2.5 data during
2000-2005 are estimations from PM10 data (page 5):
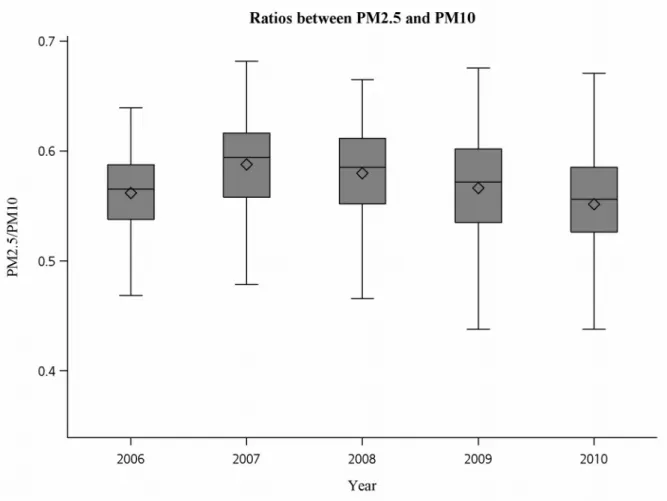
“Since PM2.5 data is only accessible entirely after 2006, we used the mean ratio between PM2.5
and PM10 during 2006-2010 (0.57) to estimate the PM2.5 concentrations from 2000 to 2005.”
REIVIEWER: DISCUSSION
In the first line of the discussion authors need to modify their current statement: In this population-based cohort study, higher concentrations of O3 and PM2.5 exposure were associated with increased risk of newly diagnosed AD.
That is not accurate, the PM2.5 data are largely estimations, not real data and they should say so.
RESPONSE:
We have modified the paragraph in the discussion and stressed again our PM2.5 data are
Ozone, Particulate Matter, and Newly Diagnosed Alzheimer’s Disease: A Population-Based Cohort Study in Taiwan
Running title: Ozone, Particulate Matter, and Alzheimer’s Disease
Chau-Ren Junga,b, Yu-Ting Lina,b, and Bing-Fang Hwangb
aDepartment of Public Health, College of Public Health, China Medical University, Taichung,
Taiwan.
bDepartment of Occupational Safety and Health, College of Public Health, China Medical
University, Taichung, Taiwan.
Corresponding Author: Bing-Fang Hwang, PhD, Department of Occupational Safety and
Health, College of Public Health, China Medical University No 91 Hsueh-Shih Rd, Taichung, Taiwan, 40402 R. O. C.
E-mail: [email protected]
Telephone: +886-4-22053366 ext 6208 Telefax: +886-4-22071861
Abstract:
Several studies with small human cohorts and animal research implicate air pollution in Alzheimer's disease (AD)-like neuropathology, but the actual impact of air pollution on the risk of AD is unknown. Here, this study investigates the association between long-term exposure to O3 and PM with an aerodynamic diameter equal to or less than 2.5 μm (PM2.5),
and newly diagnosed AD in Taiwan. We conducted a cohort study of 95,690 individuals’ age ≥ 65. Data were retrieved from National Insurance Research Database during 2001–2010. We
obtained PM10 and O3 data from Environmental Protection Agency during 2000–2010. Since
PM2.5 data is only accessible entirely after 2006, we used the mean ratio between PM2.5 and
PM10 during 2006–2010 (0.57) to estimate the PM2.5 concentrations from 2000 to 2005. A
Cox proportional hazards model was used to evaluate the associations between O3 and PM2.5
at baseline and changes of O3 and PM2.5 during the follow-up period and AD. The adjusted
HR for AD was weakly associated with a raised concentration in O3 at baselineper increase
of 9.63 ppb (adjusted HR 1.06, 95% confidence interval (CI) 1.00–1.12). Further, we estimated a 211% risk of increase of AD per increase of 10.91 ppb in O3 over the follow-up
period (95% CI 2.92–3.33). We found a 138% risk of increase of AD per increase of 4.34 μg/m3 in PM
2.5 over the follow-up period (95% CI 2.21–2.56). These findings suggest
long-term increases in O3 and PM2.5are associated with increased the risk of AD.
Introduction
High levels of air pollution, especially ozone (O3) and particulate matter (PM), may be
associated with central nervous system (CNS) diseases including Alzheimer’s disease (AD), Parkinson’s disease, and stroke [1]. There is currently an increasing interest in the association between air pollution and AD. AD is a predominant age-related neurodegenerative disease that accounts for the major cause of dementia in people older than age 60 years[2]. This disease has afflicted 27.7 million people worldwide and has produced an enormous economic burden (129–159 billion USD) [3]. The major symptom of AD is gradual deterioration in behavior or cognition with impairment of language, praxis, and visuospatial abilities [4, 5].In Taiwan, AD accounts for two-thirds of dementia and the prevalence rate of AD is 2% among the population aged 65 or older [6]. The incidence rates of AD double every 4.9-year after people reach the age 60 years old grow from 0.17% per year for individual aged 65 to 0.71%, 1.0%, and 2.92% per year, respectively, at 75, 77, and 85 [7]. Both genetic and environmental factors play important roles in the etiology of AD [8]. Short-term changes in the incidence of AD are more likely influenced by changes in the environment than by changes in the genetic pool. From the point of view of prevention, there is a growing need to understand the
relationship between AD and modifiable environmental exposure, such as exposure to air pollution.
demonstrated that air pollution, mainly O3 and PM, may have adverse impact on the brain and
induce AD-like pathology [9–11]. In an animal model, mongrel dogs chronically exposed to high concentrations of O3 and PM would exhibited early and persistent activation of nuclear
factor-kappa beta, inducible nitric oxide synthase, alterations in the blood brain barrier in cortical capillaries, degenerating cortical neurons, apoptotic glial white matter cells, and deposition of apolipoprotein E-positive lipid droplets in smooth muscle cells and pericytes, non-neuritic plaques and neurofibrillary tangles [9]. In autopsy studies,
Calderón-Garcidueñas and colleagues indicated that exposure to severe air pollution is associated with brain inflammation and depositions of amyloid-β 42 (Aβ42) peptides—the key characteristic of AD in the frontal cortex and hippocampus [10, 12]. However, the epidemiological
evidence characterizing the potential effect of air pollution on AD is still limited [13]. We conducted a prospective 10-year population-based cohort study to assess the
associations between exposure to O3 and PM with aerodynamic diameter equal to or less than
2.5 μm (PM2.5) and newly diagnosed AD in Taiwan. The design of this study enabled us to
verify an appropriate temporality between the hypothesized exposure and outcome and to eliminate the possibility that the presence of the outcome would influence the assessment of exposure.
Materials and Methods
Study design
We conducted a population-based cohort study by retrieving all individuals from the longitudinal health insurance database 2000 (LHID2000). The LHID2000 includes
registration files and claim data of ambulatory care expenditures or inpatient expenditures for 1,000,000 individuals systematically and randomly selected from the year 2000 registry of beneficiaries of the National Insurance Research Database (NHIRD). NHIRD is comprised of detailed health care information from more than twenty three million enrollees, representing more than 99% of the entire population in Taiwan. National Health Research Institutes (NHRI) confirmed that there are no significant difference in the gender distribution, age distribution, number of newborns every year and average insurance payroll amount between LHID2000 and the NHIRD [14]. Because the data were analyzed anonymously, the institute review board specifically waived the need for consent from each subject. This study has been approved by the Institute Review Board of China Medical University Hospital, and it
complies with the principles outlined in the Helsinki Declaration.
Study population
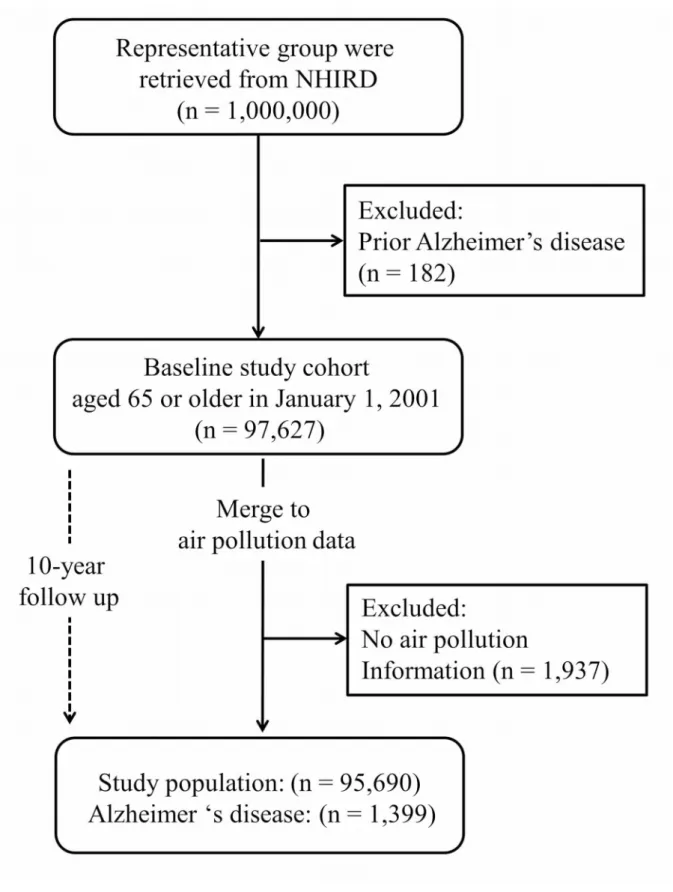
A representative group comprised 1 million individuals was included at the baseline in 2001. We excluded individuals who had experienced AD prior to the baseline (n = 182), and focused on individuals aged 65 years and older at the baseline (n = 97,627) [15, 16]. The
cohort entry constituted a total of 97,627 individuals. A prospective cohort study directed at all the individuals of the cohort was conducted from January 1, 2001 through December 31, 2010. The follow-up time began from the baseline until the diagnosis of AD, termination of insurance or at the end of the follow-up. A total of 773 individuals (0.79%) were not found upon follow-up during the study period, and the response rate was 99.21%. In the subsequent analyses, we also excluded individuals for whom air pollution information was missing (n=1,937). The final study population comprises 95,690 individuals. The flow of data processing is presented in Figure 1.
Outcome of interest
The database provides personal diagnosis codes based on the International Classification of Diseases, Ninth Revision, Clinical Modification (ICD-9-CM). We identified individuals who received at least two consensus diagnoses of AD (code 331.0) between January 1, 2001 and December 31, 2010.These individuals were selected as our outcome of interest [17]. Newly diagnosed AD was defined as the first diagnosis of AD. In Taiwan, the coding of AD was assigned by physician based on history, physical examination, laboratory and imaging studies including evidence of progressive medial temporal lobe atrophy on computed
tomography (CT) and Magnetic resonance image (MRI), the Mini-Mental State Examination [18], National Institute of Neurological and Communicative Disorders and
Stroke-Alzheimer’s Disease and Related Disorders Association (NINCDS-ADRDA) criteria [19], the Diagnostic and Statistical Manual of Mental Disorders (DSM-IV) [20], and Hachinski ischemic score (HIS) [21]. The National Health Insurance Administration, Ministry of Health and Welfare (NHI) verifies the validity and quality of diagnosis by randomly sampling a constant ratio of claims from every hospital each year and through strict review by an independent group of doctors [22]. In addition, the accuracy of diagnosis of major diseases, such as acute coronary syndrome and ischemic stroke, has been validated [23, 24].
Exposure assessment
Hourly PM10 and O3 data were available from 70 Taiwan Environmental Protection
Agency (EPA) monitoring station on Taiwan’s main island from 2000 through 2010. We computed the annual fourth-highest daily maximum 8-hour average ozone concentration based on the 8-hour standard [25] and the annual average of PM10 was according to the
guidance from U.S. EPA [26]. In addition, we also used hourly data on carbon monoxide (CO), nitrogen dioxide (NO2), and sulfur dioxide (SO2) data from the Taiwan EPA to
evaluate the effects of multiple air pollutants. O3, PM10, CO, NO2, and SO2 were continuously
measured by ultraviolet absorption, beta-gauge, nondispersive infrared absorption, chemiluminescence, and ultraviolet fluorescence, respectively.
The PM2.5 data is only accessible entirely after year 2006 in Taiwan. The ratios between
0.57 (Figure 2). We used the mean ratio between PM2.5 and PM10 during 2006-2010 to
estimate the concentrations of PM2.5 from 2000 to 2006.
The locations of the monitoring stations and air pollution sources were identified and managed by a geographic information system (ArcGIS version 10; ESRI, Redlands, CA, USA). The monitoring data were integrated into yearly point data and interpolated to pollutant surfaces using the inverse distance weighting method (IDW). For the IDW approach, we used the suitable spatial resolution (100.00m) [27] and 1/ square distance methods by using the 3 closest monitoring stations within 25 kilometer of each grid cell to calculate yearly mean concentration for each air pollutants. To obtain post-code level
pollutant concentrations, we were integrated the yearly air pollution data into each post-code area from grid cell and then assigned it to individual by their own post-code number.. Postal codes typically corresponded to one block in urban areas (17.00 square kilometer, SD: 8.56) but were larger in rural areas (154.00 square kilometer, SD: 104.39) with lower population density.
Covariates
The characteristics at baseline are listed in the Table 1: age in 2001, gender, income, and other comorbidities. Age is the primary risk factor for AD [28]. To allow non-linear
adjustment, age was fitted in four indicator variables (70–73, 74–79, and ≥ 80 years with 65– 69 years as the reference category). The income levels were classified as retired and non-retired (monthly insurance payment large than zero).
Several comorbidities may be associated with AD including cardiovascular disease [16], cerebrovascular disease [29], diabetes mellitus [30], and hypertension [31]. Asthma and chronic obstructive pulmonary disease (COPD) are also suspected to enhance the pathology of AD [32]. We included diabetes mellitus CM 250), hypertensive disease (ICD-9-CM 401 to 405), myocardial infarction (MI) (ICD-9-(ICD-9-CM 410.0 to 410.9), angina pectoris (ICD-9-CM 413), stroke (ICD-9-CM 430 to 434 and 436 to 438), peripheral arterial disease (PAD) (ICD-9-CM 443.8 to 443.9), asthma (ICD-9-CM 493), and COPD (ICD-9-CM 490 to 496) in the subsequent analyses.
Statistical methods
The difference in the proportion of categorical variables among AD group and the group without AD was presented by chi-square statistics. The incidences of newly diagnosed AD were calculated per 10,000 person-years. A Cox proportional hazard model which takes into account confounding factors was used to investigate the association between air pollutants
and newly diagnosed AD [33]. For the analyses of the time to diagnosis of AD, each individual’s observation time was censored at the year when the insurance was terminated, the patient died due to another cause, or at the end of the follow-up. In order to examine the associations between newly diagnosed AD with the baseline and changes of air pollution concentration over the follow-up period, we considered two exposure indicators. First, concentration of each air pollutant at baseline was denoted by the concentration of each air pollutant in the year prior to the baseline (year 2000). Second, change in each air pollutant between the follow-up period and baseline, was defined as the concentrations at the end of follow-up period minus the baseline concentration of each air pollutant in the analyses. A positive value of change was indicated when the concentration at baseline increases over time while a negative value of change was observed when the concentration at baseline decreased over time. The correlation between baseline and change of each air pollutant were highly correlated (i.e. the correlation between baseline and change of PM10 was -0.63). To avoid
potential collinearity problems, we did not include these two exposure indicators in the same model. The effect of each pollutant on the risk of newly diagnosed AD was estimated as the hazard ratio (HR) per interquartile range of 9.63 and 10.91 ppb for the baseline of O3 and the
changein O3 over the follow-up period, the interquartile range of 13.21 and 4.34 μg/m3 for
the baseline of PM2.5 and the changein PM2.5 over the follow-up period, along with 95%
covariates in the Cox proportional hazards model. A stepwise selection procedure was used to select potential confounders in the relation to air pollutants and the risk of newly diagnosed AD. Finally, we adjusted for age, gender, income, diabetes mellitus, hypertensive disease, MI, stroke, asthma and COPD (p < 0.05) in the final model. Further, we also fitted the two-pollutant models of O3 and PM10 with CO, NO2, and SO2 separately. The two pollutant
models provide estimates of the independent effects of O3 and PM10 controlling for the
second pollutantin the models; correlation coefficients among air pollutants equal or larger than 0.4 were excluded in the models. All analyses were conducted using SAS version 9.3 for Windows (SAS Institute Inc., Cary, NC).
Results
Baseline characteristics
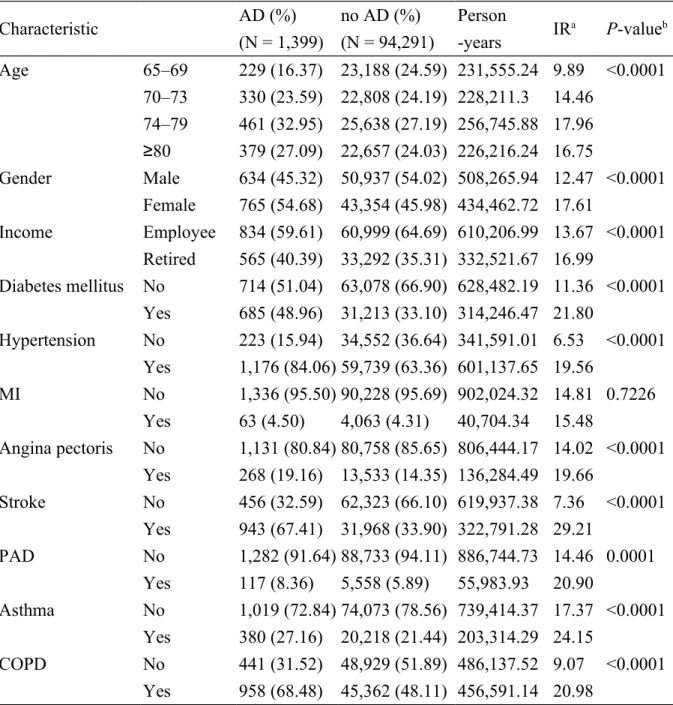
A total of 1,399 individuals were diagnosed with AD within the cohort of 95,690 individuals from January 1, 2001 to December 31, 2010. The incidence rate was 14.83 per 10,000 person-years. These newly diagnosed AD individuals included 765 females (54.68%) and 834 non-retired individuals (59.61%). In our study, most newly diagnosed AD
individuals were older, from ages 74 to 79 (incidence rate (IR) = 17.96 per 10,000 person-years), female (IR = 17.61 per 10,000 person-person-years), and retired individuals (IR = 16.99 per 10,000 person-years). The common comorbidities were hypertensive disease (84.06% of AD individuals), COPD (68.48% of AD individuals), stroke (67.41% of AD individuals), and
diabetes mellitus (48.96% of AD individuals) (Table 1).
Air pollution
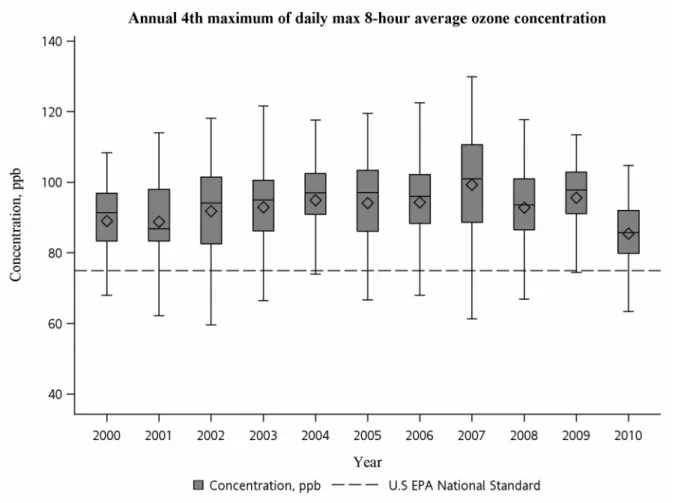
The mean of annual 4th maximum of daily max 8-hour average O3 concentration was
92.64 ppb (SD, 13.47) with a range from 34.75 to 137.65 ppb; the mean of annual average of PM10 was 59.25 μg/m3 (SD, 15.76) with range of 18.18 to 108.35 μg/m3; the mean of annual
average of PM2.5 was 33.56 μg/m3 (SD, 9.20) with a range of 10.36 to 61.76 μg/m3 during
2000–2010. The trends of O3, PM10, and PM2.5 based on 70 sites during study period are
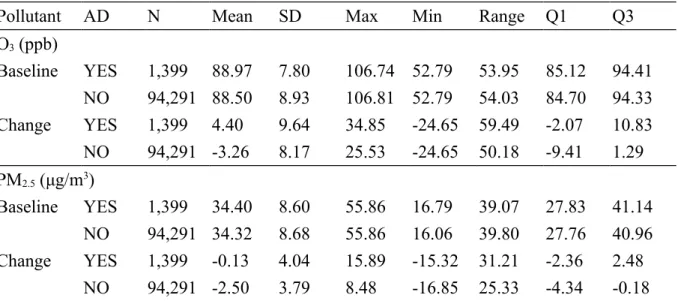
shown in Figure 3, Figure 4, and Figure 5, respectively. As shown in Table 2, the mean of O3
at baseline was 88.97 ppb (standard deviation (SD), 7.80) with a range of 52.79 to 106.74 ppb in the AD group and a mean of 88.50 ppb (SD, 8.93) with a range of 52.79 to 106.81 ppb in
group without AD. The mean of PM2.5 at baseline was 34.40 μg/m3 (SD, 8.60) with a range of
16.79 to 55.86 μg/m3 in the AD group and a mean of 34.32 μg/m3 (SD, 8.68) with a range of
16.06 to 55.86 μg/m3 in the group without AD. The change of O
3 was positive (mean change
= 4.40 ppb, SD, 9.64) in the AD group, showing an increased trend over time while a negative change was found in the group without AD (mean change = -3.26 ppb, SD, 8.17).
There was almost no change in PM10 concentration in the AD group (mean change = -0.13
μg/m3, SD, 4.04) while a negative change of PM
10 was observed in the group without AD
(mean change = -2.50 ppb, SD, 3.79).
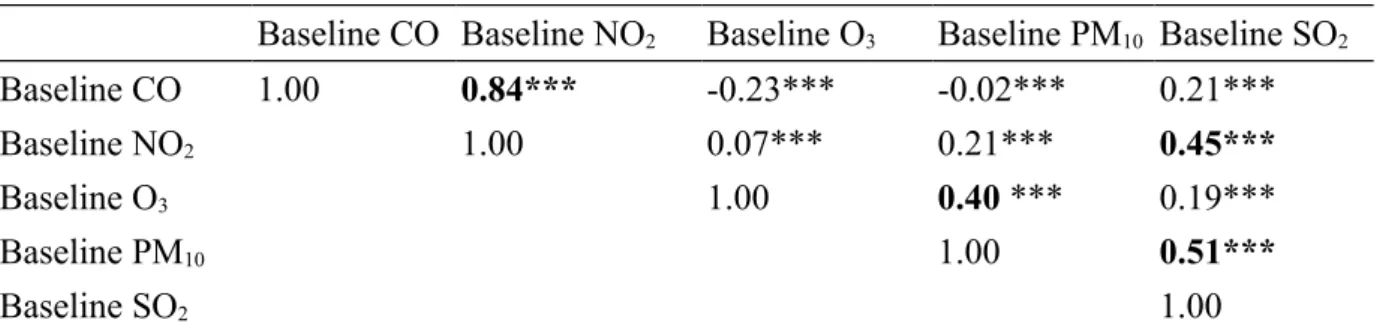
(r = 0.40) at baseline. The concentrations of SO2 at baseline were highly correlated with NO2
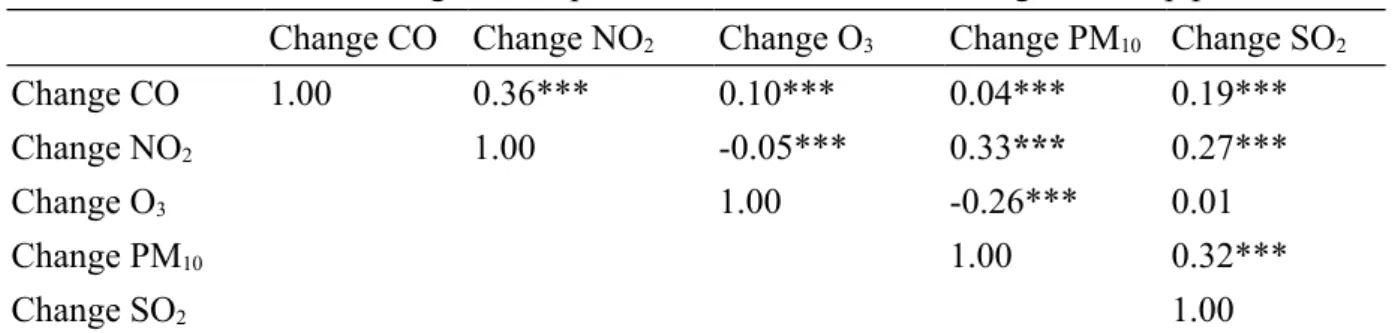
(r = 0.45) and PM2.5(r = 0.51) (Table 3). The changes in PM2.5 were moderately correlated
with NO2 (r = 0.33) and SO2 (r = 0.32) (Table 4).
Air pollution and the risk of newly diagnostic AD
The adjusted HR for newly diagnosed AD was weakly positively associated with the raised concentration in O3 at baselineper increase of 9.63 ppb (IQR) (adjusted HR = 1.06,
95% CI: 1.00, 1.12) (Table 5), and the adjusted HR change slightly after controlling for second pollutants (adjusted HR = 1.10, 95% CI: 1.03, 1.17 with CO at baseline; adjusted HR
= 1.06, 95% CI: 0.99, 1.13 with NO2 at baseline; adjusted HR = 1.04, 95% CI: 0.98, 1.11
with SO2 at baseline) (Table 6). We estimated a 211% risk of the increase of newly diagnosed
AD per increase of 10.91 ppb (IQR) in O3 over the follow-up period (adjusted HR = 3.12,
95% CI: 2.92, 3.33), and we observed a slight increase after controlling for CO, NO2 PM10
and SO2 (adjusted HR varying from 3.23 to 3.52) (Table 6). The unadjusted HR per increase
of 13.21 μg/m3 (IQR) increase in PM
2.5 at baseline was 1.01 (95% CI: 0.93, 1.09), and the
adjusted HR was 1.03 (95% CI: 0.95, 1.11). In addition, the adjusted HRs changed slightly
after controlling for CO and NO2 (adjusted HR = 1.03, 95% CI: 0.95, 1.12 with CO at
baseline; adjusted HR = 0.99, 95% CI: 0.91, 1.07 with NO2 at baseline). We found a 138%
risk of increase of newly diagnosed AD per increase of 4.34 μg/m3 (IQR) in PM
follow-up period (adjusted HR = 2.38, 95% CI: 2.21, 2.56) (Table 5), was and estimates remained stable when additional pollutants were added (Table 6).
Discussion
In this population-based cohort study, higher concentrations of O3 exposure were
associated with increased risk of newly diagnosed AD. We found that individuals exposed to a 10.91 ppb increase in O3 over the follow-up period had a 211% increase risk of newly
diagnosed AD. In addition, we used PM10 data to estimate the concentration of PM2.5 during
2000–2005 and also found individuals exposed to a 4.34 μg/m3 increase in PM
2.5 over the
follow-up period had a 138% increased risk of newly diagnosed AD.
Cognition is defined as a combination of domains, including attention, learning, memory, language, visuospatial skills and executive functions [8]. Reasons for cognitive decline range from age-related decline and mild cognitive impairment, to severe dementia
such as AD [8]. A few studies have elaborated associations between air pollution, mainly O3
and PM, and cognitive decline. Long-term exposure to PM2.5 and PM10 has been also
associated with significantly faster cognitive decline in older US women [34]. For German women aged 68–74 years, living within 50m from a busy road (an indicator of traffic-related air pollution) was associated with worse scores on a neuropsychological test battery [35].
Increasing levels of annual exposure to O3 was associated with reduce cognitive performance
also suggested that exposures to higher concentrations of O3 and PM2.5 are associated with
lower executive function and verbal learning, respectively [37]. Consistently, the present
study found the risk of newly diagnosed AD increased with increasing concentrations of O3
and PM2.5.
Air pollution may transfer from peripheral organs to the brain through systemic
inflammation [1]. Exposure to O3 may induce the release of pro-inflammatory mediators from
the lungs [38]. Chronic lung inflammation may result in systemic inflammation that impacts blood vessels [39]. Cytokine derived from systemic inflammation may also cross the blood brain barrier [40] and lead to active microglia [41]. Microglial activation is an early event in the process of AD [42]. Activated microglia releases secondary inflammation mediators and reactive oxygen species (ROS) such as superoxide, nitric oxide (NO), tumor necrosis factor-α (TNF α), interleukin 1β (IL-1β); this may intensify neuroinflammation and lead to brain damage [41].
Oxidative stress is also a vital pathogenesis and etiology of AD [13, 43, 44] which may lead to lipid peroxidation, protein oxidation and DNA oxidation in brain [45-47]. Aβ42 deposition is the key characteristic of AD. This kind of deposition first works against
oxidative damage in the initial stage of AD, but ultimately evolves into a prooxidant only and exacerbates oxidative stress in the AD brain [48]. Ambient air is a complex of variety
reaction (O3 and PM) [49]. Acute or chronic O3 exposure may generate oxidative stress that
leads to brain lipid peroxidation [50, 51], neuronal morphological and ultrastructural changes [52], and memory deterioration [53].
According to the studies conducted locally in Taiwan, which indicated vehicle
emissions, secondary aerosols, and biomass burning were the major source of PM2.5 in urban
regions [54–57]. Fang and colleagues found the annual average metal concentration in the PM2.5-10 were 360.6±115.8 ng/m3 for iron (Fe), 92.1±54.7 ng/m3 for magnesium (Mg),
90.6±54.9 ng/m3 for lead (Pb), 40.3±33.9 ng/m3 for zinc (Zn), 9.0±13 ng/m3 for chromium
(Cr), 4.3±8.1 ng/m3 for nickel (Ni), 3.8±6.2 ng/m3 for cadmium (Cd), 12.8±11.8 ng/m3 for
copper (Cu), and 7.5±3.4 ng/m3 for manganese (Mn); in the PM
2.5 were 162.8±163.3 ng/m3
for Fe, 37.9±50.8 ng/m3 for Mg, 283.1±252.2 ng/m3 for Pb, 177.8±103 ng/m3 for Zn, 33.5±48
ng/m3 for Cr, 11.8±29.9 ng/m3 for Ni, 4.3±8.5 ng/m3 for Cd, 11.5±19.9 ng/m3 for Cu,
19.1±20.5 ng/m3 for Mn [57], they also found the average concentrations of particle-bound
polycyclic aromatic hydrocarbon (PAHs) including in PM2.5 was 56 ng/m3 [58] in central
Taiwan. PM itself may influence the brain directly; ultrafine PM (< 100 nm) may diffuse from the lung to other organs such as the liver, kidney, heart, and brain [59]. The nasal olfactory is a critical portal by which nano-sized PM may directly enter the brain through the olfactory bulb and reach the cerebral cortex, hippocampus, cerebellum and brainstem [60, 61]. Abundant nano-sized PMs were identified in the cytoplasm of the olfactory bulb neurons
after long term air pollution exposure [12]. Once PMs reach the brain, they could provide stimulus that induces the production of proinflammatory cytokines [1]. Ambient PM may result in brain inflammation in mice [62], dogs [9], and humans [10]. In addition, adsorbed compounds present on the PM surface include PAHs and oxidant metals which are
neurotoxic [1].
This study has three strengths. First, the NHIRD covered 99% of the entire population in Taiwan. Thus, we have a sufficient, prospective, and population base database from the year 2001 that allow us to test the relationship between air pollutants and newly diagnosed AD. In addition, we included 95,690 individuals hence the analysis approach may provide more statistical power than case-control designs and provide benefits in studying rare outcomes. Second, the longer follow-up period provides an opportunity to explore the association between the risk of newly diagnosed AD and long-term cumulative exposure. Third, this is the first study of its kind to be conducted among an Asian population. However, this study also has several limitations that should be noted. First, we are not able to adjust for
confounders such as genetic information (for example apolipoprotein E type 4 alleles; ApoE є4) [63], smoking [64], body mass index [65], metals [66, 67], and occupational exposure [68], because no such detailed information is available in the NHIRD. Also, we were not able to evaluate subtypes of AD using NHIRD. Second, we were unable to investigate how the specific pollutants or mix of pollutants might have influenced in AD, because we did not
have information on compositions and source of PM2.5 from Taiwan EPA.
The present study found that risk of newly diagnosed AD may increase by 211% for individuals suffering from a 10.91 ppb increase in O3 over 10 years during follow-up period.
In addition, a 4.34 μg/m3 increase in PM
2.5 over the follow-up period may lead to a 138%
increase in the risk of newly diagnosed AD. These findings suggest that improved ambient air quality, especially when it comes to O3 and PM2.5, might decrease the risk of newly diagnosed
AD. The implications of these finding for public health are urgent because air pollution is a common and notorious environmental issue.
Acknowledgments
The work was supported by China Medical University (CMU#100-AWARD-07). We thank the Taiwan Environmental Protection Agency (EPA) for providing air pollutant monitoring data and the National Health Research Institutes for access data from the National Health Insurance Research Database. The authors declare that they have no conflict of interest.
References
[1] Block ML, Calderón-Garcidueñas L (2009) Air pollution: mechanisms of neuroinflammation and CNS disease. Trends Neurosci 32, 506–516.
[2] Hampel H, Prvulovic D, Teipel S, Jessen F, Luckhaus C, Frölich L, Riepe MW, Dodel R, Leyhe T, Bertram L, Hoffmann W, Faltraco F (2011) The future of Alzheimer’s disease: the next 10 years. Prog Neurobiol 95, 718–728.
[3] Wimo A, Jonsson L, Winblad B (2006) An estimate of the worldwide prevalence and direct costs of dementia in 2003. Dement Geriatr Cogn Disord 21, 175–181.
[4] McKhann GM, Knopman DS, Chertkow H, Hyman BT, Jack CR Jr, Kawas CH, Klunk WE, Koroshetz WJ, Manly JJ, Mayeux R, Mohs RC, Morris JC, Rossor MN, Scheltens P, Carrillo MC, Thies B, Weintraub S, Phelps CH (2011) The diagnosis of dementia due to Alzheimer's disease: recommendations from the National Institute on Aging-Alzheimer's Association workgroups on diagnostic guidelines for Alzheimer's disease. Alzheimers Dement 7, 263–269.
[5] Reitz C, Brayne C, Mayeux R (2011) Epidemiology of Alzheimer disease. Nat Rev Neurol 7, 137–152.
[6] Lin RT, Lai CL, Tai CT, Liu CK, Yen YY, Howng SL (1998) Prevalence and subtype of dementia in southern Taiwan: impact of age, sex, education, and urbanization. J Neurol Sci 160, 67–75.
[7] Brookmeyer R, Gray S, Kawas C (1998) Projections of Alzheimer’s disease in the United States and the public health impact of delaying disease onset. Am J Public Health 88, 1337–1342.
[8] Daviglus ML, Bell CC, Berrettini W, Bowen PE, Connolly ES Jr, Cox NJ, Dunbar-Jacob JM, Granieri EC, Hunt G, McGarry K, Patel D, Potosky AL, Sanders-Bush E, Silberberg D, Trevisan M (2010) National Institutes of Health State-of-the-Science Conferences Statement: preventing Alzheimer's disease and cognitive decline. Ann Intern Med 153, 176–181.
[9] Calderón-Garcidueñas L, Azzarelli B, Acuna H, Garcia R, Gambling TM, Osnaya N, Monroy S, DEL Tizapantzi MR, Carson JL, Villarreal-Calderon A, Rewcastle B (2002) Air pollution and brain damage. Toxicol Pathol 30, 373–389.
R, Calderón-Garcidueñas A, Dragustinovis I, Franco-Lira M, Aragón-Flores M, Solt AC, Altenburg M, Torres-Jardón R, Swenberg JA (2004) Brain inflammation and Alzheimer’s-like pathology in individuals exposed to severe air pollution. Toxicol Pathol 32, 650–658.
[11] Calderón-Garcidueñas L, Franco-Lira M, Henríquez-Roldán C, Osnaya N, González-Maciel A, Reynoso-Robles R, Villarreal-Calderon R, Herritt L, Brooks D, Keefe S, Palacios-Moreno J, Villarreal-Calderon R, Torres-Jardón R, Medina-Cortina H, Delgado-Chávez R, Aiello-Mora M, Maronpot RR, Doty RL (2010) Urban air pollution: influences on olfactory function and pathology in exposed children and young adults. Exp Toxicol Pathol 62, 91–102.
[12] Calderón-Garcidueñas L, Solt AC, Henríquez-Roldán C, Torres-Jardón R, Nuse B, Herritt L, Villarreal-Calderón R, Osnaya N, Stone I, García R, Brooks DM, González-Maciel A, Reynoso-Robles R, Delgado-Chávez R, Reed W (2008) Long-term air pollution exposure is associated with neuroinflammation, an altered innate immune response, disruption of the blood-brain barrier, ultrafine particulate deposition, and accumulation of amyloid beta-42 and alpha-synuclein in children and young adults. Toxicol Pathol 36, 289–310.
Environ Public Health doi: 10.1155/2012/472751.
[14] National Health Insurance Administration, Ministry of Health and Welfare, National
Health Insurance Research Database, http://www.nhri.org.tw/nhird/en/index.htm,
Accessed on August 28, 2013.
[15] Launer LJ, Andersen K, Dewey ME, Letenneur L, Ott A, Amaducci LA, Brayne C, Copeland JR, Dartigues JF, Kragh-Sorensen P, Lobo A, Martinez-Lage JM, Stijnen T, Hofman A (1999) Rates and risk factors for dementia and Alzheimer’s disease: results from EURODEM pooled analyses. Neurology 52, 78–84.
[16] Newman AB, Fitzpatrick AL, Lopez O, Jackson S, Lyketsos C, Jagust W, Ives D, Dekosky ST, Kuller LH (2005) Dementia and Alzheimer’s disease incidence in relationship to cardiovascular disease in the Cardiovascular Health Study cohort. J Am Geriatr Soc 53, 1101–1107.
[17] Whitmer RA, Karter AJ, Yaffe K, Quesenberry CP Jr, Selby JV (2009) Hypoglycemic episodes and risk of dementia in older patients with type2 diabetes mellitus. JAMA 301, 1565–1572.
[18] Folstein MF, Folstein SE, McHugh PR (1975) "Mini-mental state". A practical method for grading the cognitive state of patients for the clinician. J Psychiatr Res 12, 189–198.
[19] McKhann G, Drachman D, Folstein M, Katzman R, Price D, Stadlan EM (1984) Clinical diagnosis of Alzheimer's disease: report of the NINCDS-ADRDA Work Group under the auspices of Department of Health and Human Services Task Force on Alzheimer's disease. Neurology 34, 939–944.
[20] American Psychiatric Association (2000) Diagnostic and statistical manual of mental disorders: DSM-IV-TR, 4th Edition Text Revision ed. Washington, DC: American Psychiatric Association.
[21] Rosen WG, Terry RD, Fuld PA, Katzman R, Peck A (1979) Pathological Verification of ischemic score in differentiation of dementias. Ann Neurol 7, 486–488.
[22] Lin HC, Chen YH, Lee HC, Lin HC (2010) Increased risk of acute myocardial infarction after acute episode of schizophrenia: 6 year follow-up study. Aust N Z J Psychiatry 44, 273–279.
Insurance Research Database with ischemic stroke cases in Taiwan. Pharmacoepidemiol Drug Saf 20, 236–242.
[24] Wu CY, Chan FK, Wu MS, Kuo KN, Wang CB, Tsao CR, Lin JT (2010) Histamine2-receptor antagonists are an alternative to proton pump inhibitor in patients receiving clopidogrel. Gastroenterolgy 139, 1165–1171.
[25] U.S. EPA (1998) Guideline on data handling conventions for the 8-hour ozone NAAQS. EPA Document-454/R-98-017.
[26] U.S. EPA (1999) Guideline on data handling conventions for the PM NAAQS. EPA Document-454/R-99-008.
[27] Stroh E, Harrie L, Gustafsson S (2007) A study of spatial resolution in pollution exposure modelling. Int J Health Geogr 6, 19–19.
[28] Small GW, Rabins PV, Barry PP, Buckholtz NS, DeKosky ST, Ferris SH, Finkel SI, Gwyther LP, Khachaturian ZS, Lebowitz BD, McRae TD, Morris JC, Oakley F, Schneider LS, Streim JE, Sunderland T, Teri LA, Tune LE (1997) Diagnosis and treatment of Alzheimer disease and related disorders. Consensus statement of the American
Association for Geriatric Psychiatry, the Alzheimer's Association, and the American Geriatrics Society. JAMA 278, 1363–1371.
[29] Esiri MM, Nagy Z, Smith MZ, Barnetson L, Smith AD (1999) Cerebrovascualr disease and threshold for dementia in the early stages of Alzheimer’s disease. Lancet 354, 919– 920.
[30] Arvanitakis Z, Wilson RS, Bienias JL, Evans DA, Bennett DA (2004) Diabetes mellitus and risk of Alzheimer disease and decline in cognitive function. Arch Neurol 61, 661–666.
[31] Skoog I, Gustafson D (2002) Hypertension and related factors in the etiology of Alzheimer’s disease. Ann N Y Acad Sci 977, 29–36.
[32] Block ML, Elder A, Auten RL, Bilbo SD, Chen H, Chen JC, Cory-Slechta DA, Costa D, Diaz-Sanchez D, Dorman DC, Gold DR, Gray K, Jeng HA, Kaufman JD, Kleinman MT, Kirshner A, Lawler C, Miller DS, Nadadur SS, Ritz B, Semmens EO, Tonelli LH, Veronesi B, Wright RO, Wright RJ (2012) The outdoor air pollution and brain health workshop. NeuroToxicology 33, 972–984.
Springer Press, New York.
[34] Weuve J, Puett RC, Schwartz J, Yanosky JD, Laden F, Grodstein F (2012) Exposure to particulate air pollution and cognitive decline in older women. Arch Intern Med 172, 219– 227.
[35] Ranft U, Schikowski T, Sugiri D, Krutmann J, Krämer U (2009) Long-term exposure to traffic-related particulate matter impairs cognitive function in the elderly. Environ Res
109, 1004–1011.
[36] Chen JC, Schwartz J (2009) Neurobehavioral effects of ambient air pollution on cognitive performance in US adults. Neurotoxicology 30, 231–239.
[37] Gatto NM, Henderson VW, Hodis HN, St John JA, Lurmann F, Chen JC, Mack WJ (2014) Components of air pollution and cognitive function in middle-aged and older adults in Los Angeles. Neurotoxicology 40, 1–7.
[38] Bayram H, Sapsford RJ, Abdelaziz MM, Khair OA (2001) Effect of ozone and nitrogen dioxide on the release of proinflammatory mediators from bronchial epithelial cells of nonatopic nonasthmatic individuals and atopic asthmatic patients in vitro. J Allergy Clin Immunol 107, 287–294.
[39] Tamagawa E, van Eeden SF (2006) Impaired lung function and risk for stroke. Chest
130, 1631–1633.
[40] Banks WA, Farr SA, Morley JE (2002–2003) Entry of blood-borne cytokines in to the central nervous system: effects on cognitive processes. Neuroimmunomodulation 10, 319– 327.
[41] Block ML, Zecca L, Hong JS (2007) Microglia-mediated neurotoxicity: uncovering the molecular mechanisms. Nat Rev Neurosci 8, 57–69.
[42] Cagnin A, Brooks DJ, Kennedy AM, Gunn RN, Myers R, Turkheimer FE, Jones T, Banati RB (2001) In-vivo measurement of activated microglia in dementia. Lancet 358, 461–467.
[43] Nunomura A, Perry G, Aliev G, Hirai K, Takeda A, Balraj EK, Jones PK, Ghanbari H, Wataya T, Shimohama S, Chiba S, Atwood CS, Petersen RB, Smith MA (2001) Oxidative damage is the earliest event in Alzheimer disease. J Neuropathol Exp Neurol 60, 759–767.
Biotechnol 2, 120–123.
[45] Lyras L, Cairns NJ, Jenner A, Jenner P, Halliwell B (1997) An assessment of oxidative damage to proteins, lipids, and DNA in brain from patients with Alzheimer’s disease. J Neurochem 65, 2061–2069.
[46] Sayre LM, Zelasko DA, Harris PL, Perry G, Salomon RG, Smith MA (1997) 4-Hydroxynonenal-derived advanced lipid peroxidation end products are increased in Alzheimer’s disease. J Neurochem 68, 2092–2097.
[47] Smith CD, Carney JM, Starke-Reed PE, Oliver CN, Stadtman ER, Floyd RA,
Markesbery WR (1991) Excess brain protein oxidation and enzyme dysfunction in normal aging and in Alzheimer disease. Proc Natl Acad Sci USA 88, 10540–10543.
[48] Migliore L, Coppedè F (2009) Environmental-induced oxidative stress in neurodegenerative disorders and aging. Mutat Res 674, 73–84.
[49] Kelly FJ (2003) Oxidative stress: its role in air pollution and adverse health effects. Occup Environ Med 60, 612–616.
Rivas-Arancibia S (2006) Oxidative damage in substania nigra and striatum of rats chronically exposed to ozone. J Chem Neuroanat 31, 114–123.
[51] Rivas-Arancibia S, Dorado-Martínez C, Colin-Barenque L, Kendrick KM, de la Riva C, Guevara-Guzmán R (2003) Effect of acute ozone exposure on locomotor behavior and striatal function. Pharmacol Biochem Behav 74, 891–900.
[52] Colín-Barenque L, Avila-Costa MR, Fortoul T, Rugerio-Vargas C, Machado-Salas JP, Espinosa-Villanueva J, Rivas-Arancibia S (1999) Morphologic alteration of the olfactory bulb after acute ozone exposure in rats. Neurosci Lett 274, 1–4.
[53] Avila-Costa MR, Colín-Barenque L, Fortoul TI, Machado-Salas P, Espinosa-Villanueva J, Rugerio-Vargas C, Rivas-Arancibia S (1999) Memory deterioration in an oxidative stress model and its correlation with cytological changes on rat hippocampus CA1. Neurosci Lett 270, 107–109.
[54] Chang SY, Lee CT, Chou CCK, Liu SC, Wen TX (2006) The continuous field
measurements of soluble aerosol compositions at the Taipei Aerosol Supersite, Taiwan. Atmos Environ 41, 1936–1949.
[55] Chio CP, Cheng MT, Wang CF (2004) Source apportionment to PM10 in different air
quality conditions for Taichung urban and coastal areas, Taiwan. Atmos Environ 38, 6893– 6905.
[56] Chen KS, Lin CF, Chou YM (2001) Determination of Source Contributions to Ambient PM2.5 in Kaohsiung, Taiwan, Using a Receptor Model. J Air Waste Manage 51, 489–498.
[57] Fang GC, Chang CN, Chu CC, Wu YS, Fu PPC, Yang IL, Chen MH (2003)
Characterization of particulate, metallic elements of TSP, PM2.5 and PM2.5-10 aerosols at a
farm sampling site in Taiwan, Taichung. Sci Total Environ 308, 157–166.
[58] Fang GC, Wu YS, Chen JC, Chang CN, Ho TT (2006) Characteristic of polycyclic aromatic hydrocarbon concentrations and source identification for fine and coarse particulates at Taichung Harbor near Taiwan Strait during 2004–2005. Sci Total Environ
366, 729–738.
[59] Takenaka S, Karg E, Roth C, Schulz H, Ziesenis A, Heinzmann U, Schramel P, Heyder J (2001) Pulmonary and systemic distribution of inhaled ultrafine silver particles in rats. Environ Health Perspect 109, 547–551.
[60] Wang B, Feng WY, Wang M, Shi JW, Zhang F, Ouyang H, Zhao YL, Chai ZF, Huang YY, Xie YN, Wang HF, Wang J (2007) Transport of intranasally instilled fine Fe2O3 particles into the brain: micro-distribution, chemical states, and histopathological observation. Biol Trace Elem Res 118, 233–243.
[61] Wang J, Liu Y, Jiao F, Lao F, Li W, Gu Y, Li Y, Ge C, Zhou G, Li B, Zhao Y, Chai Z, Chen C (2008) Time-dependent translocation and potential impairment on central nervous system by intranasally instilled TiO(2) nanoparticles. Toxicology 254, 82–90.
[62] Campbell A, Oldham M, Becaria A, Bondy SC, Meacher D, Sioutas C, Misra C, Mendez LB, Kleinman M (2005) Particulate matter in polluted air may increase biomarkers of inflammation in mouse brain. Neurotoxicology 26, 133–140.
[63] Corder EH, Saunders AM, Strittmatter WJ, Schmechel DE, Gaskell PC, Small GW, Roses AD, Haines JL, Pericak-Vance MA (1993) Gene does of apolipoprotein E type 4 allele and the risk of Alzheimer’s disease in late onset families. Science 261, 921–923.
[64] Ho YS, Yang X, Yeung SC, Chiu K, Lau CF, Tsang AW, Mak JC, Chang RC (2012) Cigarette smoking accelerated brain aging and induced pre-Alzheimer-like neuropathology in rats. PloS One doi 10.1371/jpurnal.pone.0036752.
[65] Gustafson D, Rothenberg E, Blennow K, Steen B, Skoog I (2003) An 18-year follow-up of overweight and risk of Alzheimer disease. Arch Intern Med 163, 1524–1528.
[66] Bush AI (2000) Metals and neuroscience. Curr Opin Chem Biol 4, 184–191.
[67] Bush AI (2003) The metallobiology of Alzheimer’s disease. Trends Neurosci 26, 207– 214.
[68] García AM, Sisternas A, Hoyos SP (2008) Occupational exposure to extremely low frequency electric and magnetic fields and Alzheimer disease: a meta-analysis. Int J Epidemiol 37, 329–340.
Table 1. Demographic data of the study cohort from January 1, 2001 to December 31, 2010. Characteristic AD (%) (N = 1,399) no AD (%) (N = 94,291) Person -years IR a P-valueb Age 65–69 229 (16.37) 23,188 (24.59) 231,555.24 9.89 <0.0001 70–73 330 (23.59) 22,808 (24.19) 228,211.3 14.46 74–79 461 (32.95) 25,638 (27.19) 256,745.88 17.96 ≥80 379 (27.09) 22,657 (24.03) 226,216.24 16.75 Gender Male 634 (45.32) 50,937 (54.02) 508,265.94 12.47 <0.0001 Female 765 (54.68) 43,354 (45.98) 434,462.72 17.61 Income Employee 834 (59.61) 60,999 (64.69) 610,206.99 13.67 <0.0001 Retired 565 (40.39) 33,292 (35.31) 332,521.67 16.99 Diabetes mellitus No 714 (51.04) 63,078 (66.90) 628,482.19 11.36 <0.0001 Yes 685 (48.96) 31,213 (33.10) 314,246.47 21.80 Hypertension No 223 (15.94) 34,552 (36.64) 341,591.01 6.53 <0.0001 Yes 1,176 (84.06) 59,739 (63.36) 601,137.65 19.56 MI No 1,336 (95.50) 90,228 (95.69) 902,024.32 14.81 0.7226 Yes 63 (4.50) 4,063 (4.31) 40,704.34 15.48 Angina pectoris No 1,131 (80.84) 80,758 (85.65) 806,444.17 14.02 <0.0001 Yes 268 (19.16) 13,533 (14.35) 136,284.49 19.66 Stroke No 456 (32.59) 62,323 (66.10) 619,937.38 7.36 <0.0001 Yes 943 (67.41) 31,968 (33.90) 322,791.28 29.21 PAD No 1,282 (91.64) 88,733 (94.11) 886,744.73 14.46 0.0001 Yes 117 (8.36) 5,558 (5.89) 55,983.93 20.90 Asthma No 1,019 (72.84) 74,073 (78.56) 739,414.37 17.37 <0.0001 Yes 380 (27.16) 20,218 (21.44) 203,314.29 24.15 COPD No 441 (31.52) 48,929 (51.89) 486,137.52 9.07 <0.0001 Yes 958 (68.48) 45,362 (48.11) 456,591.14 20.98
Abbreviations: AD, Alzheimer’s disease; COPD, chronic obstructive pulmonary disease; IR, incidence rate; MI, myocardial infarction; PAD, peripheral arterial disease.
a Incidence rate per 10,000 person-years b χ2 tests for categorical variables
Table 2. Mean and distribution of air pollutants at baseline and change during follow-up period from January 1, 2001 to December 31, 2010.
Pollutant AD N Mean SD Max Min Range Q1 Q3
O3 (ppb) Baseline YES 1,399 88.97 7.80 106.74 52.79 53.95 85.12 94.41 NO 94,291 88.50 8.93 106.81 52.79 54.03 84.70 94.33 Change YES 1,399 4.40 9.64 34.85 -24.65 59.49 -2.07 10.83 NO 94,291 -3.26 8.17 25.53 -24.65 50.18 -9.41 1.29 PM2.5 (μg/m3) Baseline YES 1,399 34.40 8.60 55.86 16.79 39.07 27.83 41.14 NO 94,291 34.32 8.68 55.86 16.06 39.80 27.76 40.96 Change YES 1,399 -0.13 4.04 15.89 -15.32 31.21 -2.36 2.48 NO 94,291 -2.50 3.79 8.48 -16.85 25.33 -4.34 -0.18
Abbreviations: Max, maximum; Min, minimum; 4th-O3, fourth-highest daily maximum average 8-hour ozone;
PM10, particulate matter with aerodynamic diameter equal to or less than 2.5 μm; Q1, 25 percentile; Q3, 75
Table 3. Correlations of air pollutants’ concentration at baseline.
Baseline CO Baseline NO2 Baseline O3 Baseline PM10 Baseline SO2
Baseline CO 1.00 0.84*** -0.23*** -0.02*** 0.21***
Baseline NO2 1.00 0.07*** 0.21*** 0.45***
Baseline O3 1.00 0.40 *** 0.19***
Baseline PM10 1.00 0.51***
Baseline SO2 1.00
Abbreviations: NO2, nitrogen dioxides; PM2.5, particulate matter with aerodynamic diameter equal to or less than
2.5 μm; SO2, sulfur dioxide; O3, fourth-highest daily maximum average 8-hour ozone; CO, carbon monoxide.
*** P-value < 0.0001.
Table 4. Correlations of changes in air pollutants’ concentration during follow-up period.
Change CO Change NO2 Change O3 Change PM10 Change SO2
Change CO 1.00 0.36*** 0.10*** 0.04*** 0.19***
Change NO2 1.00 -0.05*** 0.33*** 0.27***
Change O3 1.00 -0.26*** 0.01
Change PM10 1.00 0.32***
Change SO2 1.00
Abbreviations: NO2, nitrogen dioxides; PM10, particulate matter with aerodynamic diameter equal to or less than
10 μm; SO2, sulfur dioxide; O3, fourth-highest daily maximum average 8-hour ozone; CO, carbon monoxide.
Table 5. Crude and adjusted hazard ratios with 95% confidence intervals (CIs) of newly diagnosed Alzheimer’s disease (AD), corresponding to O3 and PM2.5 exposure at baseline as
well as change of concentrations during follow-up period. Crude HR (95% confidence interval)
Adjusted HRa (95%
confidence interval) O3
The HR of AD per 9.63 ppb increase in baseline O3
1.06(1.00, 1.13) 1.06 (1.00, 1.12)
The HR of AD per 10.91 ppb increase in change O3 3.11 (2.91, 3.32) 3.12 (2.92, 3.33) PM2.5 The HR of AD per 13.21 μg/m3 increase in baseline PM2.5 1.01 (0.93, 1.09) 1.03 (0.95, 1.11)
The HR of AD per 4.34 μg/m3 increase
in change PM2.5
2.41 (2.24, 2.59) 2.38 (2.21, 2.56)
Abbreviations: PM2.5, particulate matter with aerodynamic diameter equal to or less than 2.5 μm; O3,
fourth-highest daily maximum average 8-hour ozone.
aAdjusted HR was adjusted for age, gender, income, diabetes mellitus, hypertensive disease, myocardial
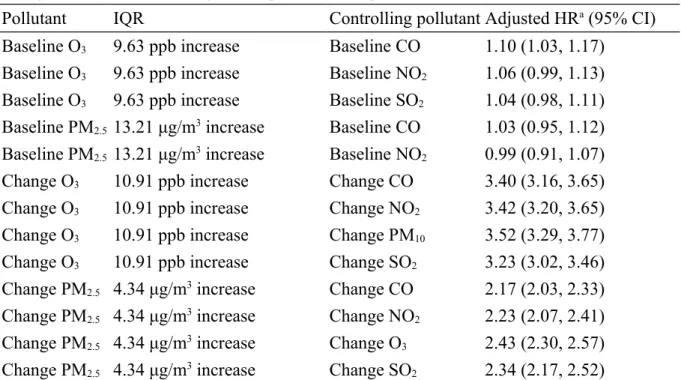
Table 6. Adjusted hazard ratios with 95% confidence intervals (CIs) of newly diagnosed Alzheimer’s disease (AD), corresponding to O3 and PM2.5 exposure at baseline as well as
change concentrations during follow period in two pollutant models.
Pollutant IQR Controlling pollutant Adjusted HRa (95% CI)
Baseline O3 9.63 ppb increase Baseline CO 1.10 (1.03, 1.17)
Baseline O3 9.63 ppb increase Baseline NO2 1.06 (0.99, 1.13)
Baseline O3 9.63 ppb increase Baseline SO2 1.04 (0.98, 1.11)
Baseline PM2.5 13.21 μg/m3 increase Baseline CO 1.03 (0.95, 1.12)
Baseline PM2.5 13.21 μg/m3 increase Baseline NO2 0.99 (0.91, 1.07)
Change O3 10.91 ppb increase Change CO 3.40 (3.16, 3.65)
Change O3 10.91 ppb increase Change NO2 3.42 (3.20, 3.65)
Change O3 10.91 ppb increase Change PM10 3.52 (3.29, 3.77)
Change O3 10.91 ppb increase Change SO2 3.23 (3.02, 3.46)
Change PM2.5 4.34 μg/m3 increase Change CO 2.17 (2.03, 2.33)
Change PM2.5 4.34 μg/m3 increase Change NO2 2.23 (2.07, 2.41)
Change PM2.5 4.34 μg/m3 increase Change O3 2.43 (2.30, 2.57)
Change PM2.5 4.34 μg/m3 increase Change SO2 2.34 (2.17, 2.52)
Abbreviations: NO2, nitrogen dioxides; PM2.5, particulate matter with aerodynamic diameter equal to or less than
2.5 μm; SO2, sulfur dioxide; O3, fourth-highest daily maximum average 8-hour ozone; CO, carbon monoxide. aAdjusted HR was adjusted for age, gender, income, diabetes mellitus, hypertensive disease, myocardial
Figure 3. The trend of annual 4th maximum of daily max 8-hour average ozone concentration in Taiwan during 2000-2010.
Figure 5. The trend of annual average concentration of PM2.5 in Taiwan during 2000-2010.