Restriction Mapping of Genes by Capillary
Electrophoresis with Laser-Induced Fluorescence
Detection
Konan Peck,*,†Shu-Li Wung,†Gau-Shuoh Chang,‡Jeffrey J. Y. Yen,†and You-Zung Hsieh*,‡
Institute of Biomedical Sciences, Academia Sinica, Taipei 11529, and Department of Applied Chemistry, National Chiao Tung University, Hsinchu 30050, Taiwan, ROC
Restriction mapping is one of the essential steps in gene analysis and molecular biology studies. Slab gel electro-phoresis is the traditional way to separate DNA fragments for restriction mapping. However, slab gel electrophore-sis does not provide sufficient resolution as required in many mapping applications, and the use of radioisotopes in traditional mapping methods creates health hazards. In the present study, capillary electrophoresis coupled with laser-induced fluorescence detection and a modified partial digestion mapping procedure was developed to map DNA fragments. By using capillary electrophoresis, a restriction map of a genomic λ phage clone of human interleukin 5 receptor r chain (IL5Rr) gene was con-structed. The IL5Rrgene was analyzed to have five XbaI enzyme cutting sites at locations 1370, 2290, 2950, 5430, and 9330. The system was further characterized by using pBluescript SK(+) phagemid DNA as a model. Using a sequence-derived map as a reference, the pBlue-script SK(+) restriction map constructed by capillary electrophoresis had an accuracy greater than 90%.
Capillary electrophoresis has been a popular technique for separating proteins, peptides, organic chemicals, and small frag-ments of DNA molecules. To successfully apply capillary elec-trophoresis to DNA analysis requires the detection of small amounts of materials and development of reproducible conditions for achieving good separation of DNA molecules in the molecular weight ranges of interest. Very sensitive fluorescence detection schemes for capillary electrophoresis have now been developed using combinations of laser excitation, spatial imaging, and sheath flow system.1-3 Capillary electrophoresis has been successfully
applied as a separation and analysis tool for DNA sequencing,4-7
restriction fragment length polymorphism,8PCR amplification,9
and others where the size ranges of DNA separation are on the
order of several hundred basepairs. However, when it comes to large DNA fragments separation, several hurdles imposed by the nature of large DNA molecules must be overcome before the technique can be useful.
Several attempts to separate large DNA fragments by capillary electrophoresis using viscous polymer solutions as separation media have been made.10-12 These techniques have successfully
demonstrated the separation of DNA fragments with sizes ranging from kilobasepairs to megabasepairs.13,14 These size ranges are
in the domain of gene mapping rather than the applications mentioned above. With the advent of large DNA fragment separation technology, the present report aims to point to a new direction of capillary electrophoresis application to gene map-ping.
To analyze the sequence of a large DNA molecule or a gene, the DNA molecule usually must be broken down into smaller fragments in order to be sequenced because the present DNA sequencing technology can only sequence fragments up to 500 bases in each run. In gene analysis, restriction mapping is usually required and is very often the step prior to sequencing so that the sequences obtained can be aligned in a correct order. Generating a restriction map, regardless of whether the material is from genomic DNA or complementary DNA (cDNA), is often done by a two-enzyme double- or three-enzyme triple-digestion method, followed by trial-and-error procedures to order a map. This method works fine for small number of restriction fragments generated by a restriction digestion. However, when the number of fragments increases, the task becomes increasingly difficult. Computer algorithms have been developed to construct restriction maps.15-17 These algorithms are usually capable of simultaneously
constructing maps of several restriction enzymes. When the number of restriction fragments becomes too large, the algorithms are both error prone and very slow in completing a map.
†Academia Sinica.
‡National Chiao Tung University.
(1) Cheng, Y. F.; Dovichi, N. J. Science 1988, 242, 562-564.
(2) Takahashi, S.; Murakami, K.; Anazawa, T.; Kambara, H. Anal. Chem. 1994,
66, 1021-1026.
(3) Milofsky, R. E.; Yeung, E. S. Anal. Chem. 1993, 65, 153-157.
(4) Swerdlow, H.; Zhang, J. Z.; Chen, D. Y.; Harke, H. R.; Grey, R.; Wu, S.; Dovichi, N. J. Anal. Chem. 1991, 63, 2835-2841.
(5) Huang, X. C.; Quesada, M. A.; Mathies, R. A. Anal. Chem. 1992, 64, 967 -972.
(6) Zhang, J.; Fang, Y.; Hou, J. Y.; Ren, H. J.; Jiang, R.; Roos, P.; Dovichi, N. J.
Anal. Chem.1995, 67, 4589-4593.
(7) Carson, S.; Cohen, A. S.; Belenkii, A.; Ruiz-Martinez, M. C.; Berka, J.; Karger, B. L. Anal. Chem. 1993, 65, 3219-3226.
(8) Principe, D. D.; Iampieri, M. P.; Germani, D.; Menichelli, A.; Novelli, G.; Dallapiccola, B. J. Chromatogr. 1993, 638, 277-281.
(9) Williams, S. J.; Schwer, C.; Krishnarao, A. S.; Heid, C.; Karger, B. L.; Williams, P. M. Anal. Biochem. 1996, 236, 146-152.
(10) Strege, M.; Lagu, A. Anal. Chem. 1991, 63, 1233-1236.
(11) Heiger, D. N.; Cohen, A. S.; Karger, B. L. J. Chromatogr. 1990, 516, 33 -48.
(12) Bocek, P.; Chrambach, A. Electrophoresis 1992, 13, 31-34. (13) Sudor, J.; Novotny, M. V. Anal. Chem. 1994, 66, 2446-2450. (14) Kim, Y.; Morris, M. D. Anal. Chem. 1995, 67, 784-786. (15) Pearson, W. R. Nucleic Acids Res. 1982, 10, 217-227.
(16) Miller, W.; Ostell, J.; Rudd, K. E. Comput. Appl. Biosci. 1990, 6, 247-252. (17) Tuffery, P.; Dessen, P.; Mugnier, C.; Hazout, S. Comput. Appl. Biosci. 1988,
4, 103-110.
Another widely used mapping method is the partial enzyme digestion method.18,19 Although a map can be easily drawn from
a well-performed partial digestion pattern, the map can be error prone because restriction fragments of similar size may not be fully resolved by agarose gel electrophoresis. Taking the Kohara
E. coli map as an example, the map was constructed by eight
restriction enzyme partial digestions of 3400 bacteriophage λ clones.20 Using computer and theoretical analyses to investigate
the Kohara map’s restriction site distribution patterns, Churchill et al.21estimated that 5
-15% of the Kohara map’s enzyme sites were, in fact, multiple sites. The same analyses also predicted that experimental errors on the measurements of small fragment sizes of several hundred basepairs were probably greater than 100%.
We recognize the advantages of partial digestion mapping. However, partial enzyme digestion mapping with agarose gel electrophoresis cannot accurately resolve enzyme restriction sites that lie less than 500 basepairs apart. This resolution limit of slab gel electrophoresis is usually the upper size limit of DNA sequencing and makes sequence alignment to a map more cumbersome.
Furthermore, for partial digestion mapping, the DNA molecule to be mapped must be labeled. The traditional way to end-label a DNA molecule in partial digestion mapping is to use radioisotopes such as32P. Because32P indiscriminately labels both
of the 5′-ends of double-stranded DNA, the labeled DNA molecules must be digested with a restriction enzyme that makes a single asymmetric cut to the DNA molecule. The two fragments of different sizes generated by the asymmetric restriction digestion must be separated by electrophoresis and excised from an agarose gel to obtain single-end-labeled fragments for the subsequent partial digestion. The end-labeling procedure, however, can be considerably simplified if laser-induced fluorescence detection is used in place of radioisotopic detection.
To demonstrate that capillary electrophoresis with on-column laser-induced fluorescence detection can be adopted to solve the poor resolution and tedious radioisotope end-labeling problems of traditional partial digestion mapping with agarose gel electro-phoresis separation, we use human interleukin 5 receptorRchain (IL5RR) gene as a model. Interleukin 5 (IL5) is a pleotropic cytokine that participates in both B cell maturation and eosinophil differentiation. Its biological functions are mediated through a surface specific receptor which is composed of a ligand-bindingRsubunit and a signal transducer β subunit. The IL5RR gene has been cloned, and its splicing junctions in the coding region have been mapped, but little is known about the promoter and gene regulation. To obtain genomic DNA sequence around the promoter region in order to delineate minimal sufficient promoter sequence of IL5RRgene expression, a restriction map is necessary before DNA sequencing can be applied.
This study presents a capillary electrophoresis method coupled with laser-induced fluorescence detection and partial digestion mapping procedure to map DNA fragments. Methods to end-label and to partially digest gene fragments were modified from traditional procedures or specifically developed to meet the goals.
To accurately estimate the size of each DNA fragment, charac-teristics of capillary electrophoresis are discussed. The system was further characterized by using pBluescript II SK(+) phagemid DNA as a model.
EXPERIMENTAL SECTION
Apparatus. Electrophoretic separation of DNA restriction fragments was performed in methylsilicone-coated fused silica tubing (DB-1, J&W Scientific, Folsom, CA) with a P/ACE 2100 instrument (Beckman Instruments, Inc., Palo Alto, CA). The 47 cm long (40 cm to the detector) capillary tubing was contained in a cassette, and sample injection was performed by electrokinetic injection for 10-30 s. On-column detection was performed by either UV absorption at 254 nm or laser induced fluorescence with 488 nm excitation and 520 nm emission detection. The temper-ature was maintained at 22.0(0.2°C.
Chemicals and Reagents. One kilobase ladder DNA (1 µg/
µL, Gibco-BRL, Gaithersburg, MD) was used as the molecular
weight marker. DNA restriction fragments were separated in TBE buffer containing 0.5% Methocel MC with viscosity of 3000-5000 mPa‚s at 2% in water, 20°C (Catalog No. 64630, Fluka Chemie AG, Buchs, Switzerland). All the buffer solutions and separation media were centrifuged at 3000g in a Model 1910 centrifuge (Kubota, Tokyo, Japan) to remove particulate matter. Fluorescein-conjugated deoxynucleotide (12-dUTP) and fluorescein-conjugated dideoxynucleotide (fluorescein-12-ddUTP) were ob-tained from Boehringer Mannheim (Mannheim, Germany), and deoxynucleotides (dNTPs) were purchased from Pharmacia Biotech (Uppsala, Sweden). Fluorescence-labeled 1 kb ladder was constructed according to the manufacturer’s instructions on the exchange reaction of T4 DNA polymerase (Promega, Madison, WI) and fluorescein-12-ddUTP.
All the restriction enzymes were purchased from New England Biolabs (Beverly, MA), thermally stable DNA polymerase for extra-long PCR was purchased from Perkin Elmer Co., and fluorescein-conjugated primers were custom-synthesized by Perkin Elmer. Extra-long PCR was performed by a Model PTC-100 programmable thermal controller (MJ Research, Inc., Watertown, MA) to amplify the target genes. The phagemid, pBluescript II SK(+), was purchased from Stratagene (La Jolla, CA).
The IL5RRgene cloned in EMBL3 vector was obtained by screening a human placental genomic DNA librarysan EMBL3 SP6/T7 library with inserts ranging from 8 to 12 kb in size cloned to BamHI sites (Clontech, Palo Alto, CA). The library was screened according to the manufacturer’s instruction by an IL5RR cDNA probe isolated from pSG5IL5RFL by EcoRI digestion.22One
positive clone (5RLHJ2) was purified to homogeneity, and the λ phage DNA was isolated by discontinuous CsCl gradient with standard procedures23for the subsequent restriction mapping.
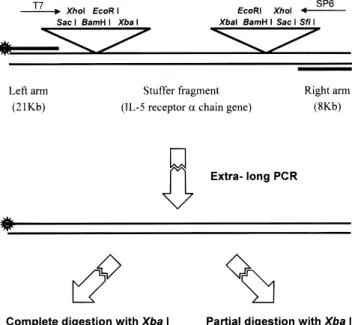
Partial Digestion Mapping of IL5RrGene. The procedure for partial digestion mapping of the IL5RRgene is summarized in Figure 1. A convenient way to end-label and to obtain a sufficient amount of the human IL5RR gene cloned in EMBL3 vector was to use the extra-long PCR reaction.24 To perform the
extra-long PCR reaction, two PCR primers, 5′
-fluo-GTCCGACT-(18) Rackwitz, H.; Zehetner, G.; Frischauf, A.; Lehrach, H. Gene 1984, 30, 195 -200.
(19) Her, C.; Weinshilboum, M. BioTechniques 1995, 19, 530-532. (20) Kohara, Y.; Akiyama, K.; Isono, K. Cell 1987, 50, 495-508.
(21) Churchill, G. A.; Daniels, D. L.; Waterman, M. S. Nucleic Acids Res. 1990,
18, 589-597.
(22) Yen, J. J. Y.; Hsieh, Y. C.; Yen, C. L.; Chang, C. C.; Lin, S.;Yang-Yen, H. F.
J. Immunol.1995, 154, 2144-2152.
(23) Maniatis, T.; Fritsch, E. F.; Sambrook, J. Molecular Cloning: A laboratory
Manual, 2nd ed.; Cold Spring Harbor University Press: Cold Spring Harbor,
NY, 1982; Chapter 2.
TATGCCCGAGAAGATG and 5′ -ACATGCCACACATGAGGAATAC-CG, targeted for the multiple cloning sites of the EMBL3 vector as shown in Figure 1, were synthesized. The former primer was conjugated with a fluorescein tag at the 5′-end to facilitate the end-labeling of the gene. The reaction mixture was prepared by first adding 12 µL of 3.3× PCR buffer, 4.4 µL of 25 mM Mg(OAc)2,
2 µL of 10 mM dNTP, 2 µL each of the primers (20 mM), and water to make 40 µL of solution. The solution was then overlaid with a layer of wax. Once the wax was solidified, 9 µL of 3.3× reaction buffer, 2 µL of the reaction template (107molecules/µL),
2 µL of Taq polymerase (Perkin Elmer, GeneAmp XL), and 19 µL of water were added to the top of the wax to constitute a hot-start PCR format. The extra-long PCR reaction was carried out by denaturing DNA at 94 °C for 1 min, followed by 17 cycles of temperature profiles between 94°C for 20 s and 68°C for 10 min, 13 cycles of temperature profile between 94°C for 20 s and 68°C for 10 min, with 15 s increment per cycle for the 68°C, and ending with a final extension at 72°C for 10 min.
To remove excess primers, the PCR-amplified product was purified by a 300 kDa membrane filter (Millipore, Bedford, MA). Two micrograms of purified fluorescence-labeled gene fragment was partially digested with XbaI restriction enzyme at five different enzyme quantities: 13.3, 4.4, 1.5, 0.5, and 0.3 units. The partial digestion reactions were carried out at 37°C for 30 min, followed by heat inactivation at 70°C for 20 min. The products of the five digestion reactions were mixed and then separated by capillary electrophoresis. Some restriction enzymes work in high-salt restriction buffers; under such circumstances, desalting may be required prior to injection.
A complete digestion of extra-long PCR-amplified IL5RRgene with XbaI restriction enzyme was carried out with standard restriction digestion procedure using enzyme and reaction buffer supplied by the manufacturer. The complete digestion products were separated by capillary electrophoresis with UV absorbance detection, was used to confirm the results of partial digestion mapping.
Partial Digestion Mapping of pBluescript II SK (+) Phagemid. As shown in Figure 2, for partial digestion mapping with fluorescence detection, the circular phagemid was linearized by a double digestion of two enzymes that each had only one restriction site on the phagemid. The linearization reaction was carried out at 37°C for 1 h by adding 15 µL of the phagemid (1
µg/µL), 8 µL of 5× EcoRI reaction buffer, 3 µL of EcoRI enzyme
(20 units/µL), 3 µL of PstI (20 units/µL) enzyme, and water to a total volume of 40 µL. The restriction digested product was inactivated by heating to 70 °C for 20 min, desalted, and concentrated with a 30 kDa membrane filter (Millipore Ultra-filter) to a final DNA concentration of 0.5 µg/µL. To end-label the DNA with fluorescent tag, 20 µL of linearized phagemid DNA (0.5 µg/
µL) was mixed with 5 µL of 10× Klenow buffer, 1.2 µL each of 2
mM dATP, dCTP, and dGTP, 2.4 µL of 1 mM dUTP-fluorescein, 3 µL of Klenow fragment (5 units/µL), and water to make 50 µL total volume. The labeling reaction was allowed to proceed for 20 min at 37°C and stopped by heating to 70°C for 20 min. The excess dUTP-fluorescein was removed by centrifugation with a spin column (Pharmacia, Uppsala, Sweden). Since PstI restriction digestion generates protruding 3′-ends, only the EcoRI digested end can be labeled by the action of the Klenow fragment. To partially digest pBluescript phagemid, the same procedure out-lined above for IL5RRgene was followed.
Figure 1. Schematic diagram illustrating the structure of the EMBL3 cloning vector with IL5RRgene insert and the flow chart of mapping the IL5RR gene. The two PCR primers are designed to anneal adjacent to but outside of the multiple cloning site of the cloning vector.
Figure 2. Schematic diagram showing the restriction map of pBluescript II SK(+) phagemid and the flow chart of mapping the phagemid by the methods described in this report.
RESULTS AND DISCUSSION
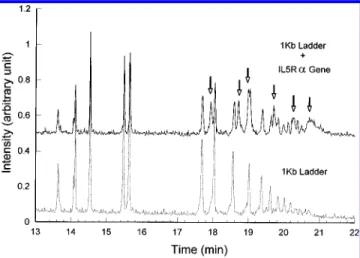
Figure 3 depicts the electrophoretograms of IL5RR gene fragments and 1 kb ladder markers. To determine the sizes of partially digested IL5RRgene fragments and to circumvent the reproducibility limitation of capillary electrophoresis, two rounds of capillary electrophoretic separation were performed. The fluorescence-labeled IL5RRgene fragments were first mixed with fluorescence-labeled 1 kb ladder markers and then separated by capillary electrophoresis with laser-induced fluorescence detection as shown in the upper trace of Figure 3. Then the fluorescence-labeled 1 kb ladder markers alone were separated under the same electrophoretic conditions as the 1 kb ladder marker-spiked IL5RR gene fragments. The lower 1 kb profile is used to identify IL5RR peaks in the upper electrophoretogram. The 1 kb ladder peaks, which were mixed and migrated together with the IL5RRpeaks, were used to calculate the size of the IL5RRgene fragments. After partial digestion by XbaI restriction enzyme, the IL5RRgene of 12.5 kb in length was separated into six fragments, as indicated by the arrows in Figure 3.
To estimate fragment sizes, although reptation theory25 can
better describe the behavior of DNA in slab gel, the simplified empirical model26of molecular sieving is generally assumed in
slab gel electrophoresis to establish the relation between mobility (D) and molecular weight (M) by the equation,
in which a and b are constants. Thus, the molecular weight of an unknown fragment can be calculated if two fragments of known sizes and distances migrated are included. To verify if the equation works well for DNA fragments separated in viscous solution under capillary electrophoretic conditions, the logarithm of the fragment sizes versus time was studied for the 1 kb ladder. As shown in Figure 4, inadequate linear correlation exists for the
whole 1 kb ladder marker from 298 to 12 216 bp.27 However,
satisfactory linear correlation can be found within a limited fragment size range, the linear correlation coefficient rxy)0.998 for the fragment size ranging from 298 to 517 bp, and rxy)0.996 for the fragment size ranging from 1018 to 12 216 bp.
To accurately estimate the size of each IL5RRgene fragment, the two 1 kb ladder fragments that immediately flanked the IL5RR gene were used as references. The sizes of the gene fragments were calculated to be 1370, 2290, 2950, 5430, 9330, and 12 500, as shown in Figure 5. The XbaI restriction map of the IL5RRgene can then be easily deduced from the partial digestion pattern as
(25) Noolandi, J.; Slater, G. W.; Lim, H. A.; Viovy, J. L. Science 1989, 243, 1456 -1458.
(26) Maniatis, T.; Jeffrey, A.; van de Sande, H. Biochemistry 1975, 14, 3787 -3794.
(27) Bendat, J. S.; Piersol, A. G. Random Data: Analysis and Measurement
Procedures; John Wiley & Sons: New York, 1971; Chapter 4.
Figure 3. Electrophoretograms of partially digested IL5RRgene fragments mixed with the 1 kb ladder marker and 1 kb ladder marker alone. The electrophoresis was run in 0.5×TBE buffer with 0.5% Methocel MC solution. The electric field strength was 150 V/cm, and the sample was introduced to the capillary by 9.4 kV electrokinetic injection for 3 s.
D)a-b log M
Figure 4. Fragment size versus time for the 1 kb ladder marker. The vertical axis is drawn in logarithmic scale. The sizes of the 17 marker fragments are 298, 344, 396, 506, 517, 1018, 1636, 2036, 3054, 4072, 5090, 6108, 7126, 8144, 9162, 10 180, 11 198, and 12 216 bp.
Figure 5. Electrophoretogram ofXbaI enzyme partially digested IL5RRgene fragments. The asterisks indicate the ends labeled with fluorescent tag, and the restriction map is constructed by aligning the fragments according to their sizes. The restriction map shown in this figure is not drawn to linear scale.
illustrated in Figure 5. The number and the positions of restriction sites of XbaI endonuclease were further confirmed to be accurate by a complete digestion and capillary electrophoresis separation with UV absorbance detection (data not shown).
To explore the accuracy of this capillary electrophoresis (CE) partial digestion mapping method, a restriction map of pBluescript phagemid was performed. The complete sequence of the phage-mid is known28and serves to estimate the accuracy of the capillary
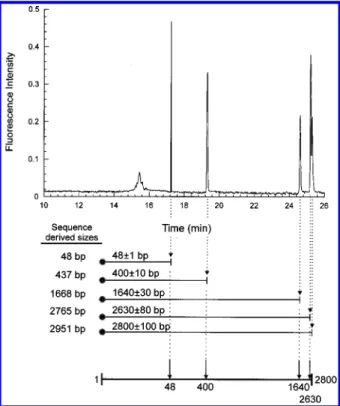
electrophoresis-derived map. As Figure 6 shows, the electro-phoretogram of pBluescript II partially digested by BanI enzyme was obtained by separating the fragments in 1× TBE buffer with 0.5% Methocel MC solution. The electric field strength was 150 V/cm, and the sample was introduced into the capillary by 9.4 kV electrokinetic injection for 3 s. The restriction map of BanI endonuclease on the phagemid is deduced from the electrophore-togram and is displayed in Figure 6, along with sequence-derived fragment sizes. The positions of the restriction sites were
calculated as described for the IL5RRgene and were 48(1, 400 (10, 1640(30, 2630(80, and 2800(100, after repetitive runs. Compared with sequence-derived restriction sites (48, 437, 1668, 2765, and 2951), the accuracy of CE partial digestion mapping method is better than 90%.
However, some characteristics of capillary electrophoresis might affect the outcome of restriction mapping if they are not treated properly. In capillary electrophoresis, migration time can be greatly affected by ionic strength of the running buffer. This phenomenon was demonstrated by comparing the electrophore-togram of IL5RRgene, which was run in 0.5× TBE buffer, with the electrophoretogram of pBluescript II phagemid, which was run in 1× TBE buffer. Although the ionic strength affected the migration rate substantially, it did not alter the separation resolution significantly from our observations. Besides the effect of ionic strength, the run-to-run variation in migration time can be very troublesome in calculating the sizes of DNA fragments. Therefore, it is emphasized that one must not calculate the molecular weights of a sample on the basis of a calibration curve set up from a different run. To circumvent the problem, the procedure to have both samples and markers separated in the same run as outlined in this report and illustrated by Figure 3 is absolutely necessary to achieve reliable results.
By using capillary electrophoresis with laser-induced fluores-cence detection for gene mapping, we can avoid the use of hazardous radioisotopes. Furthermore, because32P is labeled on
both 5′-ends of a double-stranded DNA, one must perform an asymmetric digestion on the dsDNA and recover single-labeled fragments for partial digestion. With the fluorescence end-labeling methods described in this report, one can selectively label a particular end of a double-stranded DNA and perform partial digestion mapping without the additional asymmetric digestion and separation required in the traditional radioisotopic method. The molecular weight range of separation by the CE system described in the present study can be modified toward larger DNA fragment separation. The buffer used in this report has been very reliable in separating DNA fragments around kilobasepair size. Newer separation matrices and pulsed-field separation conditions for gene mapping purposes are currently under investigation in our laboratory.
ACKNOWLEDGMENT
This work was supported by Academia Sinica and the National Science Council of the Republic of China under Grants NSC-84-2331-B-001-023 (K.P.) and NSC-84-2113-M-009-014 (Y.-Z.H.).
Received for review September 19, 1996. Accepted January 21, 1997.X
AC9609586
(28) GenBank Accession Number, X52328. XAbstract published in Advance ACS Abstracts, March 1, 1997.
Figure 6. Electrophoretogram of BanI endonuclease partially digested pBluescript II phagemid fragments. The asterisks indicate the ends labeled with fluorescent tags, and the restriction map is constructed by aligning the fragments according to their sizes. The fragment sizes derived from the documented sequence of the phagemid are shown next to the CE-derived fragment sizes for comparison. The map illustrated in this figure is not drawn to linear scale.