行政院國家科學委員會專題研究計畫 成果報告
多角度驗證軀體標記假說之建構、生理反應關連性以及神
經處理機制(第 2 年)
研究成果報告(完整版)
計 畫 類 別 : 個別型 計 畫 編 號 : NSC 96-2413-H-004-008-MY2 執 行 期 間 : 97 年 08 月 01 日至 98 年 07 月 31 日 執 行 單 位 : 國立政治大學心理學系 計 畫 主 持 人 : 顏乃欣 共 同 主 持 人 : 廖瑞銘、鄭中平 計畫參與人員: 學士級-專任助理人員:周怡岑 碩士班研究生-兼任助理人員:仲惠瓘 碩士班研究生-兼任助理人員:張瀠方 碩士班研究生-兼任助理人員:陳佩鈴 碩士班研究生-兼任助理人員:劉子菱 碩士班研究生-兼任助理人員:林軒宇 大專生-兼任助理人員:林冠穎 大專生-兼任助理人員:高常豪 報 告 附 件 : 國外研究心得報告 出席國際會議研究心得報告及發表論文 公 開 資 訊 : 本計畫可公開查詢中 華 民 國 98 年 10 月 31 日
行政院國家科學委員會補助專題研究計畫
5成果報告
□期中進度報告
多角度驗證軀體標記假說之建構、生理反應關連性以及神經處
理機制
計畫類別:
5個別型計畫 □整合型計畫
計畫編號:NSC 96-2413-H-004-008-MY2
執行期間:
96 年 8 月 1 日至 98 年 7 月 31 日
計畫主持人:顏乃欣
共同主持人: 廖瑞銘、鄭中平
計畫參與人員:
周怡岑、仲惠瓘、張瀠方、劉子菱、陳佩鈴、林軒宇、高常豪、林冠穎
成果報告類型(依經費核定清單規定繳交):
□
精簡報告 5完整報告
5成果報告包括以下應繳交之附件:
5赴國外出差或研習心得報告一份
□
赴大陸地區出差或研習心得報告一份
□
出席國際學術會議心得報告及發表之論文各一份
□
國際合作研究計畫國外研究報告書一份
處理方式:除產學合作研究計畫、提升產業技術及人才培育研究計畫、列管
計畫及下列情形者外,得立即公開查詢
□涉及專利或其他智慧財產權,□一年□二年後可公開查詢
執行單位:國立政治大學心理系
中
華 民 國 9 8 年 1 0 月 3 1 日
1
Examining the Construct, Physiological, and Neural Correlates of
Somatic Marker Hypothesis with Multiple Approaches
Introduction
The Somatic Marker Hypothesis (SMH) is a prospective and influential hypothesis that Damasio proposed to explain how emotion guides individual’s
decision making (Damasio, 1994). Based on an ingenious task named Iowa Gambling Task (IGT) which is designed to mimic real life decision making, Damasio and his colleagues proposed a neural loop which underlines people’s decision making behavior, and they also extend the body of SMH by investigating the relationship between the SMH and other cognitive or emotional functions such as working memory, inhibition, etc.
It is important to note that although many studies have provided evidences consistent with the SMH, there are still a number of reports which did not. While considering the reason for the mixed findings, it is suspected that 1) the IGT consists various components which may complicate interpretations driven from it, 2) the measurement that Damasio used to index somatic marker (i.e. SCR) is not sensitive to capture the processes of decision making, and 3) studies with patients or physiological measurement are limited in extracting causal relationship.
For the reasons mentioned above, in this two year integrative project, we have examined the construct of IGT, explored the physiological correlates of decision making, fitted cognitive modeling method ,and investigated the event-related potential (ERP) which interact with different components of the IGT.
The Somatic Marker Hypothesis
The SMH proposed that decision making is guided by emotion. According to Damasio (1994), somatic state (e.g. gut feeling) related to past emotional experiences, either positive or negative, will appear as guidance or alarm before individuals make a decision. If the somatic state is negative, it may lead individuals to avoid from this choice. In contrast, if it is positive, individuals will select this choice based on this “attractive marker”. In order to empirically test the SMH, Damasio and his colleague designed a task named Iowa Gambling Task (IGT) in which immediate gain and
2 delayed loss are mixed with uncertainties and conflicts, just like what people face in everyday decision making (Bechara, Damasio, Damasio, & Anderson, 1994). In this task, four decks associated with different gain and loss was presented in front of participants. Two of the decks (labeled A and B) are categorized as bad decks, and the rest two (labeled C and D) are good decks. Participants do not know which decks are good or bad, and are instructed to reveal it in order to win money as much as
possible. Each time when a card from bad decks being selected, participants gain US $100 (i.e. immediate gain). On the other hands, selecting a card from good decks always brings a US $50 gain. Regarding to the immediate gain, the bad decks are better than good decks. However, another component, delayed loss, is also in the task. Because the sometime-appeared delayed loss is larger in bad decks (up to US $1250) than in good decks (up to US$350), when considering the net outcome, selecting cards from good decks will make participants win more (see Figure 1).
For winning money in the IGT, both immediate gain and delayed loss should be considered. It was shown that normal
participants could well deal with both of these information and consequently
performed well in the task, regardless if they finally penetrated the task rationale or not (Bechara, Damasio, Tranel, & Damasio, 1997a). More intriguingly, the SCR, as representing the somatic markers, was skyrocketed before participants selected cards from bad decks (see Figure 2; SCR measured before making a decision is called “anticipatory SCR”). The elevated
anticipatory SCR, serving as alarms, warns
3
There are indeed many components mixed in the IGT thus make it difficult to interpret results from it. For example, differences between good and bad decks are not restricted in the immediate versus delayed outcome, but also the magnitude when only gain being considered. As the result, the reason VMPFC selected more cards from bad decks may not because of myopia, but rather is likely that they are insensitive to the punishment, or are hypersensitive to the reward of bad decks. In addition, playing IGT advantageously requires the ability of inhibiting initial preference of the bad decks (they are relative good until the fist punishment happens), thus poor IGT performance of VMPFC patients may be accounted by their impairment in inhibition alternatively (Rolls, 1999).
Multiple Components in IGT Confounds Interpretation from Its Results
Gain Magnitude and Inhibition
For defending the first confounding Damasio and his colleagues modified the IGT (IGT-R) and made the gain and loss course being reversed (i.e. immediate loss, delayed gain). The results showed VMPFC patients, in order to avoid from immediate loss, did select more from decks associated with smaller gain (Bechara, Tranel, & Damasio, 2000b). Thus, the confounding of “insensitive to loss” or “hypersensitive to gain” was excluded out. For defending “impaired inhibition” confounding, Damasio and his colleagues argued that the VMPFC patients showed normal inhibition behavior both in the IGT (i.e. shifting from deck to deck) and in other clinical tasks. Thus the confounding of “inhibition” may be less possible (Bechara, Damasio, & Damasio, 2000a).
Risk
Although some critiques to SMH have been defended, some have not. As noted in Dunn, Dalgleish, and Lawrence (2006), bad decks are relatively risky (i.e. larger win and larger loss). It is likely that VMPFC patients prefer to behave riskily merely, instead of any impairment in anticipation for future. Another study which aided consistent evidence to Dunn and his colleagues’ suspection is from Tomb and his colleagues, in that they revealed that the high anticipatory SCR for bad decks might reflect an expectation of “making an risky choice”, rather than net expected value of the deck outcome (Tomb, Hauser, Deldin, & Caramazza, 2002).
Probability
4
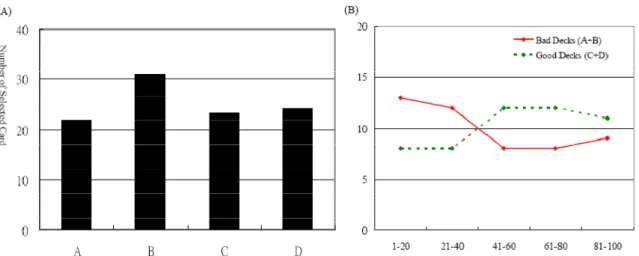
between deck C and D, are not equal. This may result in different preference within decks in the same valence category. It is surprising that few works have been done about this issue, but in our preliminary data it was showed that normal colleague students (n=19) preferred deck B more than deck A, whereas there is no difference within good decks (see Figure 3). Indeed, the frequency of feeling win may influence participant’s selection as well, thus it will complicate the cost-benefit calculation by the VEPFC through SM operation.
Figure 3 Our preliminary data shows (A) participants selected relative more cards from deck B than
from the other three, and (B)participants gradually performed more advantageously when trials went on.
Using SCR Only is Not Enough to Examine Somatic States
SCR Reflects for Arousal but not Valence
In all the studies by Damasio and his colleagues, magnitude of SCR is considered as an index of the valence of options. High anticipatory SCR thus can predict bad choice, and contrarily low SCR can predict good choice. It is worthwhile to note that, however, a great number of studies have demonstrated that SCR is not sensitive to valence dimension, but is to arousal dimension (e.g. Cuthbert, Schupp, Bradley, Birbaumer, & Lang, 2000; Lang, Greenwald, Bradley, & Hamm, 1993). That is to say, SCR may be similar to positive and negative events (as can be seen in
Damasio and his colleague’s response to Tomb et al., 2002). Therefore, interpreting from anticipatory SCR is problematic because it might be the case that normal
participants may experience positive emotion with high arousal before selecting cards from bad decks. This will undermine the basic notion of the SMH because emotions might be irrelevant to the later decision making in this case.
5
Anticipatory SCR Represents Other Concepts
In SMH, the anticipatory SCR observed before card selection predicts the expected outcomes for a particular selection, thus it can be used to guide the ongoing decision making. However, as mentioned above, since the bad decks are related risky, the higher anticipatory SCR before bad deck selection may alternatively reflect prediction for risky choices, rather than expected outcomes. For testing this hypothesis, Tomb et al. (2002) created a modified IGT in that the good decks are relatively risky. As predicted, higher anticipatory SCR was found preceding to good deck selection, which could not be explained by the SMH.
In addition to reflect risk prediction, anticipatory SCR is also suspected not to be directly involved in decision making process. It is true that SCR has slow time course and is not able to be distinguished for different phases that participants experience before selecting a particular card: 1) ponder which card to be selected, and 2) motor action for executing the response. If the anticipatory SCR reflects the first phase, it could be considered to be helpful to decision making. However, Amiez and her colleague’s works with monkeys suggested that the anticipatory SCR may reflect the second phase and may represent the outcome expectation after decision has been already made (Amiez, Procyk, Honore, Sequeira, & Joseph, 2003).
Works Concerning to SMH in Present Project
In the past decade, studies concerning to SMH have been accumulated fruitfully with diverse issues, including working memory (Bechara, Damasio, Tranel, & Anderson, 1998; Hinson, Jameson, & Whitney, 2002; Jameson, Hinson, & Whitney, 2004), consciousness (Bechara et al., 1997a; Maia & McClelland, 2004), gender difference (Bolla, Eldreth, Matochik, & Cadet, 2004; Garon & Moore, 2004;
Overman, 2004; Reavis & Overman, 2001), reinforcement type (Bowman & Turnbull, 2003), substances abusers (Bechara, & Damasio, 2002), developmental issue (Crone & van der Molen, 2004; Kerr & Zelazo, 2004; Overman, Frassrand, Ansel, Trawalter, Bies, & Redmond, 2004), individual difference within normal people (Carter & Smith-Pasqualini, 2004; Suzuki, Hirota, Takasawa, & Shigemasu, 2003), and difference between normal individuals and psychopathic patients (Cavedini, Bassi, Zorzi, & Bellodi, 2004; Gonzalez, Vassileva, Bechara, Grbesic, Sworowski, & Novak, 2005; Schmitt, Brinkley, & Newman, 1999).
In addition, SMH is also studied with modeling methods. For example, Yechiam, Busemeyer, Stout, and Bechara (2005) used three parameters to distinguish 10 clinical populations (e.g. alcohol abuser, VMPFC lesion patients, cannabis abuser, etc.). Their findings, consistent with empirical observations, showed that individuals in different population give different weightings to the three parameters. For example, VMPFC
6
patients overweight the value of recent outcome, whereas patients with Asperger’s 7 syndrome show hypo-weightings to gain. Since the modeling method will be used in the present study, how the expectancy-valence learning model (Busemeyer & Stout, 2002) applied to the IGT will be introduced next.
To clarify the possible explanation of the observed results, one can design new experiments or use the method of cognitive modeling. In the following section, how the expectancy-valence learning model (Busemeyer & Stout, 2002) applied to the IGT will be introduced.
Summary
In this project, several questions about SMH are attempted to be answered, including confoundings in IGT interpretation and limitation of the use of SCR. While most of these issues here are still waited to be explored, in this project, we will explore the construct of the Iowa gambling task, the mechanism of somatic marker operation, and the nature of human decision making.
Methods
I. Study One
In study one, the original IGT experiment is replicated in normal healthy
participants. A mild modification in task design, however, is to make the time window of pondering being fixed (i.e. 6 s), in order to have sufficient time window for SCRs change recording. In addition to physiological measurements, a self-reported
questionnaire, namely the Life Experience Question (LEQ; Zuckerman & Kuhlman, 2000), is proceeded after participants finish the IGT, in order to examine individual difference in risk-taking tendency. Furthermore, the cognitive modeling is applied in the present study to understand the possible processes of IGT components.
Participants
Forty-two healthy, right-handed (assessed by Edinburgh Handedness Inventory; Oldfield, 1971) undergraduate students from National Chengchi University were recruited in this study .They were paid NT $150 for each hour participation.
Task (199 from Eac and the deck the are Unk to p Pro part form nois cm incl wor Res Beh mea sele for e sect and repr type k A computer 99), is used m one of the ch deck cons the other h positive ver ks whereas beginning o encouraged known to th play until the
ocedure Upon arriva ticipated in, m, and the E se-attenuate from eyeba luding SCR rks being do
sults and dis
havioral Da For the beh asure, we su ections into each block tions from d decks C/D resents the r e and block rized versio in this stud e four decks sists of 40 c half with red rsus negativ deck C and of the task, d to learn to he participan e computer al, participa , and next w Edinburgh H ed individua all to the scr , was proce one. scussion ata havioral IGT ubdivided th five blocks we counted decks A/B ( (advantage results as a . A 2(deck t on of IGT, a dy. In each t s (labeled A cards, with h d face (while ve expected d D are as go and while th stay at goo nts, there ar stops the g
ants were fir were asked t Handedness al room, and reen center) eeded subseq T performan he 100 card of 20 cards d the numbe disadvantag eous). Figur function of type: good v 7 as completel trial, particip A, B, C, and half with bl e mixed out value, deck ood decks. P he expected od decks for e totally 10 ame). rstly given a to complete Inventory. d to seat in f . Preparatio quently, and nce s, and er of geous) re 4 f deck vs. bad) ly identical pants are in d D) laying o ack face (w tcome of ga k A and B th Participants d values of d r winning m 0 trials in th a brief abou consent for Participants front of com on for physio d the IGT w to that in B nstructed to out on the c while outcom
ain and loss) hus are cate s are given N decks are di money as mu he task (they ut the experi rm, persona s then were mputer mon ological rec was started a Bechara et al select one c computer sc me of gain o ). Regardin egorized as b NT $2000 i ifferent, the uch as possi y are instru iment he/sh al informatio led to a nitors (60-10 cording, after all abov
l. card creen. only) g to bad in ey ible. cted he on 00 ve
× 5 betw part from Ant Figu adv The mea asso wer asso ( t(3 anti deck sele
II.
the mag may neg risk see and card anti SCR (block) AN ween decks ticipants gra m the bad de ticipatory S For the SCR ure 5 shows antageous a e SCR data a asures t-test ociated with re significan ociated with 37)=2.014, p icipatory SC k selection ection.Study Tw
The SMH c bad decks. gnitude of re y reflect the ative conse ky decision o Table 1) in punishmen ds from the icipatory SC R reflects th NOVA on th and blocks adually shif ecks (A/B). SCR Data R data (38 e s the anticip and disadva are analyze ts. Anticipat h the disadv ntly higher t h the advant p < .051). It CRs are high than beforewo
claims that t However, in eward and p e componen quences. In or incorrect which the g nt than bad d good than b CR for good he higher-m he number o ( F(4,164)= ft their prefe effective sam patory SCRs antageous de d in repeate tory SCRs vantageous d than those tageous dec t revealed th her before b e good deck the elevated n the origin punishment ts associate n order to ex t decision, T good decks decks. The r bad decks, a d deck. Thus magnitude de 8 of cards sele = 16.999, p erence towa mples), s for ecks. ed decks cks hat bad d anticipator nal IGT, thet than the go ed with the b xamine whe Tomb et al. ( were assoc result revea and this sele
s, Tomb et a ecisions inst
ected reveal <.000). Thu ard the good
ry SCR on t bad decks a ood decks. T bad decks ra ther the ant (2002) used iated with h aled that par ection was a al. suggeste tead of inco
led significa us, our data d decks (C/D the IGT is a are associat Thus, the an ather than th ticipatory SC d a modified higher magn rticipants pi accompanie ed that the an orrect decisi ant interacti a show that D) and away associated w ted with hig nticipatory S he long-term CR reflects d IGT (IGT-nitude rewa icked more ed by higher nticipatory ions. ons y with gher SCR m the -T, rd r
9
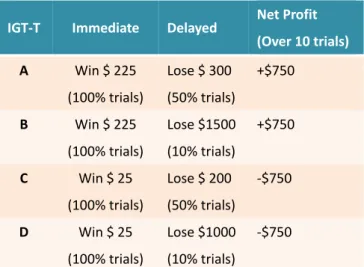
Table 1 Payment schedule of the IGT-T (Tomb et al., 2002) In study two, in order to examine whether the anticipatory SCR reflects the
expectation of higher-magnitude decisions or incorrect decisions, the IGT-T
experiment is replicated first and a new experiment is developed to further explore the issue. In the new experiment (IGT-A), good and bad decks are associated with either smaller or higher magnitude of reward and punishment. In another word, the
consequences of the deck (positive and negative) and the variance of reward and punishment (low or high) are manipulated.
Experiment One
The modified IGT (IGT-T) in Tomb et al. (2002) study was replicated in experiment one.
Participants
Thirty-six healthy, right-handed (assessed by Edinburgh Handedness Inventory; Oldfield, 1971) undergraduate students from National Chengchi University were recruited in this study. They were paid NT $150 for each hour participation. Task
In the IGT-T, the good decks (A&B) were associated with higher magnitude of reward and punishment than bad decks (see Table 1). Selections from deck A and B bring a 100% gain of NT $225 every trial, but may also cause 50% loss of $300 for deck A or 10% loss for $1500 for deck B. Consequently, every selection from deck A or B leads to an expected value of +$75. In contrast, selections from deck C and D bring a smaller 100%
gain of $25, and deck C is associated with 50% loss of $200, and deck D is associated with 10% loss of $1000.
As the result, every selection from deck C or D leads to an expected value of $-75. Regarding to the positive versus negative expected value, deck A and B thus are categorized as good decks whereas deck C and D are as bad decks. In the present experiment, the gain and loss used in every situation is listed in Table 1.
IGT‐T Immediate Delayed Net Profit
(Over 10 trials) A Win $ 225 (100% trials) Lose $ 300 (50% trials) +$750 B Win $ 225 (100% trials) Lose $1500 (10% trials) +$750 C Win $ 25 (100% trials) Lose $ 200 (50% trials) ‐$750 D Win $ 25 (100% trials) Lose $1000 (10% trials) ‐$750
Pr in st Res Beh from sele than Ant patt stati reve acco rocedure Procedure, tudy one.
sults and dis
havioral Da For the beh m good deck ected from d n bad decks ticipatory S For the SCR tern as the b istical signi Although th ealed that pa ompanied b physiologic scussion ata havioral IGT ks ( t(35)= decks across . SCR Data R data (35 e behavioral d ificance ( t(3 here is no si articipants p by higher an cal recordin T-T perform 10.134, p < s the 100 tra effective sam data (see Fig
34)=.588, n ignificant d picked more nticipatory S 10 ng, and data mance measu .000) . Figu ails, particip mples), the gure 7). How ns.). difference fo e cards from SCRs for go a analysis ar ure, particip ure 6 shows pants choos anticipatory wever, the S or the anticip m good deck ood decks th re the same pants selecte the total nu se more card y SCRs sho SCR data di patory SCR ks, and this han for bad
as those use ed more car umber of ca ds from goo ow the same id not reach Rs, the data selection w decks. ed rds ard od e h was
11
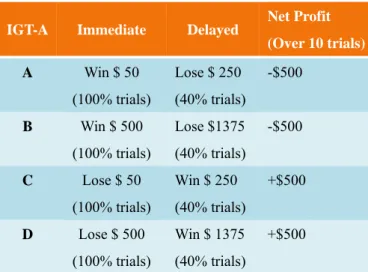
Table 2 Payment schedule of the IGT-A
Experiment Two
A modified IGT called IGT-A (Amount of punishment) is used in experiment two. In IGT-A, the amount of punishment is manipulated, but the probability of
punishment is kept constant. Participants
Forty-one undergraduate students from National Chengchi University were recruited with the same constraints as that in study one.
Task and Experimental Design In the IGT-A, good and bad decks are associated with either smaller or higher magnitude of reward and punishment (see Table 2). In IGT-A, selections from deck A and B bring a 100% gain every trial, in specific, NT $50 in deck A and $500 in deckB, but there is 40% loss of $250 for deck A or 40% loss for $1375 for deck B. Consequently, every selection from deck A or B leads to an expected value of
$-50. In contrast, selections from deck C and D bring a 100% loss, in specific, $-50 in deck C and $-500 in deck D, but deck C is associated with 40% gain of $250, and deck D is associated with 40% gain of $1375. As the result, every selection from deck C or D leads to an expected value of $50. Regarding to the positive versus negative expected value, deck A and B are categorized as bad decks whereas deck C and D are as good decks. For the low versus high risk, deck A and C are categorized as low risk decks whereas deck B and D are as high risk decks. Thus, there are two variables manipulated in this experiment, namely, the consequences of the deck (positive and negative) and the variance of reward and punishment (low or high).
Procedure
A computerized version of IGT-A was used. The procedure is identical to that of Bechara et al. (1994) (see Figure8). The substantial differences are that each deck
IGT-A Immediate Delayed Net Profit
(Over 10 trials) A Win $ 50 (100% trials) Lose $ 250 (40% trials) -$500 B Win $ 500 (100% trials) Lose $1375 (40% trials) -$500 C Lose $ 50 (100% trials) Win $ 250 (40% trials) +$500 D Lose $ 500 (100% trials) Win $ 1375 (40% trials) +$500
con Figu Res Beh mea func AN as w sign valu p<.0 part sists of 40 c ure8: The ti
sults and dis
havioral Da For the beh asure, Figur ction of dec OVA was p within-subje nificant inte ue and risk l 000). Furthe ticipants ma cards and th ime course scussion ata havioral IGT re 9 represen ck and risk t processed w ect variables eraction betw level ( F(1,4 er analyses ade more ris
he sequence
of each trai
T-A perform nts the resu type. A
two-ith deck and s. There wa ween expec 40)=16.304 indicated th sky choices 12 e of every 10 il mance lts as a -way d risk s a ted 4, hat in bad
0 cards is raandomly ass
B A signed. D C D C
13
decks and chose more bad decks in high risk condition.
Anticipatory SCR Data
Anticipatory SCR was measured with a 4s window which synchronizes with card selection. For the SCR data (39 effective samples), a two-way ANOVA was processed with deck and risk as within-subject variables. There was a significant interaction between expected value and risk level ( F(1,38)=4.159,
p<.048). The anticipatory SCRs show the
same pattern as the behavioral data (see
Figure 10). This data revealed that
anticipatory SCR was associated with the risk level of the decks.
The results of the study two did not support somatic maker hypothesis as Damasio (1994) proposed. Participants did not choose more good decks, and the anticipatory SCR did not work as an alarm to make participants away from bad decks. On the contrary, participants made more risky and bad choices even when the
anticipatory SCR associated with them were higher.
To answer the question whether the anticipatory SCR reflects the risky decision or incorrect decision, the result from the present experiment suggests that the
anticipatory SCR seems to reflect both risky and incorrect decisions.
III. Study Three.
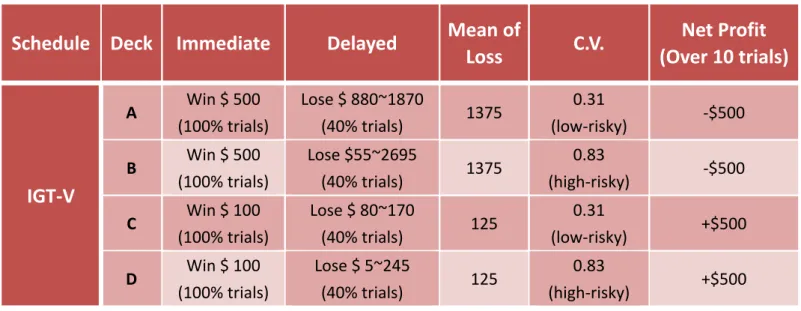
In order to further clarify the SMH, the expected values and risk levels were manipulated in our modified IGT (IGT-V, see Table 3).
Participants
Thirty-four undergraduate students from National Chengchi University
D C B
14 participated in the present study.
Task
In study Three, the expected value and risk level were manipulated in our modified IGT (IGT-V, see Table 3). In good decks, the immediate gain and delayed loss are smaller, which leads to positive expected values. In bad decks, the immediate gain and delayed loss are larger, which leads to negative expected values. In other words, conflict choices were constructed as the original IGT. The risk level was manipulated by the magnitude of coefficient of variation. For the same expected value conditions, the mean of punishments was kept the same, but the variation of
punishments was different. Simply stated, the high risk decks were associated with a larger range of variation than the low risk decks.
Two variables are manipulated in this experiment, namely, the consequences of the deck (positive and negative) and the degree of variation (low and high). Regarding to the positive versus negative expected value, deck A and B are categorized as bad decks whereas deck C and D are as good decks. For the low versus high risk, deck A and C are categorized as low risk decks whereas deck B and D are as high risk decks. Table 3 The card schedule of IGT-V
Procedure
A computerized version of IGT-V was used. The procedure was identical to that of Bechara, Damasio, Damasio, & Lee (1999) (see Figure 8). The substantial differences are that each deck consists of 80 cards and the sequence of every 10 cards is randomly assigned.
During the IGT task, the SCR and EEG were continuously recorded. The SCR
Schedule Deck Immediate
Delayed
Mean of
Loss
C.V.
Net Profit
(Over 10 trials)
IGT‐V
A Win $ 500 (100% trials) Lose $ 880~1870 (40% trials) 1375 0.31 (low‐risky) ‐$500 B Win $ 500 (100% trials) Lose $55~2695 (40% trials) 1375 0.83 (high‐risky) ‐$500 C Win $ 100 (100% trials) Lose $ 80~170 (40% trials) 125 0.31 (low‐risky) +$500 D Win $ 100 (100% trials) Lose $ 5~245 (40% trials) 125 0.83 (high‐risky) +$500reco anal fron EEG Res Beh with inte Furt cho Ant sele Figu Figure11: T ording was a lyzed by Ac ntal scalp po G electrode
sults and dis
havioral Da A 2(deck t hin-particip eraction betw ther analyse se more bad ticipatory S Anticipato ection. The a ure 12). Ho The interact and risk lev
acquired via cqKnowledg ositions (F3 positions. N scussion ata type: good v ant ANOVA ween deck t es indicated d decks in h SCR Data ory SCR wa anticipatory owever, the i tion betwee vel in deck a an MP150 ge 3.91 soft and F4) ac NeuroScan vs. bad) × 2 A on the num
type and ris d that partici high risk con
as measured y SCR show interaction n expected selection 15 0 system (B tware for W ccording to t software wa 2(risk level: mber of car k level ( F( ipants made ndition. d with a 6s w wed the sam
did not reac
value BIOPAC Sys Windows. EE the Internat as used for high vs. lo ds selected (1,33)=11.44 e more risky window wh me pattern as ch statistica Figure12 stems), and EG was reco ional 10-20 acquisition w) × 5(bloc revealed a 42, p<.01, s y choices in hich synchro s the behavi al significan 2: Anticipato it was orded from 0 System of and analys ck) significant see Figure 1 n bad decks onizes with oral data (se ce. ory SCR of es. 11). and card ee f four decks
EEG unit thro hem p<.0 ( F( reve Figu T Part as a mad SCR T inco anti part T G data Regarding ts, band pas ough a Ham A 2(deck t misphere) w 05). There w (1,33)=4.46 ealed the sa ure13: The The results o ticipants did an alarm to m de more risk R was highe To answer th orrect decisi icipatory SC ticipants are This study in g the EEG r ss filtered (0 mming windo type: good v ithin-partici was a signif 8, p<.05, se ame pattern interaction of the presen d not choose make partic ky and disad er. he question ion, the resu CR may refl e more willi nvestigated recording, si 0.01-30Hz). ow. vs. bad) × 2 ipant ANOV ficant intera ee Figure 13 as behavior between ex nt study do e more good cipants away dvantageou whether the ult from the lect both ris ing to make the relation 16 ignals were All epochs 2(risk level: VA revealed action betwe 3). It is inter ral data. xpected valu not support d decks, and y from bad s choices ev e anticipator e present exp sky and inco e risky choic nship betwe amplified w s 4096ms in high vs. lo d a main eff een deck typ
resting that ue and risk l t somatic m d the anticip decks. On t ven when th ry SCR refl periment su orrect decisi ces in bad d en EEG act with NeuroS duration w w) × 2(righ fect of risk ( pe and risk anticipatory level in alph maker hypoth patory SCR the contrary he associate lects the risk uggests that ions. It seem decks. tivity and th Scan amplif were extracte ht vs. left (F(1,33)=4. level y EEG also ha activity hesis. R did not wo y, participan ed anticipato ky decision the ms that he sensitivity fier ed 804, o ork nts ory n or y
17
for expected value and risk level using the modified IGT. These preliminary findings may have some interesting indications, for example, the alpha trend might refer to an active brain state in which neurons are ready to run at the sudden release of inhibition (Knyazev & Slobodskaya, 2003)
IV
.Study Four.
The IGT consists of various components which are confounded with each other, such as expected value, risk level, immediate/delay, etc. The confounding variables may complicate interpretations driven from it. One way to clarify the effects of confounding variables is to manipulate these variables independently. Another way is to use cognitive modeling to dig out the underlying processes. Furthermore, the quality of a computational model should not only reflect on its overall goodness of fit, but also on the manipulation of the experimental design. In the study five, two
decision making models are compared through four IGT with different manipulation. The aim of this study is to examine whether the cognitive modeling can model the psychological meaning of different experiment manipulation. In this article, two cognitive learning model for gambling task are selected for comparison. One is Expectancy-valence learning model (EV model) (Busemeyer & Stout, 2002; Yechiam & Busemeyer, 2005), and the other is later proposed by Ahn, Busemeyer,
Wagenmakers, & Stout(2008).
EV-model
The EV learning model is based on three step learning processes. First, an utility function is used to evaluate the outcome utility from payoff. Second, a learning
function is using the evaluated utility to update the expectancy of each deck. Finally, a choice rule then applied to make next choice from the expectancy of each deck.
Weighted utility function. In EV-model, the evaluation of payoff on trial t is
represented by an utility function which use a weighted combining of gain and loss of each trial t, u(t):
u(t) = (1 −W) · win(t) −W · loss(t). (1)
The win(t) and loss(t) are the money won and lost on trial t. W is the attention to loss parameter which varies between 0 and 1. By measuring W, individual’s attitude
18
toward risk can be separated. Participant with higher W is more loss-aversion than lower W. The weighted utility function used here implies that participants count win and loss separately.
Delta learning function. The learning rule used in EV model is delta-learning rule,
which is as follows:
Ej(t) = Ej(t − 1) + A · δj(t) · [u(t) − Ej(t − 1)]. (2)
The term δ is the choice of deck j on trial t, which is 1 if deck j is chosen and 0 otherwise. The parameter A is the learning rate, which dictates how much the expectancy of a selected deck j on trial t is modified by the prediction error, [u(t) −
Ej(t − 1)]. The Equation 2 can be reformed as follows:
Ej(t) = (1 − A · δj(t))Ej (t − 1) + A · δj(t) · Ej(t). (3)
With Equation 3, the parameter A can be interpreted as attention weight between past expectancy and immediate outcome. The higher A is representing more attention to immediate outcome and regarding past experience.
Trial-dependent ratio choice rule. The choice rule is ratio choice rule with
trial-dependent sensitivity. The D(t + 1) is the choice on next trial t +1, and the probability the deck j is determined by the following rule:
∑
= − − = = + 4 1 k ) ( ) ( ) ( ) ( ] ) 1 ( Pr[ t E t t E t j j e e j t D θ θ (4) The parameter θ(t) is the sensitivity of the choice probabilities to the expectancies. When θ(t) is approaching zero, choices become completely random. When θ(t) is high, the determination between each choice becomes clear and resembles maximization rule. With more and more experience, subjects may have more confidence, and the θ(t) may increase or decrease accordingly. The dynamic process is expressed by the power function:θ(t) = (t/10)c. (5) The parameter c indicates the change of consistency. If the c is a positive value, the sensitivity is increasing over time. If the c is a negative value, the sensitivity is lower over time, and the choice is more randomly.
Prospect valence learning model
Besides EV-model, another model selected here is proposed by Ahn and Busemeyer, Wagenmakers, and Stout (2008). Like EV-model, the model (Prospect
19
valence learningmodel, PVL model) they proposed is based on the same three-step processes, but the functions used in these steps are different. The weighted utility function is replaced with prospect utility function, and the delta learning rule is changed to decay-reinforcement learning rule. Finally, a trial-independent choice rule is applied for making choice.
Prospect utility function. The utility function used in PVL model is the prospect
utility.
The net payoff is then transfered by a nonlinear power function. α is a parameter representing the marginal sensitivity that governs the shape of the utility function. λ is the loss-aversion parameter. Unlike the weighted utility function in EV-model,
prospect utility assumes that the outcome is evaluated by its net payoff instead of the weighed combination.
Decay-reinforcement rule. The equation of the decay-reinforcement rule for the
expectancy about deck j on trial t is:
Ej(t) = A · Ej(t − 1) + δj(t) · u(t). (7)
The A is the recency parameter which is the decay rate of past expectancy. The past expectancy discounted toward zero regarding chosen or not. Although both learning rule in EV model and PVL model contain the free parameter A, the meaning behind the functions are differ. Only the chosen deck’s expectancy is changed in EV model, and the expectancy in all decks are changed in PVL model. Also, A in EV model is referred to learning rate or attention to immediate outcome, and which in PVL model is referred to decay rate of past expectency.
Trial-independent ratio choice rule. The choice rule in PVL model is also related
to choice rule except with trial-independent sensitivity. The equation of ratio choice rule is the same as Equation 4, but θ(t) function is changed as follow:
θ(t) = 3c − 1. (8)
When sensitivity parameter c gets close to zero, the choice is more random. On the other hand, when c gets larger, the decision is more deterministic. Unlike the sensitivity in trial-dependent choice rule, which increases or decreases with more trials, sensitivity in trial-independent choice rule is consistent within the whole task.
20
The summarize of model parameters are showed in Table 4. The EV model seems capture more the original idea behind IGT than PVL model. The conflict between immediate gain and loss can be described through parameter W (attention to win or loss) and A (attention to current or past payoff). Thus the participant must put their attention to loss and past expectancy for winning in the IGT involved conflict (IGT-Ori, IGT-A, and IGT-V). For the IGT without conflict (IGT-T), participant can put their attention to immediate gain, thus result in smaller W or A.
Yechiam, Busemeyer, Stout, and Bechara (2005) used three parameters in the EV model to distinguish 10 clinical populations (e.g. alcohol abuser, VMPFC lesion patients, cannabis abuser, etc.). Their findings, consistent with empirical observations, showed that individuals in different population give different weightings to the three parameters. For example, VMPFC patients overweight the value of recent outcome, whereas patients with Asperger’s syndrome show hypo-weightings to gain.
The PVL model, on the other hand, does not match the idea behind IGT so well. The influence of different IGT design cannot be predicted before being tested. It is
21
found that PVL model outperforms EV model either on overall goodness of fit or further prediction with normal participants’ performance (Ahn, Busemeyer, Wagenmakers, & Stout, 2008).
In the study, the overall goodness of fit of EV model and PVL model was first compared with participants’ performance on four IGT. Then the parameters estimated from these two models were further compared.
Method
Data used here were collected from Yen’s lab (e.g. Yen et al., 2008; Yen et al., 2009). Each IGT consists of 100 trials, and each deck only contains 40 cards. Each participant only tested by one IGT. The number of participants in each IGT are shown in Table 5. Trial-by-trial data of 5 participants were lost because of a technical problem with recording error. Also, two
subjects’ data in IGT-T are excluded because of bad performance (G2 is lower than −70). The effective number of participants in each IGT are shown in Table 6.
22
Model evaluation
The model is evaluated by one-step-ahead prediction method. This method
examines the accuracy of a model in predicting an individual’s choice on the next trial based on an individual’s actual sequence of choice and consequent payoffs up to and including the current trial. The accuracy of model predictions is measured by log likelihood criterion for each individual:
∑∑
− − − + ⋅ + = 1 1 1 4 ) 1 ( )]) 1 ( ln(Pr[ t n j j j t t D LL δ . (9)The parameter n is the number of trial and δj(t + 1) is the dummy variable used in Equation 2 and 7. The LL is higher, the more accurate the model is. Because of the 40-card limit in each deck, if a deck is running out of cards, the probability of choice is set to zero and rationally diverged to other decks during LL calculation. In order to compare with different models, a baseline model is needed. The baseline model selected here is astatistical Bernoulli process. The G2 of both model then computed through Equation 10.
G2 = 2· [LL|model − LL|baseline]. (10)
There are three parameter in EV model, and four in PVL model. The model with more parameters should suffer a discount for performance. Thus Bayesian information
criterion (BIC) score is conducted for representing the goodness of fit of model:
BIC = G2 − k · ln(N). (11)
23
The N is the number of trial and is consistently 100 in four IGT. k is the difference of the number in parameters. For PVL model, the penalty of BIC is 1 · ln(100).
Both model parameters are estimated by fmincon function in Matlab which conducted semi-newton method with planed grid for initial search point. For EV model, three free parameters W, A, and c are between 0 and 1, 0 and 1, and −5 and 5, respectively. For PVL model, free parameters α and A are between 0 and 1. The λ is settled between 0 and 10. Consistency parameter c is between 0 and 5.
Results
The BIC of the EV model and PVL model in four IGT are shown in Table 7. The estimated parameters are shown in Table 8. For comparing the goodness of fit of two models, a mix-design two factor ANOVA is conducted. A significant main effect is found between EV and PVL models (F(1, 131) = 5.03, p < .05). Also, a significant main effect among experiments is found (F(3, 131) = 4.18, p < .01). Generally, PVL model is fitted better than EV model even with the parameter discount.
In order to calculate how experimental manipulation influence the model parameter, one-way ANOVA is conducted for each model parameter. For three parameters in EV model, there are no significant difference among different experiments. For PVL model, there are significant difference in parameter α and c (F(3, 131) = 8.67, p < .001; F(3, 131) = 4.907, p < .005, respectively). Post-hoc tests are then conducted for α and c with Turky HSD. For parameter α, the estimated value in IGT-Ori (M = 0.56) and IGT-V (M = 0.51) are significant larger than IGT-A (M = 0.16, p < .001;p < .001). Also, a significant difference between IGT-A (M = 0.33) and IGT-V (M = 0.08) of c is found (p < .001). The parameter c in IGT-A is larger than IGT-V. Overall speaking, only PVL model can reflect the different experiment manipulation in different IGT.
As showed in Table 8, the estimated A in EV model in all decks are close to zero, which indicate a low learning rate. This unreasonable low learning rate may due to the scaling problem. Because all the experiments are tested in Taiwan, the payoff is TWD instead of USD. The expectancy is treated as exponent in ratio choice function. Thus the scaling here will cause a problem, and mostly it will influence on learning rate parameter.
As showed in Table 7, the estimated α in IGT-A is close to zero. Thus a PVL model with α fixed to zero is applied for IGT-A. As a matter of fact, the goodness of
24
fitting parameter G2 of restricted PVL model is 27.36 which is slightly lower than full model (G2 = 28.47). This result suggests that by just counting the positive or negative outcome frequency is enough for IGT-A task.
Discussion
In this study, we applied two decision making models among four similar experimental designs with different manipulation. By applying cognitive model as indirect measurement, the different underlie decision making processes are measured. Both model shows different aspect of decision processes. PVL model fit better than EV-model, and both are outperform baseline model. This is consist with previous finding, and it also indicate that both model are capture some underlie decision making processes.
With modified EV-model, the parameter W in IGT-T is lower than other IGT. Unlike other IGT, IGT-T does not involved conflict between immediate gain or delayed loss. Participants could put more attention to gain or learning quicker than other IGT. According to EV-model, the modeling results indicate that participants put most of their attention to gain. The learning rate in IGT-T is not differ with other IGT. In IGT-A, the marginal sensitivity parameter α is close to zero. This suggests that the participants in IGT-A make judgment by the frequency of net positive or negative outcome of each deck. This is reasonable because the payoff of each deck in IGT-A are varied from positive to negative. With the complicated and conflict information, participants may just simplify the outcome from exact value to frequency of positive or negative events.
25
In IGT-V, the estimated consistency parameter c is lower than other IGT. This is reasonable when considering the variation of delayed payoff. With variation
increasing, it is harder to consistently apply decision rule, which makes the consistency parameter c lower. However, like EV-model, PVL model is also influenced by scaling problem. Only the consistency parameter c is differ among scaling, and other parameters are remain uninfluenced. It is hard to tell which
psychological meaning behind the parameter c in PVL model.(Cheng & Sheu, 2009) Among four IGT, IGT-V is the most well controlled one. But both model
perform only slightly better than baseline model. This finding may due to the way that both model considering risk. In IGT-V, the level of risk is manipulated through the covariance of losses. However, covariance is not considered by both model. Another model which is considering covariance may fit this experiment better.
In this study, the cognitive models are threatened as indirect measurement for measuring the influence of manipulation. From other prospect, he experiment design could focus on other parameter in cognitive model in future research. For example, previous studies indicated that working memory capacity do influence the response of IGT task (Hinson, Jameson, & Whitney, 2002; Dretsch & Tipples, 2008). The
working memory decaying rate may be a factor to influence the decay rate parameter
A.
V
.Study Five.
The rapid evaluation of response outcomes and the anticipation of future events are important for enabling humans to guide subsequent choices to avoid other negative events. However, detailed descriptions of the mechanisms that underlie the establishment of such behaviors remain elusory, due in part to the spatial and temporal limitations of available research techniques. We investigated this issue by recording event-related potential (ERP) while participants performed the Iowa Gambling Task, and we concurrently measured behavioral responses. Recent event-related potential studies have reported neurophysiological activity that is involved in rapidly evaluating the motivational significance of ongoing evets.
26
characteristics that are consistent with its involvement in rapidly evaluating the motivational impact of events and in guiding choice behavior. The activity responds to the monetary outcome mattered by an event, operates on a short time scale, and covaries with the riskiness of people’s choices in a gambling task.
We found the feedback-related negativity (FRN) component of event-related potentials that reflected the mismatch between expected outcomes and actual outcomes in the task. This component was most pronounced following monetary losses as opposed to monetary gains ( Nieuwenhuis, Yeung, Holroyd, Schurger & Cohen, 2004)
Participants
Fifteen undergraduate students from National Chengchi University were recruited with the same constraints as that in Study Five.
Task and Experimental Design
To investigate evaluative neural activity, we recorded event-related brain potentials (ERPs) from human participants as they performed the IGT task. Neither the gain/loss contigencies of the cards nor the total number of trails was known to the participant. The gain was produced immediately at the time while the participant chose a card; whereas the delayed feedback (either monetary loss or “wait” sign) was produced 1.5 sec after the choice (see Figure 14).
27
Procedure Physiological Recording, Data Analysis
The electroencephalogram (EEG) was recorded from 64 scalp sites using tin
28
electrodes mounted in an elastic cap (NeuroScan Inc., Herndon, Virginia, USA) according to the International 10/20 System. Eye blinks were recorded from left supraorbital and infraorbital electrodes. The horizontal electro-oculogram (EOG) was recorded from electrodes placed 1.5cm lateral to the left and right external canthus. All electrode recordings were referenced to the average of the electrodes which are placed on left and right mastoid. The electrode impedances were kept below 5 kΩ. The EEG and EOG were amplified using a 0.01–30 Hz band-pass and continuously sampled at 500 Hz/channel for offline analysis. All trials in which EEG voltages exceeded a threshold of ±60mV during the recording epoch were excluded from analysis. The data were baseline corrected by subtracting from each sample the average activity of that channel during the baseline period.
Separate EEG epochs of 1200ms (with 200-ms pre-stimulus baseline) were extracted offline, for each feedback stimulus, for each trial on each electrode. The FRN was defined as the difference between the maximum value within 160 and 240 ms following feedback onset and the most negative point within 240 and 325 ms following loss feedback onset. The component amplitudes were calculated across three electrode locations (Fz, Cz, Pz) in the midline, and the data were entered into analyses of variance (ANOVAs), with relative risk level (high risk: B、D decks,low risk: A、C decks)and electrode channel(Fz, Cz and Pz) as four within-participant factors.
Results and discussion
Behavioral Data
The analysis and results for behavioral IGT performance measure were the same as those used in study one. A 2(deck type: good vs. bad) × 5 (block) ANOVA on the number of cards selected revealed significant interactions between decks and blocks ( F(4,56)= 9.028, p <.001). Thus, our data showed that participants gradually shift their preference toward the good decks (C/D) and away from the bad decks (A/B).
29 ERP Data
A 2(risk level: high vs. low) × 3 (channel: Fz vs.Cz vs. Pz) ANOVA yielded significant main effects for the factor Risk for FRN (F(1,10)=15.642; p<0.01), Channel for FRN (F(2,20)=16.659; p<0.01). Thus, our data showed that participants, after loss feedback, had more greater FRN in high risk decks (M=8.63) than in low risk decks(M=5.257). Moreover, participants, after loss feedback, had more greater FRN in Fz(M=11.862) than Cz (M=4.404)and PZ (M=4.566).
Conclusion
In the first year, we successfully replicated the original IGT task in Study One and the expectancy-valence model can fit the data well. In the original IGT task,
0 5 10 15 20 1 2 3 4 5 Total number of card selection from decks Figure 15. Total number of cards selected from advantageous vs. the disadvantageous decks … Bad deck(A&B) ‐13 ‐8 ‐3 2 7 12 ‐200 ‐100 0 100 200 300 400 500 μ V Time Loss_AC_Fz Loss_BD_Fz *
30
anticipatory SCRs were interpreted as correlates of somatic that bias individuals’ decision making. That is, the anticipatory SCRs served as alarms to keep participants away from bad cards. However, by changing the schedule of punishments and
rewards in Study Two, the SCRs were associated with high risky and bad decks; participants still choose more risky and bad decks. Thus, the SMH is not supported.
In the second year, we explored whether the anticipatory SCR reflects the risky decision in depth regarding the physiological response. In Study Three, our data showed that anticipatory SCR may reflect both risky and incorrect decision. Furthermore, cognitive modeling was applied to estimate components of the Study I~III. The EV model and PVL model for four experimental tasks were selected for comparison; PVL model fit better than EV-model, and both are outperform baseline model. To investigate evaluative neural activity, we recorded event-related brain potentials (ERPs) in Study Five. We found the feedback-related negativity (FRN) component of event-related potentials that reflected the mismatch between expected outcomes and actual outcomes in the task. This component was most pronounced following the high risk of monetary losses as opposed to the low risk of monetary loss .
Reference
Ahn, W. Y., Busemeyer, J. R., Wagenmakers, E. J., & Stout, J. C. (2008). Comparison of decision learning models using the generalization criterion method. Cognitive
Science, 32(8), 1376-1402.
Amiez, C., Procyk, E., Honore, J., Sequeira, H., & Joseph, J.-P. (2003). Reward anticipation, cognition, and electrodermal activity in the conditioned monkey.
Experimental Brain Research, 149, 267–275.
Bechara, A., & Damasio, H. (2002). Decision-making and addition (part I): Impaired activation of somatic marker states in substance dependent individuals when pondering decisions with negative future consequences. Neuropsychologia, 40, 1675-1689.
Bechara, A., Damasio, H., & Damasio, A. R. (2000a). Emotion, decision making, and the orbitofrontal cortex. Cerebral Cortex, 10(3), 295-307.
Bechara, A., Damasio, A. R., Damasio, H., & Anderson, S. W. (1994). Insensitivity to future consequences following damage to human prefrontal cortex. Cognition, 50, 7-15.
31
Bechara, A., Damasio, H., Damasio, A. R., & Lee, G. P. (1999). Different contributions of the human amygdala and ventromedial prefrontal cortex to decision-making. The Journal of Neuroscience, 19(13), 5473-5481.
Bechara, A., Damasio, H., Tranel, D., & Damasio, A. R. (1997a). Deciding advantageously before knowing the advantageous strategy. Science, 275, 1293-1295.
Bechara, A., Tranel, D., & Damasio, H. (2000b). Characterization of the decision making deficit of patients with ventromedial prefrontal cortex lesions. Brain, 123, 2189-2202.
Bowman, C. H., & Turnbull, O. H. (2003). Real versus facsimile reinforcers on the Iowa Gambling Task. Brain and Cognition, 53(2), 207-210.
Busemeyer, J. R., & Stout, J. C. (2002). A contribution of cognitive decision models to clinical assessment: Decomposing performance on the Bechara gambling task.
Psychological Assessment, 14(3), 253-262.
Carter, S., & Smith-Pasqualini, M. C. (2004). Stronger autonomic response accompanies better learning: A test of Damasio’s somatic marker hypothesis.
Cognition and Emotion, 18(7), 901–911.
Cavedini, P., Bassi, T., Zorzi, C., & Bellodi, L. (2004). The advantages of choosing antiobsessive therapy according to decision-making functioning. Journal of
Clinical Psychopharmacology 24 (6), 628–631.
Cheng, C. P., & Sheu, C. F. (2009, September). Measurement scales and cognitive
modeling. Oral present in Taiwanese Psychology Association 48th Annual
Conference, Taipei, Taiwan.
Crone, E. A., & van der Molen, M. W. (2004). Developmental changes in real life decision making: Performance on a gambling task previously shown to depend on the ventromedial prefrontal cortex. Developmental Neuropsychology, 25(3), 251–279.
Cuthbert, B. N., Schupp, H. T., Bradley, M. M., Birbaumer, N., & Lang, P. J. (2000). Brain potentials in affective picture processing: Covariation with autonomic arousal and affective report. Biological Psychology, 52, 95-111.
Damasio, A. R. (1994). Descartes’ Error: Emotion, reasoning, and human brain. New York: Grosset/Putnam.
Dretsch, M. N., & Tipples, J. (2008). Working memory involved in predicting future outcomes based on past experiences. Brain and Cognition, 66 (1), 83-90. Dunn, B. D., Dalgleish, T., & Lawrence, A. D. (2006). The somatic marker
hypothesis: A critical evaluation. Neuroscience & Biobehavioral Reviews, 30(2), 239-271.
32
and Cognition, 55, 158–170.
Gonzalez, R., Vassileva, J., Bechara, A., Grbesic, S., Sworowski, L., & Novak, R. M. (2005). The influence of executive functions, sensation seeking, and HIV
serostatus on the risky sexual practices of substancedependent individuals.
Journal of the International Neuropsychological Society, 11, 121–131.
Hinson, J. M., Jameson, T. L., & Whitney, P. (2002). Somatic markers, working memory, and decision making. Cognitive, Affective, & Behavioral Neuroscience,
2, 341-353.
Kerr, A., & Zelazo, P. D. (2004). Development of ‘hot’ executive function: The children’s gambling task. Brain and Cognition, 55(1), 148–157.
Knyazev, G. G., & Slobodskaya, H. R. (2003). Personality trait of behavioral inhibition is associated with oscillatory systems reciprocal relationships.
International Journal of Psychophysiology, 48(3), 247-261
Lang, P. J., Greenwald, M. K., Bradley, M. M., & Hamm, A. O. (1993). Looking at pictures: Affective, facial, visceral, and behavioral responses. Psychophysiology,
30, 261-273.
Maia, T. V., & McClelland, J. L. (2004). A reexamination of the evidence for somatic marker hypothesis: What participants really know in the Iowa gambling task. The
National Academy of Science of the U. S. A., 101, 16075-16080.
Nieuwenhuis, S., Yeung, N., Holroyd, C. B., Schurger, A., & Cohen, J. D. (2004). Sensitivity of electrophysiological activity from medial frontal cortex to utilitarian and performance feedback. Cerebral Cortex 14(7), 741-747.
Oldfield, R. C. (1971). The assessment and analysis of handedness: The Edinburgh Inventory. Neuropsychologia, 9, 97–113.
Overman, W. H. (2004). Sex differences in early childhood, adolescence, and adulthood on cognitive tasks that rely on orbital prefrontal cortex. Brain and
Cognition, 55(1), 134–147.
Overman, W. H., Frassrand, K., Ansel, S., Trawalter, S., Bies, B., & Redmond, A. (2004). Performance on the Iowa card task by adolescents and adults.
Neuropsychologia, 42(13), 1838–1851.
Reavis, R., & Overman, W. H. (2001). Adult sex differences on a decision-making task previously shown to depend on the orbital prefrontal cortex. Behavioral
Neuroscience, 115(1), 196-206.
Rolls, E. T. (1999). The Brain and Emotion. Oxford: Oxford University Press.
Schmitt, W. A., Brinkley, C. A., & Newman, J. P. (1999). Testing Damasio’s somatic marker hypothesis with psychopathic individuals: Risk takers or risk averse?
Journal of Abnormal Psychology, 108(3), 538-543.
33
somatic marker hypothesis to individual differences in decision making.
Biological Psychology, 65, 81-88.
Tomb, I., Hauser, M., Deldin, P., & Caramazza, A. (2002). Do somatic markers mediate decisions on the gambling task? Nature Neuroscience, 5(11), 1103-1104 Yechiam, E., & Busemeyer, J. R. (2005). Comparison of basic assumptions embedded
in learning models for experience-based decision making. Psychonomic Bulletin
& Review, 12(3), 387-402.
Yechiam, E., Busemeyer, J. R., Stout, J., & Bechara, A. (2005). Using cognitive models to map relations between neuropsychological disorders and human decision making deficits. Psychological Science, 16 (12), 973-978.
Zuckerman, M., & Kuhlman, D. M. (2000). Personality and risk-taking: Common biosocial factors. Journal of Personality, 68(6), 999-1029.
出席國際學術會議心得報告 計畫編號 NSC 96- 2413 - H – 004 – 008 –MY2 計畫名稱 多角度驗證軀體標記假說之建構、生理反應關連性以及神經處理機制(1/2) 出國人員姓名 服務機關及職稱 顏乃欣 政治大學心理學系教授 會議時間地點 98 年 3 月 21 日至 98 年 3 月 24 日 於美國舊金山 會議名稱 認知神經科學學會 2009 年年會
(Cognitive Neuroscience Society's 2008 Annual Meeting)
發表論文題目
Effects of regulation on positive and negative emotions: a study of electrophysiological responses
The effects of expected value and risk level on Behavioral and electrophysiological responses in a modified IGT
一、參加會議經過
認知神經科學學會(Cognitive Neuroscience Society,CNS)自1994 年成立至今,致力於 推廣以心理學、認知神經科學的角度拓展心智與大腦的研究範疇,已成為全美認知神經科學 領域之重要學術組織,每年所舉辦的年會都會吸引許多從事神經科學研究的人員參加,並且 為各國學者互相交流討論彼此意見的良好契機。今年(2009 年年會)3/21-3/24 假舊金山凱 悅飯店舉行店舉行,範疇涵蓋認知的心理、社會行為、及神經基礎,而本實驗室今年也有幸 有兩篇主題海報的發表,其中有一篇更是屬於本研究計劃軀體標記假說的相關內容:
Yen, N. S.*, Kao, C. H., Chou, I. C., & Chung, H. K. (2009, Mar.). The effects of expected
value and risk level on behavioral and electrophysiological data in a modified IGT.
Chen, C. Y., Yen, N. S.*, Lin, H. Y. (2009, Mar.). Effects of regulation on positive and
negative emotions: A study of electrophysiological responses.
二、與會心得
CNS會議議程除壁報論文展出與討論外,亦有九場主題座談會,題材多元豐富且多為各 領域最當紅主題,此次總共有七個議題,分別為Language、Working memory and executive functions、Long-term memory、Emotion,Attention、Perception,Reasoning and decision making, 每個主題底下有不同的主講者報告其相關子主題,總演講時間為兩小時。此外,也會頒發年 度優秀年輕學者獎,並且邀請獲獎者進行演講,而此次獲獎者Lila Davachi與Clayton Curtis為 紐約大學的學者,在Cognitive Neuroscience recognizes的研究有很傑出的表現,其研究發表皆 可作為本研究計劃可探討的研究方向。
此次CNS許多演講議題皆和本研究相關,如預期的效果、神經生理證據在感覺、同理心 及風險的發現,以及社會認知和情緒等。這些演講中提及了酬賞的影響以及風險的選擇以及 在神經生理上的證據顯示和Insula、frontal lobe和Amygdala等腦區相關。並且這次演講中提及
從古典制約到神經生理的證據都顯示恐懼對人類的重要性,因此「恐懼」又成為目前研究的 熱門議題。而且參與此次會議更可以發現,過去從認知心理學結合神經科學而發展的認知神 經科學,目前越來越多人從事探討情緒等更多和社會認知、社會心理學相關的研究,意味著 「社會認知神經科學」逐漸成為目前研究的趨勢。 壁報論文討論部分亦成果豐碩。我以本校「心智、大腦與學習」研究中心的各種儀器進 行之認知神經科學研究,亦有論文兩篇獲大會接受發表,其中有一篇更是屬於本研究計劃軀 體標記假說的相關內容。由於此類題材係屬目前認知神經科學之研究主流,參與者多於此領 域中有豐富研究經驗,除吸引踴躍參與及討論外,亦獲得許多極具建設性的建議與回饋,以 供後續研究參考與調整之用。尤其現今驅體標記假說及相關的愛荷華作業是相當熱門的研究 趨勢,許多學者皆表示熟悉軀體標記假說或者本身研究也有利用到愛荷華作業等等,我們更 遇到了發表軀體標記假說團隊中,Damasio與Bechara實驗室的學生,也互相交流了許多寶貴 的經驗。