A Fair Scheduling Mechanism for the IEEE 802.11e Wireless LAN
5
0
0
全文
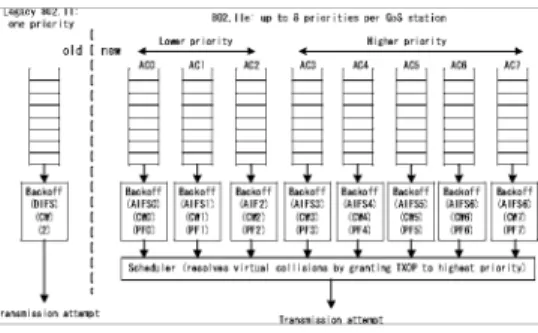
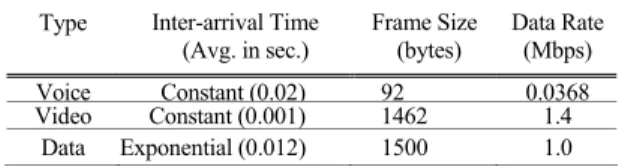
(2) TABLE I PRIORITY TO ACCESS CATEGORY MAPPING Priority. Access Category (AC). Designation (Information). 1. 0. Best Effort. 2. 0. Best Effort. 0. 0. Best Effort. 3. 1. Video Probe. 4. 2. Video. 5. 2. Video. 6. 3. Video. 7. 3. Video. and adjustable. Data in a queue is allowed to be continuously transmitted and the amount transmitted can be a bit more than the allowance after getting the media. The extra amount of data more than the allowance is then called excess. Let Ei(t′), Ai(t′), and Fi(t′) represent the excess, allowance, and the total amount of data sent, respectively at time t′ for queue i. Then, they have the following relation: Ei (t ′) = Fi (t ′) − Ai (t ′). (1) After a frame is successfully transmitted, the next frame in the queue can be successively transmitted. The process continues until the total length of transmitted frames is more than the allowance. In other words, the acquired services of a queue can exceed its origin allotment. Moreover, the allowance is not constant and its value can be determined according to two intervals of frame transmission. Let each queue have an individual value of Ti (its reciprocal is related to weight [9] (Note that we need to set higher weights according to the order: voice, video, and data in EEDCF) and the ratio of Ei (t′) and Ti, i.e., Ei(t′) ⁄ Ti, directly proportion to the desired throughput. At time t (t > t′), the allowance is calculated as follows:. Ai (t ) =. Ei (t ′) (t − t ′) − Ei (t ′). Ti. (2). In (2), allowance is increased proportionally to the desired throughput with deduction of the excess amount. Note that a larger waiting time causes a larger allowance. Hence, no starvation exists for EEDCF. Moreover, deducting excess from the accumulated allowance achieves better resource sharing. We now relate the allowance to the backoff interval using the following relations. First, we calculate the backoff interval mainly based on allowance by. BI i (t ) = max i CW [i ] − ϕAi (t ),. (3). where φ is a constant used to make the interval BIi(t) fall within the specification of EDCF (also see Fig. 2). The above relation says that a larger allowance may result in a shorter backoff interval. To further consider the collision situation, let us define collision rate ki for queue i, which is the ratio of the number of collided packets sent by queue i and the number of packets sent by queue i. Periodically calculating ki and using BIi(t) obtained by (3), the desired backoff interval is got as follows:. BI i (t ) ⇐ max(0.2, 1 − ki ) BI i (t ). (4). Fig. 2. The IFS relationship of EDCF.. TABLE II TRAFFIC TYPES AND THE CORRESPONDING CHARACTERISTICS Type Voice Video Data. Inter-arrival Time (Avg. in sec.) Constant (0.02) Constant (0.001) Exponential (0.012). Frame Size (bytes) 92 1462 1500. Data Rate (Mbps) 0.0368 1.4 1.0. in which the term max(0.2, 1–ki) tries to make the backoff interval a bit shorter (but not very short, e.g., 0) when the collision rate gets high. By doing so, collisions can be alleviated quickly.. 2.2: Backoff Interval Adjustment after a Collision The backoff interval is set according to (5) when a collision occurs. BI new [ j ] = BI old [ j ]rand ( PF [ j − 1], PF [ j ]), (5) where index j represents the priority class and P F standards for the persistence factor. Using a random value between the current priority class and the former priority class is to disperse the P F value to avoid consecutive collisions for the same priority class. Thus, the proposed EEDCF takes advantages of ERR to avoid starvation for the low priority queue with consideration of system status. EEDCF will reduce collision and improve throughput and delay etc. Moreover, better fairness is achieved.. 3: NUMERICAL EXAMPLES AND DISCUSSIONS 3.1: Simulation Arrangements The simulation is done under an ad-hoc mode with transmission rate of 11 Mbps. Three different data types, including voice, video, and data are considered (we assume video and voice are generated according to constant bit rate (CBR) traffic). In Table II, traffic types with corresponding characteristics are listed. Since video and voice are delay-sensitive but data is loss-sensitive, buffer sizes for video and voice are fixed at 20 kbits and 1 Mbits, respectively. For data, an infinite buffer is assumed. In Table III, general parameters for various types of traffic, including, priority and AC in the following simulation are given if no re-definition is claimed. Without loss of generality, each station only has one traffic type. In EDCF, no concept of weight is defined. But in EEDCF, we. - 497 -.
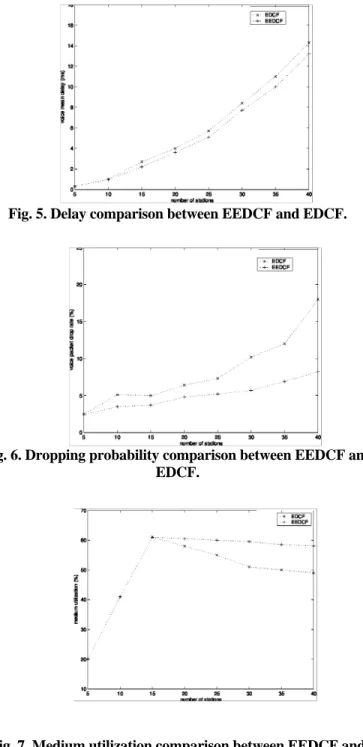
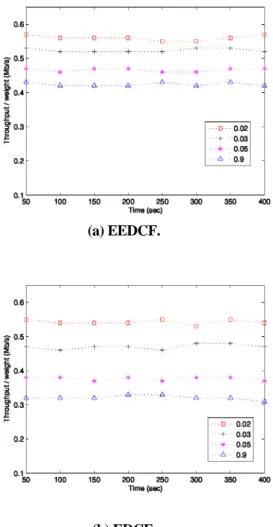
(3) use the relation Ti = 10-4/wi (sec.) to define weight wi for data EECDCF exhibits excellent fairness as compared to EDCF. stream i (or queue i). For the comparison purpose, EDCF also uses the same definition of weight. 4: CONCLUSIONS A fair scheduling mechanism for IEEE 802.11e, i.e., EEDCF, is proposed and studied in this paper. EEDCF adopts advantages of ERR to enhance fairness and considers different QoS requirements as well as network status, i.e., collision rate, to improve system performance. Through simulations, we show that the improvement in performance and improvement in fairness for EEDCF are about 6%–11% and more than 60%, respectively. Obviously, the above results illustrate that EEDCF outperforms EDCF in terms of transmission efficiency and fairness.. TABLE III GENERAL TRAFFIC PARAMETERS FOR SIMULATIONS Type Voice Video Data. Priority 7 5 0. AC 3 2 0. PF AIFS 2 4 6. PIFS PIFS DIFS. CWmin 7 15 31. CWmax 15 31 1023. 3.2: Performance Metrics. TABLE IV To gauge the performance of different mechanisms, the following PARAMETERS FOR OBTAINING RATIONS OF metrics are used: 1) throughput, 2) delay, 3) dropping probability, 4) THROUGHPUT AND WEIGHTFOR EEDCF AND EDCF utilization (which is defined as TotalTxTim e − CollisionT ime − IdleTime , 5) collision rate, and 6) × 100% TotalTxTim e. Weight. standard deviation for rations of throughput and weight which can reflect fairness using the reciprocal of the standard deviation.. 0.9 0.05 0.03 0.02. Priority AIFS 7 4 1 0. 3.3: Simulation Results First, 4 voice stations, 2 video stations, and 4 data stations are assumed. Shown in Fig. 3 is the throughput vs. time. Compared to EDCF, 8% improvement for video and voice and about 6% improvement for data stations are obtained when EEDCF is employed. As for delay vs. time shown in Fig. 4, about 7% and 8% lower than EDCF are gained by EEDCF when transmitting voice and video, respectively. Since data employs an infinite buffer, the delay may go very high and is omitted in this figure. Next, let us observe the impact when the traffic load gets high. Initially, we set 2 voice stations, 1 video stations, and 2 data stations (a total of 5 stations). Afterwards, the number of stations is proportionally increased. Hence, we observe the results ranging from 5 stations to 40 stations. As the number of stations increases, delay shown in Fig. 5 also increases for both EDCF and EEDCF. However, EEDCF increases more smoothly than EDCF when the number of stations increases. Fixing the number of stations at 40, EEDCF gets about 10% improvement. As for the packet dropping probability shown in Fig. 6, EEDCF gets 11% lower than EDCF when the number of stations is 40. In Fig. 7, utilizations for both EEDCF and EDCF increase when the number of stations increases. When the number of stations reaches 15, saturation phenomenon is observed because of collisions. When the number of stations further increases, the utilization can be maintained for EEDCF, while it decreases for EDCF. In Fig. 8, collision rates are shown. Of course, more stations cause a higher collision rate. Again, the increasing trend for EEDCF is smoother than that of EDCF. When the number of stations is 40, 7% improvement is obtained by EEDCF. Considering four different classes of traffic shown in Table IV, Figs. 9(a) – (b) exhibit ratios of different classes for EEDCF and EDCF, respectively. Using the reciprocal of the standard deviation to stand for the degree of fairness [9], we show that about 62% improvement is gained by EEDCF as compared to EDCF. This demonstrates that. PIFS PIFS DIFS DIFS. CWmin. CWmax. Rate. Frame Size. 2 −1 24−1 25−1 25−1. 2 −1 25−1 210−1 210−1. 8 kbps 128 kbps 120 kbps 96 kbps. 160 Bytes 1280 Bytes 1500 Bytes 1500 Bytes. 4. 3. ACKNOWLEDGEMENT The first author thanks the partial support in finance by the National Science Council, Taiwan under Contract NSC 95-2221-E-011-029.. REFERENCES [1] [2]. [3]. [4]. [5]. [6]. [7]. [8]. [9]. - 498 -. I. Aad and C. Castelluccia, “Differentiation mechanisms for IEEE 802.11,” in Proc. IEEE INFOCOM ’01, pp. 209–218, April 2001. A. Almquist, A. Lindgren, and O. Schelen, “Evaluation of quality of service schemes for IEEE 802.11 Wireless LANs,” in Proc. LCN ’01, pp. 348–351, 2001. O. Altinatas, Y. Atsumi, and T. Yoshida, “A packet scheduling discipline for supporting real-time applications,” in Proc. IEEE PACRIM ’97, pp. 895–899, Aug. 1997. A. Banchs and X. Perez, “Distributed weighted fair queuing in 802.11 wireless LAN,” in Proc. IEEE ICC ’02, pp. 3121–3127, May, 2002. J. C. R. Bennett and H. Zhang, “WF2Q: Worst-case fair weighted fair queueing,” in Proc. IEEE INFOCOM ’96, pp. 120–128, Jun. 1996. K. C. Chen, “Medium access control of wireless LANs for mobile computing,” IEEE Network, vol. 8, no. 5, pp. 50–63, September 1994. A. Demers, S. Keshav, and S. Shenkar, “Analysis and simulation of a fair queueing algorithm,” in Proc. ACM SIGCOMM ’89, pp. 1–12, Sep. 1989. J. Deng and R. S. Chang, “A priority scheme for IEEE 802.11 DCF access method,” IEICE Trans. on Communications, vol. 82-B, no. 1, pp. 96–102, January 1999. H. W. Ferng, C. F. Lee, J. J. Huang, and G. M. Chiu, “Designing a fair scheduling mechanism for IEEE 802.11 wireless LANs,” IEEE Commun. Lett., vol. 9, no. 4, pp. 301-303, April 2005..
(4) [10] [11]. [12]. [13]. [14]. [15]. [16]. [17]. [18]. IEEE WG, “802.11e draft 3.1,” May 2002. S. S. Kanhere, H. Sethu, and A. B. Parekh, “Fair and efficient packet scheduling using elastic round robin,” IEEE Trans. Parallel and Distributed Systems, vol. 13, no. 3, pp. 324–336, March 2002. M. Katevenis, S. Sidiropoulos, and C. Courcoubetis, “Weighted round robin cell multiplexing in a general-purpose ATM switch chip,” IEEE JSAC, vol.9, no. 8, pp. 1265–1279, Oct. 1991. T. G. Kwon, S. H. Lee, and J. K. Rho, “Scheduling algorithm for real time burst traffic using dynamic Weighted round robin,” in Proc. IEEE ISCAS ’98, pp. 506–509, Jun. 1998. K. Liu, D. Petr, V. Forst, H. Zhu, C. Braun, and W. Edward, “Design and nalysis of a band-width management of framework of ATM-based boadband ISDN,” IEEE Comm. Magazine, pp. 138–145, May 1997. S. Mangold, “IEEE 802.11e - Coexistence of overlapping basic service sets,” in Proc. of the Mobile Venue ’02, pp. 131–135, May 2002. N. Matsufuru and R. Aibara, “Efficient fair queueing for ATM networks using uniform round robin,” in Proc. IEEE INFOCOM ’99, pp. 389–397, Mar. 1999. W. Pattara-Atikom, S. Banerjee, and P. Krishnamurthy, “Starvation prevention and quality of service in wireless LANs,” in Proc. IEEE Wireless Personal Multimedia Communications ’02, pp. 1078–1082, Oct. 2002. N. H. Vaidya, P. Bahl, and S. Gupta, “Distributed fair scheduling in a wireless LAN,” in Proc. ACM MobiCom ’00, pp. 167–178, Aug. 2000.. Fig. 5. Delay comparison between EEDCF and EDCF.. Fig. 6. Dropping probability comparison between EEDCF and EDCF.. Fig. 3. Throughput vs. time between EEDCF and EDCF. Fig. 7. Medium utilization comparison between EEDCF and EDCF.. Fig. 4. Delay vs. time between EEDCF and EDCF.. Fig. 8. Collision rate comparison between EEDCF and EDCF.. - 499 -.
(5) (a) EEDCF.. (b) EDCF. Fig. 9. Ratios of throughput and weight for EEDCF and EDCF under four different weights.. - 500 -.
(6)
數據
相關文件
Department of Computer Science and Information Engineering, Chaoyang University of
The Performance Evaluation for Horizontal, Vertical and Hybrid Schema in Database Systems.. -A Case Study of Wireless Broadband
Marar (2000), “On the Value of Optimal Myopic Solutions for Dynamic Routing and Scheduling Problems in The Presence of User Noncompliance,” Transportation Science, Vol..
[23] Tiantong You, Hossam Hassanein and Chi-Hsiang Yeh, “PIDC - Towards an Ideal MAC Protocol for Multi-hop Wireless LANs,” Proceedings of the IEEE International Conference
Professor of Computer Science and Information Engineering National Chung Cheng University. Chair
2 Department of Materials Science and Engineering, National Chung Hsing University, Taichung, Taiwan.. 3 Department of Materials Science and Engineering, National Tsing Hua
Jiunnren LAI, Chih-Peng YU, and Chia-Chi CHENG (2007) “ASSESSMENT OF LOCAL STIFFNESS FOR SLENDER CONCRETE MEMBERS USING IMPULSE RESPONSE TEST”, the Proceedings of 2nd
The original curriculum design for the Department of Construction Engineering of CYUT was to expose students to a broad knowledge in engineering and applied science rather than
