1
Fewer Rungs, More Political Families:
Legacy Candidates in Taiwan Elections
Nathan F. Batto
Institute of Political Science, Academia Sinica Election Study Center, National Chengchi University
Abstract:
While most previous literature stresses the successes of political dynasties in transferring power from one family member to another, this paper focuses on their poor record of doing so when facing stiff competition. Since inherited political resources may be inferior to personally accumulated resources, legacy candidates do best when facing mild competition. When the competition is intense, they shy away. Taiwan is an apt place to study the relationship between family politics and
competition because Taiwan has three different systems of local government that generate local politicians with differing levels of political resources. In some elections these politicians only have to make small jumps to move up the ladder, so the pool of potential candidates is very strong and legacy candidates shy away. Where the jump is larger and the competition is thus weaker, legacy candidates run and win in far greater numbers. This paper is the first systematic investigation of legacy politicians in
Taiwan, looking at four election cycles from 2001 to 2014. Unlike most other research which focuses exclusively on the national legislature, this paper looks at candidates with family ties in all elected offices, including the lowest grassroots offices. By revealing the extent of legacy politics below the legislative level, this paper suggest that a narrow focus on national politics severely underestimates the extent and impact of family ties.
Paper prepared for the 2015 Annual Meeting of the American Political Science Association in San Francisco, September 3-6, 2015.
2
Fewer Rungs, More Political Families:
Legacy Candidates in Taiwan Elections
Nathan F. Batto
Consider the case of Yu Ping-tao. Yu wanted to run for the legislature in 2016, and he had settled on a district that his party seemed to have a good chance of winning away from the other main party. Yu had no political experience or special qualifications, but his father had plenty of both. Yu Hsi-kun had been elected to the Taiwan Provincial Assembly in 1981 and had been an important national figure ever since. He had been the premier under President Chen Shui-bian, and he had come within a few percentage points pulling off a stunning upset in the New Taipei Municipality mayoral race a few months earlier. In the party primary, Yu Ping-tao faced an intimidating field, including a famous talk show host, a former legislator, and a member of the New Taipei municipal council. Against this array of talent, Yu had his father’s strong support and all the media attention that came with his lineage. When the primary results were revealed, it was announced that Yu had – surprisingly to much of the national media – finished in last place. Yu Ping-tao will not enter the legislature in 2016. Instead, the party nomination went to the least famous person in the field, the municipal councilor.
Many papers on political dynasties start with an anecdote, but the point is usually to show the successful inheritance of political power. The family political enterprise is portrayed as an unstoppable juggernaut, and successful transmission of office from one member to another is nearly automatic. There are plenty of similar stories in Taiwan that I could have started with, but the story of the failure in the face of a stiff challenge is perhaps more appropriate. Family politics thrives on weak competition. When faced with intense competition, legacy candidates are less likely to enter a race. If they do enter, they are less likely to win. Far from being mighty
warriors ready to take on all challenges, politicians from political family are more like bullies, lording over the weak and shirking away from the strong.
Taiwan is an apt place to investigate the relationship between family politics and competition because it has three different systems of local government. These
different setups generate local politicians with different levels of power resources. Because of this, it will be easier for politicians in some areas to move up to the next
3
office on the political ladder than for politicians in other areas. Where the jump from one office to the next is easiest, the field of potential challengers for the higher office should be filled with highly qualified incumbents of the lower office. Faced with such intense competition, legacy politicians will shy away. In other areas, where the step up the political ladder is very large, the incumbents in the lower offices will be less likely to build up enough political resources to mount an effective challenge, and the pool of potential candidates for the higher office will be much thinner. Legacy politicians often step into this political void.
This paper makes several contributions to the literature. Theoretically, it builds on Dal Bo, Dal Bo, and Snyder’s (2009) suggestion that dynastic politicians are less successful in more competitive areas, arguing that inherited resources often come with a discount. Too much attention has been paid to the strengths of political families; not enough focus has been placed on their weaknesses. Definitionally, most literature only considers national legislators who are related to previous national legislators. While a minority also consider relatives in some local offices, this paper examines candidates with relatives in any elected office, from the presidency to the lowest neighborhood head. That is, this is the first paper to consider the entire spectrum of elected officials in defining political families. Among legislators with relatives who have previously won office, more than half of those relatives only won an office lower than legislator. By ignoring these types of family ties, the previous literature has seriously
underestimated the extent of family influence in electoral politics. Empirically, this is the first systematic study of legacy politicians in Taiwan. This paper provides a portrait of family politicians in Taiwan over the 2001-2014 period and places that experience into the broader comparative context.
Political Families, Inherited Resources, and Competition
In the past decade, a burgeoning literature has grown up on what is increasingly going under the rubric of “political dynasties.” While “dynasty” is an attention-grabbing term, it is perhaps a bit grandiose. In most of the literature, any two related legislators are considered to constitute a dynasty. Two unremarkable one-term legislators hardly calls to mind the grandeur of an imperial succession. This term becomes even more far-fetched if one investigates local elections. In this paper, while I do not entirely eschew dynasty, I generally opt for less sensational terms, such as political families and legacy politicians.
Why study political families? There are two broad concerns. On the one hand, many people are disconcerted by the notion of a political class. Democracies are supposed to be open to all people, and the notion that a specific group of elites can systematically capture power is disturbing. Democracy is supposed to be free of
4
aristocracy, yet it seems that the “People’s Dukes” (Hess 1966, 1) still exist.
Nevertheless, several studies have come to the conclusion that “power begets power” by showing that politicians who serve more time in office are more likely to establish dynasties (Dal Bo, Dal Bo, and Snyder 2009, 115; Rossi 2014; Querubin 2013; though see Van Coppenolle 2014, ch 5 for a null finding).
Second, there is evidence that political families induce subpar economic
outcomes. Asako, Iida, Matsubayashi, and Ueda present a formal model that assumes family politicians have superior bargaining power and lower costs for seeking office and implies that districts with family politicians will enjoy higher levels of
government distributions but will nonetheless suffer lower economic growth because those distributions will be inefficiently concentrated on a small proportion of the population. They present evidence that Japanese districts with family politicians have indeed experienced subpar economic growth in the 1997-2007 period (Asako, Iida, Matsubayashi, and Ueda 2015). Mendoza, Beja, Venida, and Yap paint an even more damning indictment of family politicians in the Philippines. They show that districts represented by family politicians have suffered lower standards of living, lower human development, and higher levels of inequality (2012).
Why can legacy politicians win office? Van Coppenolle suggests that they may have advantages on the voter demand side and on the elite supply side (2014, 13). On the one hand, family politicians may have an advantage in name recognition or because their family name conveys a “brand” image to voters. This may be especially important in electoral systems with multi-member districts in which parties routinely nominate multiple candidates and voters must chose a specific individual. The most common such systems are open list proportional representation, the single transferable vote, and the single non-transferable vote. In these elections, party affiliation is no longer a sufficient cue, and many voters turn to some other heuristic, such as the candidate’s place of birth, to decide who to vote for (Shugart, Valdini, and Suominen 2005). A recognizable name could also serve as such a heuristic (Van Coppenolle 2014, 17; Smith 2012, 42-48). Smith presents evidence that family politicians are more common in countries with candidate-centered electoral systems (Smith 2012, ch 3). However, Cruz, Labonne, and Querubin cast doubt on whether simple name recognition is really the driving force. Using a big-data approach, they show that candidates in the Philippines receive more votes when their party-mates are more central in the network of surnames in a village. Since there is no straight-ticket voting mechanism, this result cannot be obtained by simple name recognition. In other words, something else must be at work. They point to the supply side (Cruz, Labonne, and Querubin 2015).
non-5
family politicians that make them stronger candidates. In particular, family politicians often have superior resource endowments because the earlier politician can pass down resources accumulated over the course of a career to his or her successor. Such
resources might include personal wealth, access to wealthy donors, networks of campaign workers, volunteers, or potential supporters, contacts and influence with powerful senior politicians, and an understanding of how to work the levers of power. In the aforementioned Asako et al formal model, these superior resource endowments convey superior bargaining power, ensuring that family politicians will be more successful at obtaining government funds. This should help their electoral careers as well (Asako, Iida, Matsubayashi, and Ueda 2015). Similarly, Cruz, Labonne and Querubin argue that the driving factor of electoral success in the Philippines is that family politicians are better positioned to engage in clientelistic practices such as vote buying (Cruz, Labonne and Querubin 2015).
However, Dal Bo, Dal Bo, and Synder find that in the USA, family politicians are more common in less politically competitive states. They speculate that politicians can safely pass power to family members if they can be confident that their party has a secure electoral advantage (Dal Bo, Dal Bo, and Synder 2009, 36). This implies that family politicians are actually weaker than non-family politicians. Where there are viable alternatives, family politicians seem to be crowded out. This finding seems to be at odds with evidence from Japan and the Philippines which indicates that dynastic candidates have larger winning vote margins than non-dynastic candidates. However, the scholars producing those results pointed precisely to the discrepancy in candidate quality. Dynastic candidates have done better because they enjoy far more resources than non-dynastic candidates (Asako, Iida, Matsubayashi, and Ueda 2015; Mendoza, Beja, Venida, and Yap 2012).
In this paper, I build upon this insight to argue that inherited resources can be a substitute for personally accumulated resources. However, inherited resources are not necessarily superior. On the one hand, some of the effectiveness of the resources may be lost in the transferral from one family member to another. For example, key members of the husband’s mobilization network may not be willing to work for the wife, and senior politicians who are willing to meet with the father might not have time for an audience with the daughter. On the other, if a non-dynastic politician has been able to build up a significant base of resources during his or her political career, that politician might be able to match or exceed the inherited resources of a dynastic competitor.
The institutional arrangements are an important factor in determining whether non-dynastic politicians will be able to build up sufficient resource bases. The
6
example, in the United States, the career ladder might go from the state house of representatives to the state senate to the US House of Representatives to either the US Senate or state governor. Especially in populous states, state legislators are able to build up quite a bit of name recognition, organizational prowess, and popularity among an electorate that is not that much smaller than that of a US Representative. In these populous states, non-dynastic state legislators should be able to build up a resource base close to or exceeding that which a dynastic candidate might inherit. Consequently, the advantage to dynastic candidates should be very small. In less populous states, state legislative districts are much smaller than US House districts, so state legislators will have a harder time building up a large enough resource base to challenge for a congressional seat. To put it another way, the former jump, from state legislature to US Congress in a populous state, is much smaller than the latter jump, doing the same thing in a less populous state. When the rungs on the political ladder are closer together, dynasties have less of an advantage.
This leads to the main hypothesis of this paper. Where the institutional arrangements create smaller jumps between offices, family politicians should be scarcer. Where the jump between offices is larger, family politicians should be more prevalent. Taiwan is an excellent case for testing this proposition, since Taiwan’s institutional arrangements create smaller jumps – and thus cohorts of high quality challengers -- in some elections than in others.
The Effect of Local Government Institutions in Taiwan on Political Families
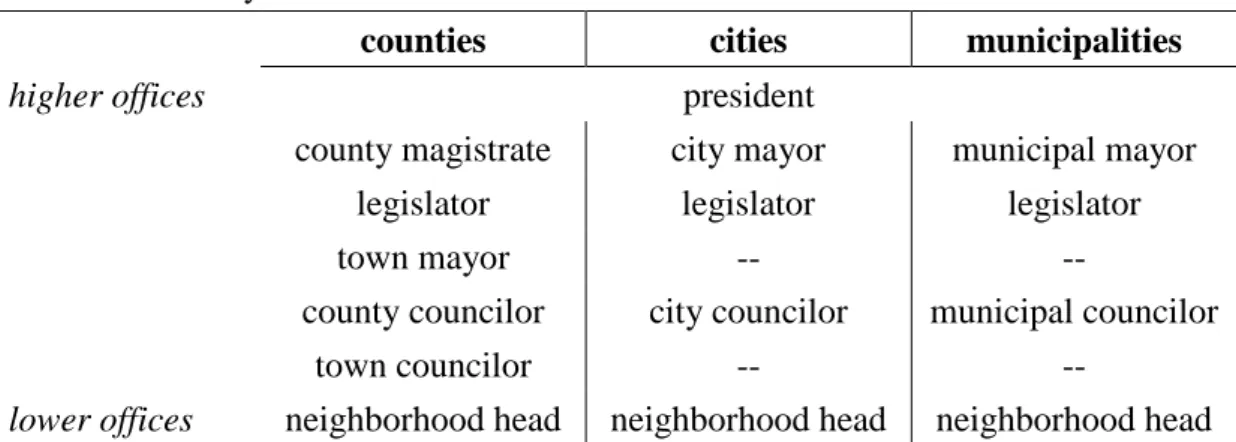
Taiwan is divided into three different systems of local government (see Table 1). The biggest urban areas are designated as municipalities, smaller urban areas are designated as cities, and more rural areas are classified as counties. There are important differences in the administrative autonomy and fiscal resources each type enjoys, but for the purposes of this paper there are two critical differences. First, counties have an extra layer of elected government. Counties are divided up into townships, and these townships elect mayors and town councils.1 Second,
municipalities have larger populations than cities or counties. Because of this, the electorates for municipal council districts tend to be far larger than those for city or county council districts. County populations currently range from very small to larger than cities, though all current counties are smaller than municipalities.
This paper focuses on three jumps up the political ladder. First, the jump from neighborhood head2 to county, city, or municipal (CCM) council3 is available
1 Cities and municipalities have an equivalent layer of administration, the district. However, district
heads are appointed and almost never pursue careers in elective office. There are no district councils.
2 Neighborhood heads are elected in single seat plurality elections.
7
everywhere in the country since all locales elect neighborhood heads and CCM councils. This is a fairly large jump, though there are variations. Anecdotal evidence suggests that Taiwanese politicians think of two indicators to determine how difficult a jump is. More obviously, the smaller the gap between the number of votes required to win a lower office and the number need to win a higher office, the easier the jump. Less obviously, politicians also consider the size of the districts. If the district for the lower office is close in size to the district for the higher office, the jump is easier. That is, an overlapping electorate makes the jump easier even if the politicians did not win a large number of those votes in winning the lower office. With larger lower-level districts, ambitious politicians have a chance to build ties with more voters, by building name recognition, doing constituency service, showing up at local events, building relationships with local elites, directing government funds to the district, and so on. Even if these efforts do produce votes in the lower-level election, they give the politician a foundation to build on if he or she decides to challenge for a higher office. Table 2 shows how difficult Jump 1 is in these terms. In municipalities, this is an extremely difficult jump. The average neighborhood head needs to win 13.1 times as many votes to win a municipal council seat, and he or she must campaign in an electorate 51.6 times as large. Neighborhoods in cities and counties are somewhat smaller than their counterparts in municipalities, but the average electorates and winning totals for city and county council are much smaller than those in
municipalities. As a result, Jump 1 is somewhat easier in counties, though it is still quite daunting. County neighborhood heads have to increase their votes by an average of 8.6 times, and they must campaign in an electorate 27.5 times larger than their neighborhoods. Jump 1 is most plausible in cities, where hopefuls only need 4.8 times as many votes as their average victory in neighborhood head elections. This is a relatively manageable goal, though it is made more difficult by moving a plurality election to a single non-transferable vote election with many more candidates to split the vote. Moreover, they need to make this increase in mostly unfamiliar territory, as the electorates are 22.8 times larger.
If Jump 1 is extremely difficult, Jump 2, from township council4 to county council is much easier. Town council members only have to win 4.8 times as many votes, and they can seek these votes in an electorate that is only 5.8 times as large.
A high proportion of challengers, especially the most serious challengers, for the CCM council seats are politicians trying to make Jump 1 or Jump 2. Jump 2 is the easiest route, but it is only available in counties. This implies that candidates from political families seeking to win a CCM council seat will be confronted with much more intents competition in counties than in municipalities or cities.
8
Jump 3 considers the move from the CCM councils to a district seat in the national legislature.5 This jump is far easier for municipal councilors than for their counterparts in cities and counties. The average municipal council has to increase his or her vote share by 6.1 times, though this task is made easier by the fewer
competitors in single seat legislative races. Moreover, municipal councilors can pursue these votes in familiar territory, as legislative districts only have 1.7 times as many voters as municipal council districts.6 County and city councilors have to win 12.3 and 22.0 times as many votes, and they must do so in electorates that are 5.0 and 5.2 times larger, respectively.7 Since Jump 3 is much easier in municipalities
municipal councilors should have built up more of the resources needed to run for legislator than county or city councilors. Consequently, the inherited resources of family politicians should be less of an advantage in legislative elections in municipalities.
Data Collection
Data on political families are often collected from reference works giving the biographical data of elected politicians or by using algorithms to match surnames. Neither of these strategies is feasible in Taiwan. On the one hand, there are no standard reference works giving family connections for legislators, much less members of CCM councils. On the other hand, since the top ten surnames in Taiwan account for roughly half the population, it is not reasonable to assume that two politicians with the same surname are related.
I compiled data on family connections by reading Taiwan’s three main newspapers, the United Daily News, the China Times, and the Liberty Times. Taiwanese newspapers are national, but they have a local section for each different region. Most of the data on CCM council candidates are drawn from a fairly standard story in the local section. Between the date the candidacies are formally filed with the election commission and the election itself, there is usually a story introducing the candidates. Typically, the reporter will give one or two bits of information about each candidate. If the candidate is an incumbent, that is almost always mentioned. For
5 Prior to the 2005 constitutional reform, the legislature had 184 seats elected in multi-member districts
using the single non-transferable vote and 41 seats elected by party list using closed list PR. After reform, 73 seats are elected in single seat districts using the plurality rule, 6 are elected in multi-member districts using the single non-transferable vote and 34 seats elected by party list using closed list PR.
6 Prior to electoral reform, both municipal council and legislative elections used the single
non-transferable vote, and councilors only needed 2.7 times as many votes to win a seat. The electorate ratio was 2.0.
7 Prior to electoral reform, county and city councilors had to win 5.7 and 8.0 times as many votes in
electorates that were 7.6 and 5.5 times as large. In other words, Jump 3 was more difficult for county and city councilors both before and after electoral reform.
9
incumbents, reporters usually mention other elected offices, whether current or past, family ties, factional affiliation, or some other characteristic. Family ties are most likely to be mentioned for new politicians; politicians who have won elected offices are usually described by that record. In other words, reports often do not mention family ties for incumbents. To uncover those, it is often necessary to go back to that politician’s first campaign for office. I collected data from four election cycles. The data for the fourth cycle are thus almost certainly more complete than those for the first cycle. However, there are still many incumbents who were first elected five or more cycles ago, so the current data set may still be missing some family ties even in the most recent election cycle.
Another problem with the data is that I depend heavily on local reporters, and the quality of reporters can vary significantly. A reporter in one area might tell readers all the important details, while one in another might write in vague platitudes. I tried to overcome this by looking at multiple newspapers, but there are undoubtedly many family ties that I was unable to uncover.
Most seriously, there was a systematic bias in the amount of coverage given to each area. More populous areas were more heavily covered. Municipal council elections were heavily covered, so I am confident that I have uncovered a high proportion of the family ties among municipal council candidates. Counties, especially sparsely populated counties, were not always covered as well. I have filtered out the two smallest counties8 from the county council data since there were almost no stories from those two counties during the four election cycles. I have kept all the other counties, but I suspect I have uncovered a lower proportion of actual family ties in counties and cities than in municipalities.
This is a problem because the one of the main hypotheses of this paper is that there should be more family politicians in municipal council elections than in county or city council elections. This result could be caused by data collection, not by the hypothesized difference in resources. While I will try to allay this fear with more detailed tests, the reader should keep the data collection problem in mind.
For legislative candidates, the standard newspaper stories introducing the candidates were somewhat less useful. Legislative candidates are more likely to have previous electoral experience than CCM council candidates, so reporters tended to report those previous offices as the most important bit of information about each legislative candidate. Perhaps reporters also assumed that legislators have national profiles and readers already knew their family ties. At any rate, I used a more general search strategy for legislators, looking for newspaper stories with politician’s name
8 Candidates from Kinmen and Lienchiang Counties are not included in the CCM council data, though
10
and “father,” “mother,” and other similar words. Wikipedia turned out to be one of the most useful sources for successful legislative candidates, though very few losing candidates had a Wikipedia page.
In this project, I define a legacy candidate as a candidate for an office with a relative who has previously won any elected government office at any level since the ROC assumed control of Taiwan in 1945, from the presidency to a neighborhood head. This eliminated a few legislators with high-profile family members in powerful unelected positions. Most spectacularly, John Chiang Hsiao-yen, whose father was (unelected) President Chiang Ching-kuo and whose grandfather was (unelected) President Chiang Kai-shek, was not classified as having family ties. However, the number of such legislators with relatives who were unelected presidents, cabinet ministers, or generals was relatively small (3, 5, 3, and 2 in the four elections).9 Such politicians were rare in the lower-level CCM council races.10
A Portrait of Family Politicians in Taiwan
Since this is the first systematic study of family politicians in Taiwan, it will be useful to present some basic descriptive statistics. Most of the comparative literature considers only the national legislature when defining dynasties. A legislator is usually considered to be dynastic if he or she has a relative who has previously served in the national legislature. There is considerable variation both between countries and within the same countries in different time periods. 11% of legislators in the United States from 1789 to 1858 were dynastic, though this fell to 7% from 1966 to 1996 (Dal Bo, Dal Bo, and Snyder 2009). In Canada, the proportion has ranged from just over 7% in the 1890s and 1940s to just under 2% in the 1980s and 1990s (Smith 2012). Both Ireland and Japan have had roughly 25-30% dynastic legislators in every parliament since the early 1970s (Smith 2012). In Britain, around 35% of members of parliament in the 1860s had a relative who had preceded them as an MP, though this has fallen to under 10% since the 1980s (Van Coppenolle 2014, 23, 72). The Philippines has particularly high levels of dynastic legislators. 37% of the members of the 15th
Philippine Congress had a relative in one of the previous three congresses (Mendoza, Beja, Venida, and Yap 2012), though another study claimed that over half of the members of congress belonged to political dynasties (Querubin 2013). A few studies expand the definition of legacy politicians to include MPs with relatives in regional parliaments and the cabinet, Van Coppenolle finds that 10% of the Belgian parliament
9 Others, such as former Premier Lee Huan’s children, Lee Ching-hua and Lee Ching-an, were
considered family politicians since both were elected prior to 2001 and could be classified as having a sibling in elected office.
10 One county council candidate was introduced by reference to his brother, who was on the list of Top
Ten Most Wanted criminals. The candidate won easily. It turns out that organized crime bigwigs are pretty good at mobilizing votes!
11
elected in 2010 were dynastic. However, she does not provide information on how many of these had a relative in the national parliament, so it is not clear how much including regional parliaments inflates the definition. Mendoza, Beja, Venida, and Yap do include this detail in their study of the Philippines. They identify 37% of members of congress as having a relative in one of the previous three congresses.11 If they expand the definition to include the heads of local governments (governors, vice-governors, mayors, and vice-mayors) elected in the same time period, this proportion soars to 67%. This finding suggests that an exclusive focus on national politics severely underestimates the extent of family politics, at least in the Philippines.
In Taiwan, I find 26.0% of legislators have some sort of family tie. However, only 12.0% of them have a relative who had previously been in the legislature or other higher office. Using the conventional definition, Taiwan’s 12% puts it higher than modern-day Canada, Belgium, and United States, but far below Ireland, Japan, or the Philippines.
Nevertheless, this 12.0% does not reflect the full reach of family politics in Taiwan, since over one fourth of legislators have been able to build on the political foundation laid by a relative who previously won an election. This finding echoes the evidence from the Philippines and suggests that most previous studies are
underestimating the phenomenon of legacy politics.
Table 3 shows descriptive statistics for legislative candidates from 2001 to 2012. Overall, 14.4% of legislative candidates were identified as having a family member who had previously won elected office, and this percentage was stable over the four election cycles. The two major parties both had high proportions of family politicians: one-fourth of KMT candidates and one-fifth of DPP candidates had family ties. In Ireland and Japan, a bad election for a party with lots of family candidates has produced a sharp drop in the overall percentage of legislators with family ties (Smith 2012). This is unlikely to happen in Taiwan, since both major parties nominate large numbers of candidates from political families.
The percentage of women with family ties is much higher than that of men. This is a consistent pattern throughout the data. Women rely on family ties much more than men do. In fact, the gap is even wider among successful legislative candidates and in local elections. This result may give pause to those who think that family politicians are undesirable in democracies. Taiwan’s relatively high rate of female representation is one of its most progressive democratic achievements (Batto 2014; Batto, Juang, and Lin 2014). It would not have managed to put so many women into elected offices if it had eschewed all politicians with family tiers.
11 Another study of the Philippines using a different name matching methodology suggests that the
12
Family politicians are disproportionately successful in legislative elections. 29.1% of incumbents have family ties, while only 7.1% of challengers do. Not
unrelated, 26.0% of winners are from political families, while only 8.0% of losers are. From a regional perspective, the heavily Hakka north-central area has relatively few family politicians, while the Min-nan heartland in the central, south-central, and south have much higher family representation. Family politics is clearly not merely a rural phenomenon, as the highly urbanized north (roughly the greater Taipei metro area) has roughly the same percentage of family legislators as the overall average. The party list has fewer family legislators.
Turning to CCM council elections, Table 4 reveals similar patterns to those from the legislature with a few exceptions. The percentage of CCM council candidates with family ties is slightly lower than that for legislative candidates (12.8% to 14.4%), but the percentage of winners with family tiers is significantly lower (16.5% to 26.0%). One reason for this is that a higher percentage of CCM council family candidates are challengers, and challengers are much more likely to lose. Independent candidates play a much more prominent role in local elections than in national elections, and these unaffiliated CCM council candidates are also more likely to be family
politicians than their counterparts in legislative elections. There is a clear increase in family politicians over time in the data. This may be due to data collection rather than an actual increase in the real world.
Jumping up the Career Ladder
The main hypothesis of this paper is that the harder the jump up the career ladder, the more prominent family politicians should be. The assumption is not necessarily that each specific individual will face a specific degree of difficulty, since each candidate has his or her unique set of qualifications and resources. Rather, I assume that in districts with easier jumps, there will be a larger pool of politicians who have built up large resource bases and might consider trying to make the jump. Where the jump is harder, the pool of potential challengers will be weaker and family politicians with inherited resources are more likely to step into the void.
Above, it was argued that municipal councilors face a much easier Jump 3 than city or county councilors. Table 3 shows that legislative candidates from
municipalities do in fact have a smaller proportion of family politicians. However, municipalities also tend to have a higher proportion of hopeless candidacies, and most of these turkeys do not have family ties. To avoid a conclusion driven by these non-serious candidates, I pay special attention to winners, who are non-serious almost by definition. In fact, there is only a small difference in family ties among legislators elected from counties, cities, and municipalities.
13
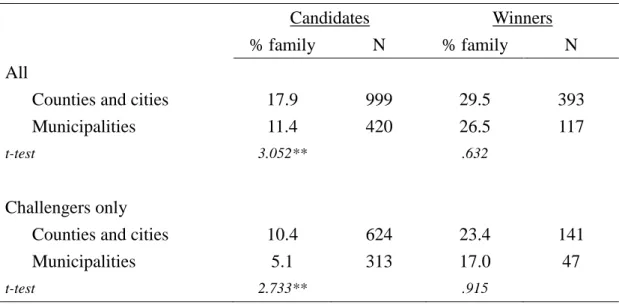
Table 5 shows a more precise contrast of municipalities with cities and counties. Looking at all legislative candidates, 17.9% in cities and counties have family ties, while only 11.4% in municipalities do, and this gap is statistically significant. Among winners, the gap is still in the expected direction but it only 3% and not statistically significant. The theoretical focus suggests that the pool of challengers will be different in municipalities, so perhaps the evidence will be clearer there. Among challengers, the gap in the percentage of family politicians is still significant among all
challengers. Unfortunately, the gap among winning challengers, while substantively large at 6.4% and in the expected direction, is not statistically significant. In short, the legislative data are suggestive, but there simply are not enough cases to provide clear support for the hypothesis.
Fortunately, the number of cases is much larger at the local level. Above, it was argued that Jump 2 is far easier than Jump 1. Since Jump 2 is only available in counties, the pool of potential challengers in CCM council elections who might deter family candidates should be much deeper in counties than in cities or municipalities. Thus, the expectation is that family politicians will be less common in counties. Table 6 shows that this is indeed the case. Among all candidates, 15.7% of city and
municipality council candidates have family ties while only 10.9% of county council candidates do. This trend holds whether one looks only at winners, only at
challengers, or only at winning challengers. All of these gaps are in the expected direction and statistically significant.
Corroborating Evidence from New Municipalities
The results from the CCM council elections provide a measure of confidence that the suggestive but not quite statistically significant patterns observed in the legislative elections are not merely statistical aberrations. However, the results from the CCM council elections can be questioned because of the problems discussed in the section on data collection. More family ties were uncovered in more heavily populated areas, and it is plausible that this pattern is a result of newspapers’ decisions to cover heavily populated areas more thoroughly rather than any differences among the candidates.
To allay this concern, I look more carefully at the municipalities, taking advantage of a recent administrative reform. In 2010, four new municipalities were formed. The new Taichung Municipality was formed by merging the former Taichung City and Taichung County, the new Tainan Municipality was formed by merging the former Tainan City and Tainan County, the new, enlarged Kaohsiung Municipality was formed by the addition of the former Kaohsiung County to the former, smaller Kaohsiung Municipality, and the former Taipei County was upgraded to become New
14
Taipei Municipality. In 2014, one more municipality was created, as the former Taoyuan County was upgraded to Taoyuan Municipality. Whereas in 2006, 69.4% of the national population had resided in counties and only 18.1% in municipalities, by the end of 2014 only 35.4% of Taiwan’s people lived in counties while 60.0% lived in municipalities.
From an electoral standpoint, these new municipalities were built on the
foundations of the earlier administrative districts. Some parts had been counties, while other parts had been cities or municipalities. I am particularly interested in the three new municipalities that were mergers. In 2010, these three municipalities held elections for the new municipal councils, but the former counties and former cities had very different pools of candidates. In the former counties, all the incumbents holding township level offices suddenly had their positions eliminated. This included not only town councilors but also town mayors. In the absence of administrative reform, it is a clear move down the ladder to go from town mayor to county councilor. However, because municipal councilors have more power and represent more voters than county councilors, moving from town mayor to municipal councilor was more a lateral move than a downgrade. The pool of potential candidates for the municipal council was thus extremely deep. In the former cities (and municipalities), there were no township-level incumbents, so the pool of potential candidates was not particularly deep. Thus, within the same election, the proportion of family candidates should be markedly different. Note that newspapers tended to give fairly thorough coverage to municipal council elections, so the threat of systematically biased coverage is probably not driving these results.
Given the above, there should be fewer candidates with family ties in the former counties than in the former cities or municipalities. Indeed, this is precisely what happened. Overall, 16.3% of candidates in the former counties had family ties while 25.5% in former cities and municipalities did (see Table 7). Moreover, as one cuts deeper into the data, the differences become increasingly stark. Among the most serious candidates, those who actually won, the gap is 15.4% to 32.9%. Among the theoretically significant challengers, the gap is 13.0% to 28.8%. Most stunningly, among the challengers who won, the gap is a yawning chasm, 10.8% to 46.2%. Politicians with inherited family resources poured into the first municipal council elections in the former cities and municipalities, but they largely sat the elections out in the former counties. This is powerful evidence in support of the hypothesis.
A second way to leverage the administrative reform is to examine what
happened in the former counties in the second election. In the first election, there were large pools of township level politicians with formidable resource bases available to jump into the races. This intense competition scared off family politicians relying on
15
inherited resources. However, four years later in the second round of municipal
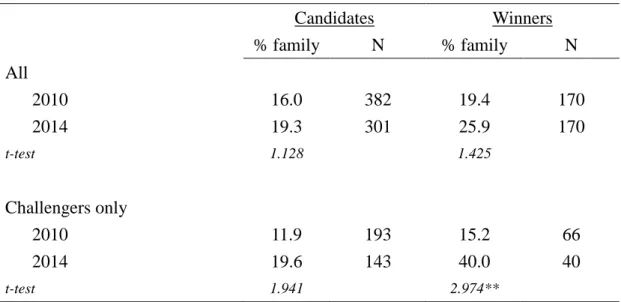
council elections, all those former township level politicians had been out of office for four years during which their resource bases had atrophied. Thus, politicians with family backgrounds faced a far less intimidating field of potential competitors in the second cycle than in the first cycle. Based on this, I expect to see far more family politicians in the second round than in the first round in the parts of the new municipalities that were formerly counties. Table 8 shows the data. Among all
candidates, the difference between 2010 and 2014 is slight, with 16.0% and 19.3% of all candidates coming from political families. While the gap is in the expected
direction, it is not statistically significant. However, when one focuses on challengers, the differences become clearer. In 2010, 11.9% of challengers had family ties, and this percentage increased to 19.6% in 2014, a gap that is borderline statistically
significant.12 Among winning challengers, this gap increases dramatically, from 15.2% in 2010 to 40.0% in 2014. Even with the relatively small number of cases, this is statistically significant. This finding complements the previous one. While family politicians largely sat out the intensely competitive first elections in the parts of new municipalities that had formerly been counties, they contested the second round in much greater numbers. Once the level of competition receded, family politicians moved in to fill the void.
Conclusion
This paper has argued that legacy politicians are not unstoppable juggernauts. They tend to appear in greater numbers when the competition is weak. The evidence from Taiwan for this proposition is clear. In CCM council elections, there are far fewer legacy candidates for county councils, where the presence of township
councilors leads to stronger pools of potential challengers, than for city or municipal councils. In legislative elections, the relative strength of municipal councilors leads to fewer legacy candidates in legislative districts in municipalities than in cities or counties. This paper also presents powerful corroborating evidence by looking at the effect of administrative reform. Where new municipalities were built on the
foundations of former counties, there were fewer legacy politicians in the first municipal council elections. However, by the second cycle of municipal council elections, the power of the former township office holders faded. Faced with this weaker field of competitors, legacy politicians ran and won in far greater numbers than four years previous.
There are always more angles to study. This paper has considered competition from the perspective of candidate quality. Dal Bo, Dal Bo, and Snyder thought of
16
competition from a partisan perspective (2009). It would be interesting to know if Taiwan’s experience follows the American experience, with legacy politicians doing far better in places where one party is dominant.
It would also be interesting to investigate whether family politics has the same adverse effect on the local economy in Taiwan as has been documented in Japan and the Philippines. Taiwanese elite families do not exert the same degree of economic and social dominance over their localities that Filipino elites do. Moreover, as this paper has shown, the national legislature is merely one of many arenas that family politicians seek to enter. A district with a non-legacy legislator may have a council full of legacy politicians.
The relationships between family politicians and gender and ethnicity are intriguing. Women win a high proportion of offices in Taiwan, and they are
disproportionally legacy candidates. However, political dynasties in the Philippines are gender-neutral (Mendoza, Beja, Venida, and Yap 2012). Why do Taiwanese politicians routinely try to bequeath power to their daughters, wives, and sisters? Similarly, the regions with the fewest legacy politicians in Taiwan are also those that have high proportions of Hakkas. Is there a relationship between ethnicity and passing political power to family members?
17 References
Asako, Yasushi, Takeshi Iida, Tetsuya Matsubayashi, and Michiko Ueda. 2015. “Dynastic Politicians: Theory and Evidence from Japan.” Japanese Journal of
Political Science 16, 1: 5-32.
Batto, Nathan F. 2014. “SNTV, MMM, Gender Quotas, and Female Representation.”
Issues & Studies 50, 2: 39-76.
Batto, Nathan F., Wen-Jong Juang, and Chiung-chu Lin. 2014. “From One Fourth to One Third: The Electoral Effects of Reserved Female Seats” (in Chinese).
Soochow Journal of Political Science 32, 1: 99-141.
Cruz, Cesi, Julien Labonne, and Pablo Querubin. 2015. “Politician Family Networks and Electoral Outcomes: Evidence from the Philippines.” Mimeo.
Dal Bo, Ernesto, Pedro Dal Bo, and Jason Snyder. 2009. “Political Dynasties.” The
Review of Economic Studies 76: 115-142.
Hess, Stephen. 1966. America’s Political Dynasties from Adams to Kennedy. Garden City, NY: Doubleday.
Mendoza, Ronald U., Edsel L Beja Jr., Victor S. Venida, and David B. Yap. 2012. “Inequality in Democracy: Insights from an Empirical Analysis of Political Dynasties in the 15th Philippine Congress.” Philippine Political Science Journal 33, 2: 132-145.
Querubin, Pablo. 2013. “Family and Politics: Dynastic Incumbency Advantage in the Philippines.”mimeo.
Rossi, Martin. 2014. “Family Business: Causes and Consequences of Political Dynasties.” University of San Andres, Department of Economics, Working Paper No. 114. ftp://webacademicos.udesa.edu.ar/pub/econ/doc114.pdf Shugart, Matthew S., Melody Ellis Valdini, and Kati Suominen. 2005. “Looking for
Locals: Voter Information Demands and Personal Vote-Earning Attributes of Legislators under Proportional Representation.” American Journal of Political
18
Smith, Daniel M. 2012. Succeeding in Politics: Dynasties in Democracies. Doctoral dissertation, Dept. of Political Science, University of California, San Diego.
Van Coppenolle, Brenda. 2014. Political Dynasties and Elections. Doctoral
dissertation, Dept. of Methodology, London School of Economics and Political Science.
19 Table 1: Hierarchy of Elected Offices in Taiwan
counties cities municipalities
higher offices president
county magistrate city mayor municipal mayor
legislator legislator legislator
town mayor -- --
county councilor city councilor municipal councilor
town councilor -- --
lower offices neighborhood head neighborhood head neighborhood head Notes: The Taiwan Provincial Assembly and National Assembly are not shown on this table since they have been abolished. In the hierarchy of offices, the Provincial Assembly ranked slightly below the legislature, while a National Assembly seat was roughly as desirable as a town mayor or a municipal council seat. The last Provincial Assembly election was held in 1994, and the body was abolished in 1998. The National Assembly’s last regular election was held in 1996, and it ceased to be a standing body in 2000. One special election for an ad-hoc National Assembly was held in 2005, after which it was abolished altogether.
Table 2: The Difficulty of Moving Up the Political Ladder
ratio of: average winners’ votes average electorates Jump 3:
county / city / municipal council to legislature
counties 12.3 5.0
cities 22.0 5.2
municipalities 6.1 1.7
Jump 2:
town council to county / city / municipal council
counties 4.8 5.8
cities -- --
municipalities -- --
Jump 1:
neighborhood head to county / city / municipal council
counties 8.6 27.5
cities 4.8 22.8
municipalities 13.1 51.6
Notes: Data are from the 2012-2014 cycle of elections. Cells in column 3 are the ratio of the average votes of winners in higher level elections to the average votes of winners in lower level elections. Cells in column 4 are the ratio of the average number of eligible voters in higher level election districts to the average number of eligible voters in lower level election districts.
20
Table 3: Descriptive Statistics on Legislative Candidates from Political Families Candidates Elected Legislators % Family N % Family N All 14.4 1910 26.0 676 Year 2001 13.5 584 24.4 225 2004 16.6 493 25.8 225 2008 13.9 423 29.2 113 2012 13.7 410 26.5 113 Party KMT 25.9 464 30.8 292 DPP 19.7 447 24.7 243 New 0.0 60 0.0 2 PFP 14.0 186 22.6 84 TSU 7.5 134 14.3 28 All others 5.0 619 11.1 27 Sex Female 23.8 458 45.0 169 Male 11.5 1452 19.7 507 region North 12.9 449 26.6 143 North-central 12.4 178 16.7 66 Central 16.3 227 30.1 93 South-central 23.5 179 37.5 72 South 24.9 217 44.2 77
East, islands, indigenous 8.3 169 15.3 59
Party list 9.8 491 17.5 166 Incumbent Yes 29.1 588 31.5 397 No 7.9 1322 18.3 279 Result Winners 26.0 676 Losers 8.0 1234 Type of relative who has previously won office Parent 8.2 1910 14.2 676 Spouse 3.4 1910 7.0 676 Sibling 3.8 1910 7.1 676 Other relative 3.7 1910 6.5 676 Relative’s highest office
Lower than legislator 7.4 1910 14.1 676
Legislator 4.4 1910 7.7 676
Higher than legislator 2.6 1910 4.3 676 Location of
district
County 17.6 854 28.6 339
City 20.0 145 35.2 54
21
Table 4: Descriptive Statistics on CCM Council Candidates from Political Families Candidates Elected Councilors % Family N % Family N All 12.8 7127 16.5 3694 Year 2002 8.3 2219 11.1 967 2005/2006 12.1 1821 15.2 970 2009/2010 16.2 1539 19.0 878 2014 16.5 1548 21.4 879 Party KMT 15.6 2422 18.2 1605 DPP 14.4 1337 16.1 951 New 0.0 54 0.0 15 PFP 6.5 322 5.3 114 TSU 5.1 177 5.4 37 All others 10.4 2974 16.0 972 Sex Female 26.0 1799 31.4 1016 Male 8.3 5328 10.8 2678 region North 13.9 1258 21.0 618 North-central 9.2 1365 10.7 657 Central 12.2 1355 16.8 696 South-central 16.0 1249 19.3 711 South 17.1 1030 21.2 548
East, islands, indigenous 7.8 870 8.4 464
Incumbent Yes 13.3 2978 14.6 2320 No 12.4 4149 19.7 1374 Result Winners 16.5 3694 Losers 8.8 3433 Type of relative who has previously won office Parent 6.0 7127 7.7 3694 Spouse 3.3 7127 4.1 3694 Sibling 1.7 7127 2.4 3694 Other relative 3.3 7127 4.6 3694 Relative’s highest office
Lower than CCM councilor 1.2 7127 1.5 3694
CCM councilor 6.7 7127 8.4 3694
Higher than CCM councilor 4.9 7127 6.6 3694 Type of
council
County 10.9 4335 13.5 2288
City 13.6 1050 17.1 525
22
Table 5: Jump 3: Legislative Candidates in Municipalities vs. Cities and Counties
Candidates Winners
% family N % family N
All
Counties and cities 17.9 999 29.5 393
Municipalities 11.4 420 26.5 117
t-test 3.052** .632
Challengers only
Counties and cities 10.4 624 23.4 141
Municipalities 5.1 313 17.0 47
t-test 2.733** .915
Notes: * p<.05; ** p<.01; *** p<.001.
Table 6: Jumps 1 and 2: CCM Candidates in Counties vs Cities and Municipalities
Candidates Winners
% family N % family N
All
Counties 10.9 4335 13.5 2288
Cities and Municipalities 15.7 2792 21.3 1406
t-test 6.014*** 6.167***
Challengers only
Counties 11.3 2658 17.4 956
Cities and Municipalities 14.2 1491 24.9 418
t-test 2.719** 3.236**
23
Table 7: Candidates from Political Families in Newly Merged Municipalities
Candidates Winners
% family N % family N
All
Former Counties 16.3 240 15.4 104
Former Cities and Municipalities 25.5 161 32.9 82
t-test 2.273* 2.864**
Challengers only
Former Counties 13.0 108 10.8 37
Former Cities and Municipalities 28.8 59 46.2 13
t-test 2.552* 2.913 **
Notes: This table includes data from Taichung, Tainan, and Kaohsiung Municipalities in 2010. * p<.05; ** p<.01; *** p<.001.
Table 8: Former Counties in New Municipalities: First and Second Elections
Candidates Winners % family N % family N All 2010 16.0 382 19.4 170 2014 19.3 301 25.9 170 t-test 1.128 1.425 Challengers only 2010 11.9 193 15.2 66 2014 19.6 143 40.0 40 t-test 1.941 2.974**
Notes: This table includes data from the parts of Taichung, Tainan, and Kaohsiung Municipalities that were formerly counties and from New Taipei Municipality in 2010 and 2014. * p<.05; ** p<.01; *** p<.001.