Web 2.0 服務發展生命週期管理之研究 - 政大學術集成
77
0
0
全文
(2) ABSTRACT This study is motivated by the prospect of harvesting the collective intelligence of the Internet via Web 2.0 services and aims at building a framework for the management of Web 2.0 services development. By reviewing specific features of Web 2.0 services, we identify the acquisition of co‐creators and viewers as the most influential task of Web 2.0 service development. Based on impression management theory and two typical Web 2.0 cases—Facebook and Wikipedia—we distinguish four phases of co‐creator and viewer development throughout the life cycle of Web 2.0 services. The four phases are: model establishment, innovation dispersion, community expansion, and service re‐invention. Besides, we also identify four dimensions of the management of Web 2.0 services development. The four dimensions are: co‐creator, content, control, and dynamic capability. The four phases and the four management dimensions of Web 2.0 service development life cycle are then validated by industry experts and enriched by six Taiwan Web 2.0 service cases—PlaySport, iPeen, AnswerBox, ihergo, MyGo and WEnews. It is hoped that the elaboration of the life cycle of Web 2.0 services development can provide strategic input into the management of Web 2.0 services. . 政 治 大. 立. ‧ 國. 學. KEYWORDS . ‧. Web 2.0, Web 2.0 service, Web 2.0 service life cycle . sit er. io. al. y. Nat. This paper has been accepted as . n. “The Management of Web 2.0 Services Development Life Cycle”, Proceedings of 16th Americas Conference on Information Systems (AMCIS 2010), August 12‐15, 2010, Lima, Peru . Ch. engchi. 2 . i n U. v.
(3) CONTENT. 立. 政 治 大. ‧ 國. Case 7: MyGo……………………………………………………………………………………………… Case 8: WeNews………………………………………………………………………………………….. ‧. y. sit. n. er. io. al. Ch. engchi. . 3 . 06 07 07 08 10 12 14 17 17 23 28 35 41 45 49 . 55 DISCUSSION……………………………………………………………………………………………….. 60 IM for different life stages of Web 2.0 services…………………………………………… 60 IM for different platforms of Web 2.0 services…………………………………………… 64 4C management for different platforms of Web 2.0 services……………………… 65 KM pattern for different platforms of Web 2.0 services……………………………… 71 CONCLUSION………………………………………………………………………………………………. 72 ……………………………………………………………………………………………………………………. 74 . Nat. CHAPTER 5. 5.1 5.2 5.3 5.4 CHAPTER 6. REFERENCES . RESEARCH OBJECTIVES AND RESEARCH BACKGROUND……………………………… LITERATURE REVIEW………………………………………………………………………………….. Web 2.0 and Web 2.0 service……………………………………………………………………… Characteristics of Web 2.0 services development………………………………………. Challenges of Web 2.0 services development…………………………………………….. Perspective of IM theory on Web 2.0 service development……………………….. RESEARCH METHODOLOGY………………………………………………………………………… RESEARCH RESULTS…………………………………………………………………………………….. Case 1: Facebook (臉書)……………………………………………………………………………… Case 2: Wikipedia (維基百科)…………………………………………………………………….. Case 3: PlaySport (玩運彩)…………………………………………………………………………. Case 4: iPeen (愛評網)……………………………………………………………………………….. Case 5: AnswerBox (地圖日記)…………………………………………………………………… Case 6: ihergo (愛合購)……………………………………………………………………………….. 學. CHAPTER 1. CHAPTER 2. 2.1 2.2 2.3 2.4 CHAPTER 3. CHAPTER 4. 4.1 4.2 4.3 4.4 4.5 4.6 4.7 4.8 . i n U. v.
(4) TABLES Comparison of YouTube, Microsoft and Walt Disney……………………………………… Web 2.0 services: scale vs. number of employees............................................. Characteristics of Web 2.0 services development…………………………………………… Participation inequality in Web 2.0 services…………………………………………………… Research process…………………………………………………………………………………………… Challenges of Facebook’s service development………………………………………………. Challenges of Wikipedia’s service development……………………………………………… IM for different life stages of Web 2.0 services………………………………………………. IM for different platforms of Web 2.0 services………………………………………………. Co‐creator management for different platforms of Web 2.0 services…………….. Content management for different platforms of Web 2.0 services…………………. . 立. 政 治 大. ‧. ‧ 國. 學. n. al. er. io. sit. y. Nat. Table 2‐1. Table 2‐2. Table 2‐3. Table 2‐4. Table 3‐1. Table 4‐1. Table 4‐2. Table 5‐1. Table 5‐2. Table 5‐3. Table 5‐4. . Ch. engchi. 4 . i n U. v. 08 08 09 11 14 22 26 63 64 69 70 .
(5) FIGURES Figure 2‐1. Figure 2‐2. Figure 2‐3. Figure 3‐1. Figure 4‐1. Figure 4‐2. Figure 4‐3. Figure 4‐4. Figure 4‐5. Figure 4‐6. Figure 4‐7. Figure 4‐8. Figure 4‐9. Figure 4‐10. . Participation inequality by functional complexity………………………………………….. IM theory.............................................................................................................. IM theory for Web 2.0 services development…………………………………………………… Process of case selection for multi‐case study………………………………………………….. Patterns of service contributors, viewers, and contribution ratio on Facebook… Patterns of service contributors, viewers, and contribution ratio on Wikipedia… Web 2.0 services development model………………………………………………………………. IM framework of Web 2.0 services development……………………………………………… Patterns of service contributors, viewers, and contribution ratio on PlaySport…. Patterns of service contributors, viewers, and contribution ratio on iPeen……….. Patterns of service contributors, viewers, and contribution ratio on AnswerBox. Patterns of service contributors, viewers, and contribution ratio on ihergo………. Patterns of service contributors, viewers, and contribution ratio on MyGo………. Patterns of service contributors, viewers, and contribution ratio on WeNews……. Figure 5‐1. Figure 5‐2. . Cyclic four‐phase life cycle of Web 2.0 services development…………………………… KM pattern for different platforms of Web 2.0 services…………………………………….. 立. 政 治 大. ‧. ‧ 國. 學. . n. er. io. sit. y. Nat. al. Ch. engchi. 5 . i n U. v. 11 12 13 16 17 23 26 27 28 35 41 45 49 55 62 71.
(6) CHAPTER 1: RESEARCH OBJECTIVES AND RESEARCH BACKGROUND The World Wide Web has been considered the new digital era that makes it possible to tap into mass collaboration on a greater scale than ever before, dramatically altering every aspect of modern life (Tapscott and Williams, 2006). Web 2.0 is the network as a platform on which everyone contributes to the development and diffusion of content, tools, or software applications, and Web 2.0 applications are those that make the most of the intrinsic advantages of that platform (O'Reilly, 2007). With the advancement of Web 2.0 technology, service providers can leverage the collective intelligence through the Internet and build different service models to develop all kinds of social communities. Existing studies have offered a broad range of research on the value of Web 2.0 services in specific fields. For example, Bonabeau (2009) pointed out that tools using collective intelligence can perform in decision making better than theorists can explain. Siddiqui (2009) stated the Web 2.0 platform can improve personal productivity and professional development for knowledge workers. However, research to date has not explained how the platform should be developed in order to grow and sustain the community. With the increasing adoption of Web 2.0 services by both enterprises and entrepreneurs in the business world there is an urgent need for a complete . 立. 政 治 大. ‧ 國. 學. ‧. understanding of the development of Web 2.0 services throughout the life of knowledge sharing and collaboration. Based on the number of one‐time adopter of the innovation Rogers (2003) suggested a six‐phase model of innovation development from recognition of a need or a problem, through research, development, and commercialization of an innovation, to diffusion and adoption of the innovation by users, and finally to its consequences. The model considers innovation as an idea, practice, or object that is perceived as new by an individual or other unit of adoption (Rogers, 2003) such as the use of the laptop computer, the Xerox machine, or the mechanized harvester. The model does not consider, however, the continuity of the participation of both the content providers and the content viewers with respect to the innovative technology. Motivated by the prospect of harvesting the collective intelligence of the Internet via Web 2.0 services, this study constructs a comprehensive framework for the management of Web 2.0 services development. The objective of the study is to identify the Web 2.0 services development phases and elaborate each phase, including the challenges of each phase, in developing the collaborative contents. We first review the definition of Web 2.0 services as well as the characteristics and challenges of Web 2.0 services development, and then we identify the critical factors of Web 2.0 services. By examining typical Web 2.0 services, we identify the phases of Web 2.0 service life, then we discuss the typical Web 2.0 cases with two industrial experts to enhance understanding of service development during each phase in the Web 2.0 service Life. Therefore, our Web 2.0 service development model is expected to be used as an analytic tool and management guideline for Web 2.0 services managers when planning and operating Web 2.0 services. . n. er. io. sit. y. Nat. al. Ch. engchi. 6 . i n U. v.
(7) CHAPTER 2: LITERATURE REVIEW 2.1 Web 2.0 and Web 2.0 service O’Reilly (2005) coined the term “Web 2.0,” and many studies refer his viewpoint. Basically, Web 2.0 represents an era of the Web that began after the year of 2001, evolving from Web 1.0. Beside the time point of view, at the same time, it also can stand for a collection of design patterns and business models of the Web sites thriving and robust in the era. Principally, it is about how the new Web works as the network on which Web users contribute to the development and distribution of tools, contents, and software applications over the Internet (Shang, Wu and Hou, 2009). Web 2.0 provides a nutritional space‐time environment for the new service, called Web 2.0 service. In O’Reilly’s (2007) viewpoint, the nature of the service is software, but the Web 2.0 service is different from the traditional software because of its user participation. From the viewpoint of the service user, “whether people are creating, sharing, or socializing, the new Web is principally about participating rather than about passively receiving information” (Tapscott and Williams, 2006, p. 37). The people who use the Web 2.0 service virtually form a community, and the community contributes to the development of the service in many ways and makes the service better. The . 立. 政 治 大. ‧ 國. 學. ‧. participants could be the content providers or the interface generators. They participate in the service development when they use the service. The community is part of the service, and the service users are the co‐creators of the service. Famous Web 2.0 services include Wikipedia, Facebook, YouTube, and Flickr, and all of these services have vibrant communities. Based on the above definitions, the study considers the Web 2.0 service to be the service delivered with user participation and collaboration on the Internet. There is architecture of participation embedded in the service model of the Web site, and it causes the Web 2.0 service to get better as more people use it. This architecture enables the service users to feed the Web site with their effort at the same time they are using the service. The service users can participate in the development of the Web 2.0 service in many ways. In addition to providing content for the Web site, they can organize the information on the site, generate the site interface for themselves and other service users, or even keep the order of the virtual community. All of these participations can make the service better and better over time. . n. er. io. sit. y. Nat. al. Ch. engchi. 7 . i n U. v.
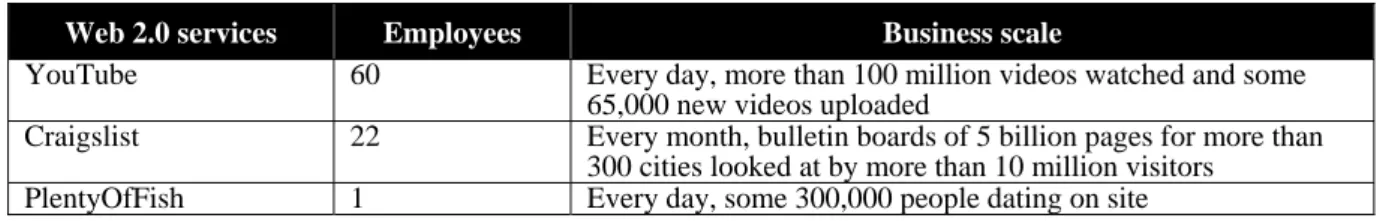
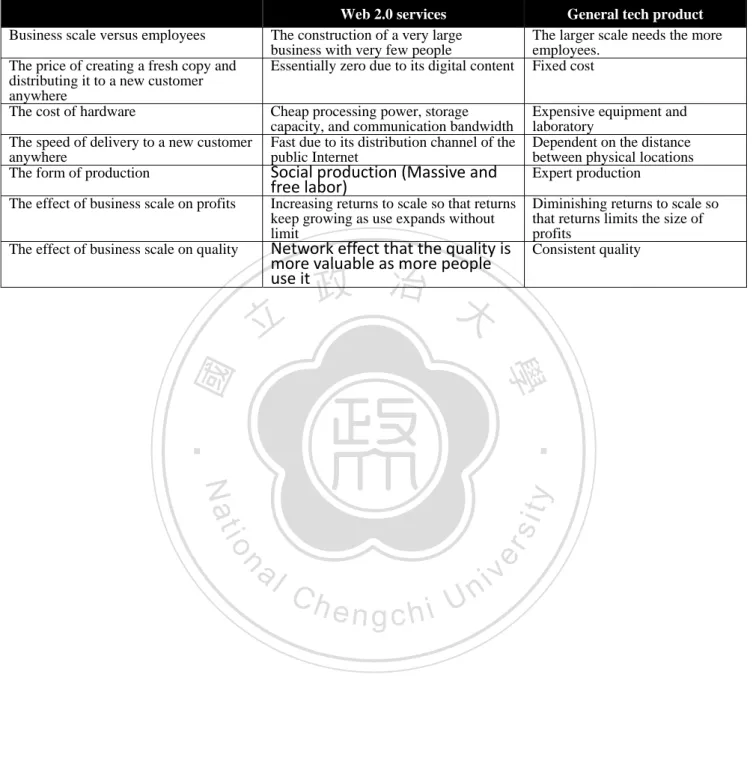
(8) 2.2 Characteristics of Web 2.0 services development Carr (2008) mentioned numerous characteristics of Web 2.0 service development in his book. First, the special construction of the manpower greatly reduces costs but speeds up the service development. According to the concept of the “gift economy” used by Carr (2008), user‐generated content is the gift, the service platform is the gift receiver, and sharing, rather than selling in the market economy, is the economic driver. Second, besides the manpower factor, the hardware resource needed to develop the service is processing power, storage capacity, and communication bandwidth, and these are relatively cheaper than the expensive equipment and laboratories required for other technology innovations. Third, the price of creating a fresh copy and distributing the service to a new customer anywhere is essentially zero due to the digital nature of the content. Fourth, the effect of business scale is positive relative to the service quality because of the network effect that the service quality is more valuable as more people use it, while the quality remains consistent in other technology innovations. Finally, these characteristics make the effect of business scale on profits an increasing one because returns keep growing as use expands without limit, while there is a diminishing return to business scale in other technology environments, which limits the . 政 治 大. 立. ‧. ‧ 國. 學. size of profits. Based on the above points, most of these characteristics come from the participation of the service users. Tapscott, D. and Williams, A. D. (2006) use prosumer this term to …. Hence in this study we adopt service consumer instead of user. Table 2-1 Comparison of YouTube, Microsoft and Walt Disney. y $27.5 million / per employee. al. 70,000. Walt Disney. 133,000. $4 million / per employee. n. Microsoft. er. 60. . Market value contributed by employee. sit. Employees. io. YouTube. Nat. Company. Ch. i n U. $500,000 / per employee. engchi. v. Table 2-2 Web 2.0 services: scale vs. number of employees. . Web 2.0 services YouTube. 60. Employees. Craigslist. 22. PlentyOfFish. 1. Business scale Every day, more than 100 million videos watched and some 65,000 new videos uploaded Every month, bulletin boards of 5 billion pages for more than 300 cities looked at by more than 10 million visitors Every day, some 300,000 people dating on site. . 8 .
(9) Table 2-3 Characteristics of Web 2.0 services development. Business scale versus employees The price of creating a fresh copy and distributing it to a new customer anywhere The cost of hardware The speed of delivery to a new customer anywhere The form of production. General tech product The larger scale needs the more employees. Fixed cost. Cheap processing power, storage capacity, and communication bandwidth Fast due to its distribution channel of the public Internet. Expensive equipment and laboratory Dependent on the distance between physical locations Expert production. Increasing returns to scale so that returns keep growing as use expands without limit. Diminishing returns to scale so that returns limits the size of profits Consistent quality. Social production (Massive and free labor). The effect of business scale on profits. Network effect that the quality is more valuable as more people use it. The effect of business scale on quality. . Web 2.0 services The construction of a very large business with very few people Essentially zero due to its digital content. 立. 政 治 大. ‧. ‧ 國. 學. n. er. io. sit. y. Nat. al. Ch. engchi. 9 . i n U. v.
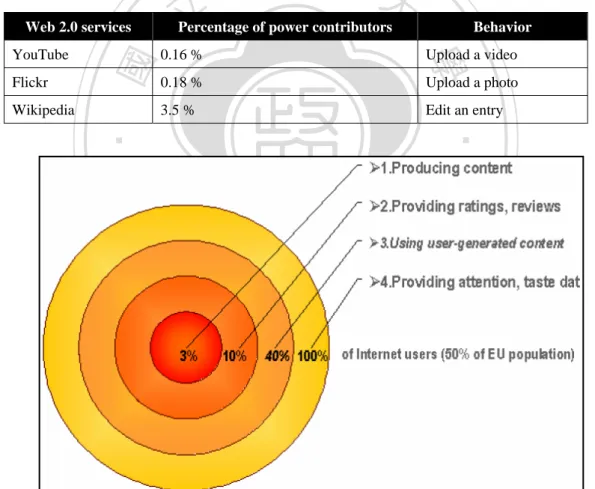
(10) 2.3 Challenges of Web 2.0 services development The development process of the Web 2.0 service has two common challenges. The first is the cold‐start problem as the typical challenge (Perugini, Goncalves and Fox, 2004; Hummel, Burgos, Tattersall, Brouns, Kurvers and Koper, 2005; Julita and Lingling, 2007). This is like a chicken‐and‐egg problem. The Web 2.0 service heavily relies on external people to co‐develop it, and a vibrant community can attract external people to join it, but a useful and interesting community has to exist first. The cold‐start problem is also referred as the day‐one or early rater problem, which means that few people, uses the service in the early days of the service development. Although the users of Web 2.0 services participate in the service development, they do not appear at the same time—some they join the development in the early stage, and some come in afterward. Second, Nielsen (2006) reveals the phenomenon of participation inequality, and this introduces another problem called the de‐lurk problem. The service user can be divided into two masses, one called “contributors,” who upload videos or photos or post an article, and the other called “lurkers,” who just surf and read the page without uploading anything. There is a participation inequality . 立. 政 治 大. ‧. ‧ 國. 學. because most of the content is provided by the contributors (Nielsen, 2006; Tancer, 2008). In order to acquire more contributors, there needs to be a way of either getting outside users to use the service, similar to cold‐start, or encouraging the inside lurkers to contribute something, called “de‐lurking.” Osimo (2008) further points out the various forms of participation based on the functional complexity, and the service users can be further divided into several groups, including content producers, content raters, content reviewers, and so on. It seems that the functional complexity is negative to the size of the user group and suggests that the service should be easy to use to help create de‐lurking. Therefore, the service users not only participate in the service development at different times but also participate in the different forms and therefore provide different types of contributions. What we learn from the above literature is that the service funder should invite the service users to be the co‐creators of the service, contributing their effort in various forms besides just reading the page, and encourage them to participate in the service development more frequently so as to be active users, who continuously contribute their effort. After that, the service users look like employees working for the development of the service at the same time that they use the service. . n. er. io. sit. y. Nat. al. Ch. engchi. 10 . i n U. v.
(11) With these types of free labor, the service funder has little cost to achieve a large business. Broadly speaking, both co‐creators and viewers are the co‐developers of Web 2.0 services via well‐designed participation architecture, which is embedded in the service model. Even viewers who only surf and seem not to provide anything for the service actually contribute something in the background. For example, they can feed the service with their clicks before they read the page, and the service automatically accumulates these clicks to reveal the most popular content. This can drive the co‐creators to provide similar content to earn the “popularity of eyeball,” give the service funders some directions when they need to adjust the service model, and eventually indirectly sustains the Web 2.0 services. When we manage Web 2.0 services, besides the indicators of co‐creators and viewers, we should consider the third indicator, which is the contribution ratio, or the percentage of viewers who are also co‐creators. This helps to evaluate the effect and cost when the service managers need to design incentive mechanisms for the two types of target users. . 政 治 大. Table 2-4 Participation inequality in Web 2.0 services. 立 Percentage of power contributors. Flickr Wikipedia. Behavior. 0.16 %. Upload a video. 學. YouTube. 0.18 %. Upload a photo. 3.5 %. Edit an entry. ‧. ‧ 國. Web 2.0 services. n. er. io. sit. y. Nat. al. Ch. engchi. i n U. v. Figure 2-1 Participation inequality by functional complexity. . 11 .
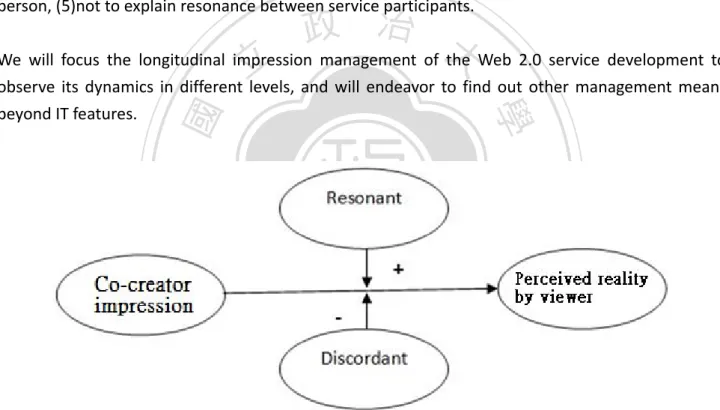
(12) 2.4 Perspective of IM theory on Web 2.0 service development We consider that the focus of the Web 2.0 service management is the management of user participation, and IM theory can help us to explain the different types of participants, including co‐creator and viewer, the different levels of participants, including person and group, and the relations among them. Besides, we emphasize the importance of the continuity of user participation to Web 2.0 services, and IM theory can help us to explain the dynamics of user participation over time. Impression management (IM) theory was originated by Erving Goffman (1959) and also called self‐presentation or identity management. In the IM theory, there are two roles. One role is called the “actor”, who makes the impression on the audience, and the other is called the “audience”, who has the impression about the actor. IM is the goal‐directed attempt to influence the audience’s perceptions about the actor regarding an object or event by providing self‐assessed beneficial information in social interactions. The goal for the aforementioned attempt is to gain an advantageous first impression. The motive for this goal is based on the assumption that the target audience’s impressions about the actor become reality of the target audience. The independent variable in the IM theory is the impression made by the actor, and the dependent variable is the . 立. 政 治 大. ‧ 國. 學. ‧. reality perceived by the audience, and the relationship between these two variables are mediated by the resonance between the actor and the audience. . n. er. io. sit. y. Nat. al. Ch. engchi. i n U. v. Figure 2-2 IM theory. 12 .
(13) Ma and Agarwal (2007) applied IM to explain how IT features facilitate computer‐mediated knowledge sharing. They argued that IT features help the community member successfully made his impression about “who am I” to other community members and then they understood him about “who is he” with consensus to the focal person’s expectation. As a result, the community member gets more satisfied with the service and contributes more knowledge to the service when the perceived reality is closer to the impression he makes. For Web 2.0 service managers, however, the viewpoint of Ma and Agarwal (2007) is too static and narrow because of the following reasons: (1) not to consider dynamic impression, which changes over time, (2) not to consider other possible service participants, which may not be the service members, (3) not to consider other possible management means, which may not be the IT features, (4)not to consider high level impression, which belongs to a group or whole community rather a person, (5)not to explain resonance between service participants. We will focus the longitudinal impression management of the Web 2.0 service development to observe its dynamics in different levels, and will endeavor to find out other management means beyond IT features. . 立. 政 治 大. ‧. ‧ 國. 學. n. er. io. sit. y. Nat. al. Ch. engchi. i n U. v. Figure 2-3 IM theory for Web 2.0 services development. . . 13 .
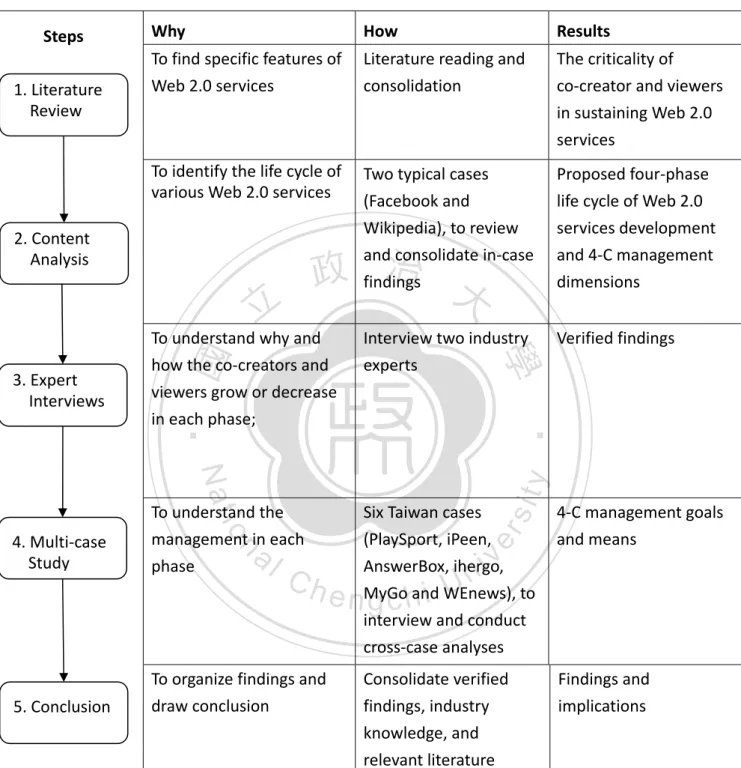
(14) CHAPTER 3: RESEARCH METHODOLOGY Table 3-1 Research process. Why . Steps 1. Literature Review . 2. Content Analysis . How . To find specific features of Literature reading and Web 2.0 services consolidation . The criticality of co‐creator and viewers in sustaining Web 2.0 services . To identify the life cycle of Two typical cases various Web 2.0 services (Facebook and Wikipedia), to review and consolidate in‐case findings . Proposed four‐phase life cycle of Web 2.0 services development and 4‐C management dimensions . To understand why and how the co‐creators and viewers grow or decrease in each phase; . Verified findings . 政 治 大. y. sit. n. Ch. Six Taiwan cases 4‐C management goals (PlaySport, iPeen, and means AnswerBox, ihergo, MyGo and WEnews), to interview and conduct cross‐case analyses . er. io. . al. engchi. To organize findings and draw conclusion . 5. Conclusion . ‧. Nat. To understand the management in each phase . 4. Multi‐case Study . Interview two industry experts . 學. ‧ 國. 立. 3. Expert Interviews . i n U. v. Consolidate verified findings, industry knowledge, and relevant literature . . 14 . Results . Findings and implications .
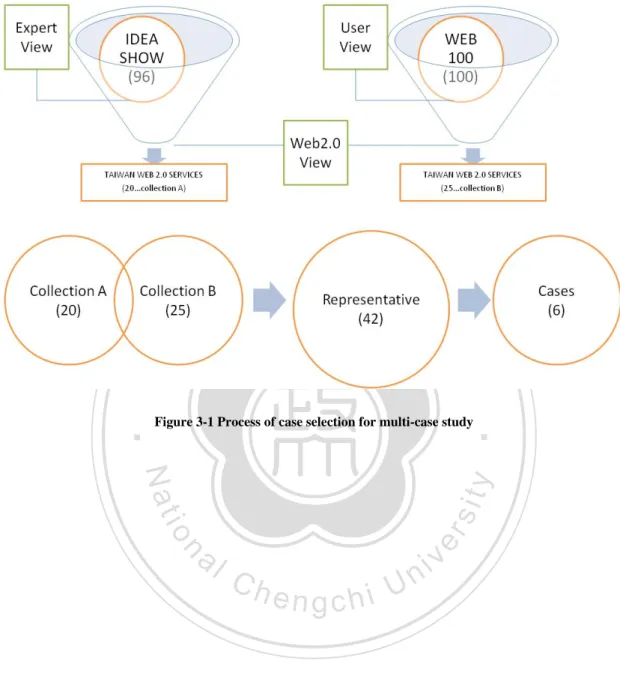
(15) The research process of this study is displayed in Table 1. First, in order to explore the Web 2.0 service‐development life cycle, the study paid particular attention to reviewing related literature regarding the critical features of Web 2.0 service development. Second, we analyzed two typical Web 2.0 services, Facebook and Wikipedia, to identify different phases of the Web 2.0 service development life cycle. These two cases were selected for the following reasons. (1) Grossman (2006) in Time Magazine selected Facebook and Wikipedia as two typical examples of all Web 2.0 services (2) Various Internet marketing metrics reported by several Internet marketing research companies, including Alexa (2010), Nielsen NetView (2010), Compete (2010), Quantcast (2010), Hitwise (2010), Ranking.com (2010), and comScore Media Metrix (2009), showed that Facebook and Wikipedia are the top two Web 2.0 sites according to the traffic ranking, both in the American market and the global market. (3) Both of these cases have related statistics and rich information about the service development, and they publish it on their official Web sites (Facebook, 2009; Wikipedia, 2009) for querying. In addition, to understand deeply the problem of participation inequality, the study collected data from multiple sources—journals, books, official Web sites, and secondary sources (e.g., reported . 立. 政 治 大. ‧. ‧ 國. 學. cases by several Internet marketing research companies)—and adopted three critical indicators—co‐creators, viewers, and contribution ratio—to analyze Web 2.0 service devolvement. This study adopts contribution ratio as the key factor to indentify and analyze the Web 2.0 service development because the construction of a Web 2.0 website depends mainly on co‐creators to contribute while the services grow along with a critical mass of viewers. The continuity of the services is therefore based on a stable flow of participation from both co‐creators and viewers. First, total page view is the most popular indicator to judge the success of a site (Cassidy, 2006; May and Kwong, 2007), and we use Alexa’s Reach data (Alexa, 2010; Wikipedia, 2010a) as the viewer indicator. Co‐creators is selected by the study as the second indicator because the success of Web 2.0 depends upon user‐generated content. Regarding the number of Facebook’s and Wikipedia’s co‐creators, we adopted separately the “active user” data from Facebook’s (2009) and Wikipedia’s (2009) official Web sites to observe longitudinally service development of the two services. The observation period for Facebook is from October 2003 to December 2009, and the period for Wikipedia is from March 2000 to December 2009. Moreover, we plot a scatter diagram of Facebook to portray the patterns of co‐creator and viewer, and then we calculate contribution ratio, the formula which is “active user number / viewer number,” in different phases of service development. After analyzing patterns of contribution ratio, two industry experts are interviewed for getting a richer understanding of the challenges of each phase of Web 2.0 service development. They are the managers of an e‐commerce company, and they have more than four years of managerial experience with Web 2.0 applications. The experts analyzed the market condition and provided industry knowledge based on the preliminary verified findings. Finally, the study draws a conclusion based on these verified and validated results, and research results from these data are discussed below. In multi‐case study, we select six Taiwan Web 2.0 services, including PlaySport, iPeen, . n. er. io. sit. y. Nat. al. Ch. engchi. 15 . i n U. v.
(16) AnswerBox, ihergo, MyGo and WEnews. These cases are selected due to either their potential in commerce or their popularity. The selection process is showed as figure 3‐1. . 立. 政 治 大. ‧ 國. 學 y. Nat. io. sit. . n. al. er. . ‧. Figure 3-1 Process of case selection for multi-case study. Ch. engchi. 16 . i n U. v. .
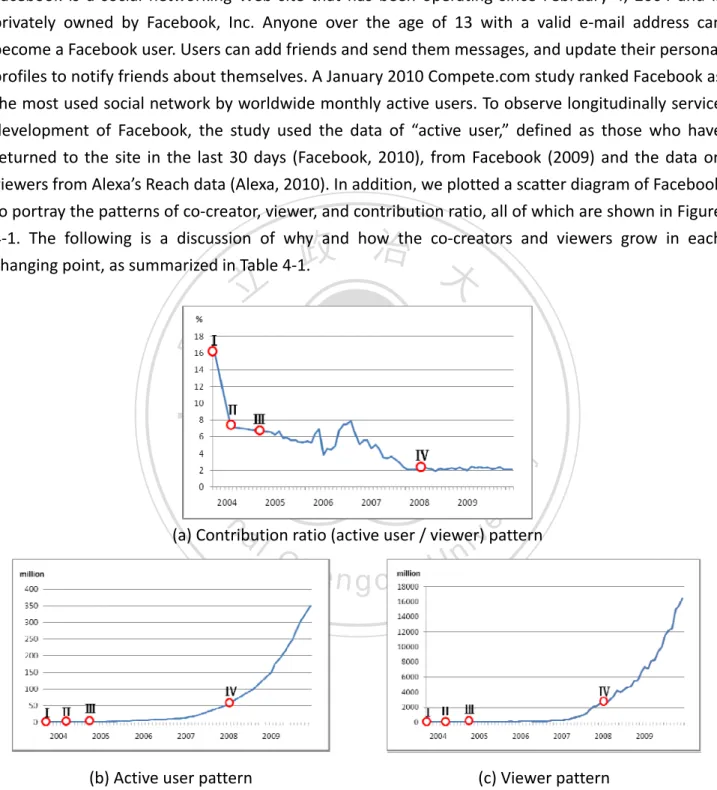
(17) CHAPTER 4: RESEARCH RESULTS . Facebook. Facebook is a social networking Web site that has been operating since February 4, 2004 and is privately owned by Facebook, Inc. Anyone over the age of 13 with a valid e‐mail address can become a Facebook user. Users can add friends and send them messages, and update their personal profiles to notify friends about themselves. A January 2010 Compete.com study ranked Facebook as the most used social network by worldwide monthly active users. To observe longitudinally service development of Facebook, the study used the data of “active user,” defined as those who have returned to the site in the last 30 days (Facebook, 2010), from Facebook (2009) and the data on viewers from Alexa’s Reach data (Alexa, 2010). In addition, we plotted a scatter diagram of Facebook to portray the patterns of co‐creator, viewer, and contribution ratio, all of which are shown in Figure 4‐1. The following is a discussion of why and how the co‐creators and viewers grow in each changing point, as summarized in Table 4‐1. . 立. 政 治 大. ‧. ‧ 國. 學 er. io. sit. y. Nat. (a) Contribution ratio (active user / viewer) pattern . n. al. Ch. engchi. i n U. v. . . (b) Active user pattern . (c) Viewer pattern . Figure 4-1 Patterns of service contributors, viewers, and contribution ratio on Facebook.com. . 17 .
(18) . Changing Point I . On October 28, 2003, Mark Zuckerberg invented Facemash when attending Harvard as a sophomore. Based on the Harvard Crimson (Tabak, 2004), Facemash represented a Harvard University version of Hot or Not to improve poor content, and it used photos compiled for placing two next to each other at a time and asking users to choose the “hotter” person. The number of active users and viewers in this period grew, but very slowly. The initial site generated 450 visitors and 22,000 photo‐views in its first four hours online (Locke, 2007), and that mirrored people’s physical community with their real identities. To accomplish this, Facemash had to become an open investment in order to expand its resources in hardware and bandwidth. In this stage, the main actor was Mark Zuckerberg, the main audiences were the students of Harvard University, and the perception the actor wished to create for the audience was that I liked to share. In order to make that impression on the students of Harvard University, Mark Zuckerberg shared photos he collected. And the students of Harvard University could perceive that impression through visiting Facemash. After accepting that impression, the students of Harvard University might imitate Mark Zuckerberg and attempted to become the co‐creators of the Facemash service . 立. 政 治 大. ‧ 國. 學. ‧. through providing more photos to Mark Zuckerberg. In the resonance process mentioned above, the interaction type between the actor and the audience was person‐to‐person. And the result of that process was that the more successfully the impression delivered and the more audiences of the photo were. Besides, the result could be measured by the impression management indexes, including unique visitor (for short U.V.) and page view (for short P.V.). Changing Point II . n. er. io. sit. y. Nat. al. i n U. v. On February 4, 2004, Zuckerberg launched Facebook with his college roommates and fellow computer science students Eduardo Saverin, Dustin Moskovitz, and Chris Hughes from their Harvard dorm room. With the expansion of the user scale, the growth of active users and viewers was increasing gradually, but contribution ratio was decreasing because the Web site's membership was limited by the founders to Harvard students for the first two months. After that, it was quickly expanded to other colleges in the Boston area, the Ivy League, and Stanford University so that the site faced a capital shortage problem. Facebook incorporated in the summer of 2004, and Facebook received its first investment of US$500,000 in June 2004 from PayPal co‐founder Peter Thiel. At the same time, Facebook moved its base of operations to Palo Alto, California. Users can create profiles with photos, lists of personal interests, contact information, and other personal information. Communicating with friends and other users can be done through private or public messages or a chat feature. However, the big problem here is that a data collection company can end up being lifelong "friends" with millions of individuals. In order to deal with privacy concerns, Facebook designed privacy settings to enable their users to control how they share their information on Facebook, because many users were not willing to permit the application to have access to all kinds . Ch. engchi. 18 .
(19) of data from their profile. In this stage, the main actor was the member of Facebook.com, the person who had a Facebook.com account, the main audience was the public client of Facebook.com, and the perception the actor wished to create for the audience was that I liked to share more. In order to make that impression on the public client of Facebook.com, the member of Facebook.com created the personal page and shared the personal information on it. And the public client of Facebook.com could perceive that impression through visiting the personal page. After accepting that impression, the client might imitate the member of Facebook.com and attempted to become the co‐creator of the Facebook.com service through sharing his or her personal information. In the resonance process mentioned above, the interaction type between the actor and the audience was person‐to‐person. And the result of that process was that the more successfully the impression delivered and the more audiences of the personal page were. Besides, the result could be measured by the impression management indexes, including unique visitor (for short U.V.), page view (for short P.V.), registered member (for short R.M.), and active user (for short A.U.). Changing Point III . 立. 政 治 大. ‧ 國. 學. In September 2004, the Groups application was added, and the Wall was added as a profile feature. . ‧. Users can create and join interest and fan groups, some of which are maintained by organizations as a means of advertising. It later expanded further to include potentially any university student, then high school students, so that the growth of active users and viewers increased more quickly. With overloading and downtime increasing, Facebook received funds of USD$12.7 million in venture capital from Accel Partners for growth to support more than 800 college networks in April 2005, and then USD$27.5 million more from Greylock Partners. The site also announced a high school version in September 2, 2005 to attract more active users. At that time, high school networks required an invitation to join. Facebook later expanded membership eligibility to employees of several companies, including Apple Inc. and Microsoft. The company dropped “The” from its name after purchasing the domain name facebook.com in 2005 for $200,000. Then, however, a cash flow statement showed that during the 2005 fiscal year Facebook had a net loss of $3.63 million. Facebook was then opened in September 26, 2006 to everyone aged 13 and older with a valid e‐mail address; however, it is difficult to prevent children’s usage on Facebook. In November 2006, the share feature was added and Facebook was simultaneously launched on over 20 partner sites. Therefore, the site during this period expanded the number of its co‐creators and reviewers rapidly. In this stage, the main actor was the specific‐interest group of Facebook.com, the people who gathered together virtually based on a specific interest, the main audience was the member of Facebook.com, and the perception the actor wished to create for the audience was that we liked to share with you. In order to make that impression on the member of Facebook.com, the members of . n. er. io. sit. y. Nat. al. Ch. engchi. 19 . i n U. v.
(20) Facebook.com gathered to form a virtual group, to create a group page, and to share the group information on it. And the member of Facebook.com could perceive that impression through visiting the group page. After accepting that impression, the member might join the group or initiate another new group. In the resonance process mentioned above, the interaction type between the actor and the audience was group‐to‐person. And the result of that process was that the more successfully the impression delivered and the more members of the group were. Besides, the result could be measured by the impression management indexes, including unique visitor (for short U.V.), page view (for short P.V.), registered member (for short R.M.), active user (for short A.U.), and registered group (for short R.G.). Besides, the impression the member of Facebook.com wished to created became that I like to share with you due to the group. Changing Point IV . 政 治 大. In November 2007, Facebook announced Facebook Beacon, which was a part of Facebook's advertisement system that sent data from external Web sites to Facebook for the purpose of allowing targeted advertisements and allowing users to share their activities with their friends. After Facebook was criticized for collecting more user information for advertisers than was . 立. ‧ 國. 學. ‧. previously stated, Zuckerberg publicly apologized on December 5, 2007 for the way Facebook launched Beacon. During this period, it has been banned at many places of work to discourage employees from wasting time using the service and blocked intermittently in several countries including Syria, China, Vietnam, and Iran, due to privacy and other issues. For example, it is illegal to go onto Facebook in China. The government has blocked it because it is a form of freedom restricted by the government. Thus, Facebook began to adjust its privacy police and succeeded in giving people control over what and how they share information. All users could then feel confident in contributing their experience, and the contribution ratio appeared to have flattened out from 2008 to 2009. Besides advertising, Facebook cooperated with Apple iTune for music downloading to gain more revenue. Next, Facebook initiated the Open Stream Application Programming Interface (API) service for third parties to develop applications that can execute on the Facebook platform. These APIs attract considerable numbers of users and encourage users to spend more time on the site. The famous application “Happy Farm” was developed based on this mechanism. However, the users have pointed out that they sometimes get tired of all the quizzes and application notifications showing up on their news feed. Facebook then designed the “Block BF Quizzes” application to auto‐block the applications of the update. Next, Facebook announced the German, French, Spanish, and Chinese (for areas outside the PRC) versions in 2008 to attract more active users. The Web site currently has more than 400 million active users worldwide. With the expansion of the scale, the users have more and more complaints about the limitation of maximum number of friends who can be invited, which is currently 5,000. In August 2009, Facebook announced the rollout of a "lite" version of the site, optimized for users on slower or intermittent Internet connections. Facebook Lite offered fewer services, excluded most third‐party applications, and required less bandwidth. A . n. er. io. sit. y. Nat. al. Ch. engchi. 20 . i n U. v.
數據

+7


相關文件
The booklet is divided into four chapters, which cover the spirit and governance framework of school-based management, scope of school- based management, roles
In implementing the key tasks, schools should build on past experiences and strengthen the development of the key tasks in line with the stage of the curriculum reform, through
• developing coherent short-term and long-term school development plan that aligns the school aims, the needs, interests and abilities of students in accordance with the
“Tests of an American Option Pricing Model on the Foreign Currency Options Market.” Journal of Financial and Quantitative Analysis, 22, No.. Bogle on
This study aimed to explore the effectiveness of the classroom management of the homeroom teacher by analyzing the process of the formation of the classroom management and
The imperceptible understanding of the management process in detail design and the unclear procedures occurred from the beginning design proposal to the actual design stage
However, in this case, the lesion was diagnosed as an early stage of PVL rather than linear gingival keratosis, due to the fact that it occurred in a female in the gingiva and also
第八週 生命列車(服務之心) 服務學習的內涵及目標 第九週 生命列車(服務之心) 社會服務的典範 第十週 生命列車(服務之心) 善與惡的價值觀拔河
