行政院國家科學委員會專題研究計畫 成果報告
嵌入式網路通訊裝置評比技術與工具之研發--子計畫四:嵌
入式網路通訊裝置儲存裝置效能評比基準與工具之研發(中
心分項)(2/2)
研究成果報告(完整版)
計 畫 類 別 : 整合型
計 畫 編 號 : NSC 99-2220-E-009-047-
執 行 期 間 : 99 年 08 月 01 日至 100 年 07 月 31 日
執 行 單 位 : 國立交通大學資訊工程學系(所)
計 畫 主 持 人 : 張立平
計畫參與人員: 碩士班研究生-兼任助理人員:李盈節
碩士班研究生-兼任助理人員:吳翊誠
碩士班研究生-兼任助理人員:林玟蕙
碩士班研究生-兼任助理人員:王薇涵
報 告 附 件 : 出席國際會議研究心得報告及發表論文
處 理 方 式 : 本計畫可公開查詢
中 華 民 國 100 年 10 月 31 日
1
行政院國家科學委員會補助專題研究計畫
行政院國家科學委員會補助專題研究計畫
行政院國家科學委員會補助專題研究計畫
行政院國家科學委員會補助專題研究計畫
■
■
■
■成果報告
成果報告
成果報告
成果報告
□
□
□
□期中進度報告
期中進度報告
期中進度報告
期中進度報告
嵌入式網路通訊裝置評比技術與工具之研發-子計畫四:嵌
入式網路通訊裝置儲存裝置效能評比基準與工具之研發(中心分
項)(2/2)
計畫類別:□個別型計畫 ■整合型計畫
計畫編號:NSC 99-2220-E-009-047-
執行期間:2010.08.01 至 2011.07.31
執行機構及系所:交通大學資工系
計畫主持人:張立平
共同主持人:
計畫參與人員:李盈節,吳翊誠,王薇涵,林玟蕙
成果報告類型(依經費核定清單規定繳交):□精簡報告 ■完整報告
本計畫除繳交成果報告外,另須繳交以下出國心得報告:
□赴國外出差或研習心得報告
□赴大陸地區出差或研習心得報告
■出席國際學術會議心得報告
□國際合作研究計畫國外研究報告
處理方式:
除列管計畫及下列情形者外,得立即公開查詢
□涉及專利或其他智慧財產權,□一年□二年後可公開查詢
中 華 民 國 100 年 10 月 30 日
2
國科會
國科會
國科會
國科會補助
補助
補助專題研究計畫成果報告自評表
補助
專題研究計畫成果報告自評表
專題研究計畫成果報告自評表
專題研究計畫成果報告自評表
請就研究內容與原計畫相符程度、達成預期目標情況、研究成果之學術或應用價
值(簡要敘述成果所代表之意義、價值、影響或進一步發展之可能性)、是否適
合在學術期刊發表或申請專利、主要發現或其他有關價值等,作一綜合評估。
1.
請就研究內容與原計畫相符程度、達成預期目標情況作一綜合評估
□
■
達成目標
□ 未達成目標(請說明,以
100
字為限)
□ 實驗失敗
□ 因故實驗中斷
□ 其他原因
說明:
2.
研究成果在學術期刊發表或申請專利等情形:
論文:
■
已發表 □未發表之文稿
■
撰寫中 □無
專利:□已獲得 □申請中 □無
技轉:□已技轉 □洽談中 □無
其他:(以
100
字為限)
已經發表會議論文兩篇(
IWSSPS 2010, CPSNA 2011
,如附件),並被邀請投
稿至
IEEE embedded systems letter
的一個
special issue
3.
請依學術成就、技術創新、社會影響等方面,評估研究成果之學術或應用價
值(簡要敘述成果所代表之意義、價值、影響或進一步發展之可能性)(以
500
字為限)
本計劃成果為固態硬碟的虛擬平台。原則上我們透過產學合作的管道推廣至
業界使用,目前廠商的回應都相當不錯。而學術研究方面,基於這個虛擬平
台,我們目前得以研究開發新的儲存裝置與主機端的溝通方式,藉以達成更
好的效能改善。
Design and Implementation of a
Virtual Platform for Solid-State Disks
摘要
本研究提出一個針對固態硬碟之
虛擬平台,提供線上的即時模擬環境。
該虛擬平台包含兩部分:一個模擬引
擎以及一個虛擬磁碟。模擬引擎部分
可以對固態硬碟內部的硬體架構與韌
體演算法作快速制訂,並進行行為層
次的模擬。該模擬引擎具有高度可重
組性以及使用上的簡便性。而虛擬磁
碟部分則以一個一般的磁碟出現在主
機中,並且直接接收來自於主機的讀
寫動作,就好像是一個真正的磁碟一
般。此虛擬磁碟與模擬引擎之間透過
作業系統內部的事件機制互動,計算
並模擬讀寫延遲,使得該虛擬平台的
效能就像一個真正的固態硬碟一樣。
這個虛擬平台不但能夠幫助固態硬碟
設計者快速地定下韌硬體的組態,縮
短開發測試時間,亦提供研究者一個
絕佳的互動式環境,藉以開發主機端
與儲存裝置的協同式 效能最佳化方
法。
關鍵字: 固態硬碟, 快速雛形化, 效能
模擬
Abstract
This work presents a virtual platform for
solid-state disks (SSDs). This virtual
platform consists of a simulation engine
and a virtual disk. The simulation engine
provides
behavioral
simulation
of
hardware architectures and firmware
algorithms. SSD designers can use the
simulation engine for fast prototyping.
The virtual disk appears as a normal disk
drive in the host, and accepts read/write
requests as if it was a real disk drive.
The virtual disk and the simulation
engine are integrated into the host
operating system and they interact with
each
other
via
event-signaling
mechanism. Users
can have live
performance experience when using the
virtual platform. The benefits of this
virtual platform are twofold: First, the
virtual platform is useful to fast
prototyping and speeding up the
design-and-test cycles. Second, this
virtual platform can be useful to
researches focusing on cross-layer (i.e.,
between the host and the storage device)
performance optimization techniques.
Keywords:
solid-state
disk,
fast
prototyping, simulation
I.
INTRODUCTION
近年來行動電腦的儲存裝置由傳
統硬碟(Hard Disk Drive, HDD)逐漸被
以 快 閃 記 憶 體 為 基 礎 的 固 態 硬 碟
(solid-state disks, SSDs)所取代。由於
SSD 複雜的硬體架構以及韌體的演算
法,使得如何設計高效能的 SSD 成為
一項艱鉅的任務。廠商面臨一個實際
的問題,在不同的環境或用途下,要
如何組合硬體與韌體的設計才能達到
最佳的效能。目前有一些離線模擬的
工具[1][2][3][4]可以用來測試硬體與
韌體的組合。
由於現有的離線模擬工具不易使
用,使得 SSD 的研發和測試週期相當
耗時,因此廠商強烈要求降低修改和
測試週期的時間。另一方面,離線模
擬 工 具 有 個 問 題 是 從 HDDs 收 集
workload 的存取紀錄(trace file)時,I/O
request 的反應時間會受限於底層的儲
存設備,假若從一個 慢速設備收集
trace,那麼 I/O request 時間將會增加。
因此使用 HDDs 收集 trace 無法完全展
現真實 SSD 的 I/O 反應。
本研究提出一種線上 SSD 模擬環
境且提供一個快速的硬體-韌體之原型
工具為 SSD 設計之用,該模擬環境具
有簡單的 programming 介面並有豐富
的硬體/韌體設計的選擇。整體而言,
該模擬環境包括 sim-engine 與 virtual
drive 兩部分,sim-engine 計算 SSD 的
I/O 延遲,virtual drive 在主機端的作業
系統創建一個虛擬磁碟,設計者可以
透過一般的磁碟存取操作對此虛擬磁
碟進行讀寫,virtual drive 會將這些 I/O
request 送予 sim-engine, sim-engine
計 算 這 些 request 需 要 多 少 flash
Fig. 1 SSD Inter-chip architecture
Block 0 Block 1
0 2
0 1 2 3
: Invalid Data : Valid Data : Free Page
Fig. 2 Out-of-place updating data
operations 且 花 費 多 少 時 間 , 再 讓
virtual drive 模擬出這些 I/O 延遲。該
工具的目的在於降低除錯的成本,且
不需要冗長的 trial-and-error 週期就能
找出最佳的設計方案。
虛擬平台有幾項技術上的挑戰如
下: 第一,sim-engine 如何提供一個簡
單又具共通標準制定的 SSD 硬體/韌體
的抽象方法,讓設計者可以簡單地改
變 SSD 的設計。第二,虛擬平台如何
與作業系統結合互動才能實現虛擬磁
碟的功能。第三,sim-engine 如何準確
地計算 I/O 的延遲,virtual drive 如何
模擬這些 I/O 延遲。第四,如何利用有
限的 RAM 創建出一個很大的虛擬磁
碟。
II.
HARDWARE/FIRMWARE
ABSTRACTION
A.
SSD 硬體架構
Figure 3 為 SSD 的硬體架構。
Figure 4 (a)稱為"gang",所有通道由同
一條 chip enable line 連接,每個通道必
須做相同的讀/寫操作。若通道不是由
同一條 chip enable line 所連接,如
Figure 5 (b),每個通道可以獨立操作讀
/寫。"interleave"類似計算機架構中管
線的概念,同一通道中的 chips 可以做
不同的讀/寫命令,如 Figure 6 (c)。
在我們的虛擬平台中,我們使用
時序引擎(timing engine)來模擬平行的
硬體操作,當一個操作完成時會通知
其他的模擬模組,換句話說,平行的
硬體操作只會計算一次的時間。
B.
韌體演算法
快閃記憶體的最小寫入單位為一
個 page,且具有重複寫入相同 page 前,
必須要做 erase 的特性,而一個 erase
的單位為一個 block,基於效能的考量,
SSD 使用 out-of-place 的資料更新方式
(如 Figure 2),該方法須使用對照表
(mapping table)紀錄資料位址的資訊且
利用 garbage collection(gc)機制以回收
block。FTLs(Flash Translation Layer)負
責 SSDs 的 mapping 與 gc。
在我們的虛擬平台中,我們設計
了一套韌體演算法的 APIs,並定義了
FTLs 共 用 的 三 種 抽 象 化 元 素 , 如
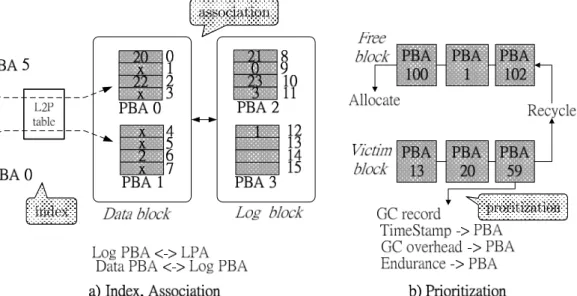
Figure 3。這裡說明了我們如何建立
FTLs 使用它們的行為之模型。
這是 NK[6] FTL,如 Figure 3(a)
所示,FTL 利用 Index 處理位址映射,
所以我們不只記錄邏輯位址區塊(LBA)
與實體區塊位址間(PBA)的關係,還要
記錄邏輯分頁位址(LPA)與實體分頁
位址間(PPA)的關係。Association 則用
來表示 FTLs 之資料集合間的關係,舉
例來說,多少個 data block 對映到 log
block。Figure 3(b)表示,在 GC 時是以
Prioritization 來選擇出犧牲者。
C. 硬體組態配置範例
我 們 訂 定 硬 體 環 境 : 4 independent
channel, 1 bank, 1 plane, 1 interleave
level。而 Flash Chip 的特性如下所示:
association
proritization
index
NUMBER OF GANG = 1; CHANNEL PER GANG = 4; CHIP PER CHANNEL = 1; PLANE PER CHIP = 1;
hwAPI->SetupFlashChip(Chip Character);
關於韌體的部分,如 Algorithm 1 所示,
韌體 API 可以做到: 1) 若寫入量小於 1
page 且此 page 之前已經寫過,則我們
執行 read modify write。2) 將此 page
寫到 log block 並透過 API 處理 GC 或
是取得新 log block。3) 修改 index,將
邏輯分頁位址與實體分頁位址綁在一
起。4) 將邏輯分頁位址與其 log block
記下來(association)。5) 若沒有 free
space 則執行 GC。
和真實 SDD 開發平台的 BAST
FTL 程式碼比較,用我們的韌體 API
可以減少超過 75%的程式碼行數。
III. 虛擬
虛擬
虛擬
虛擬磁碟
磁碟
磁碟
磁碟(virtual drive):線上模擬
線上模擬
線上模擬
線上模擬
我們提出一種線上模 擬的構想,如
Figure 4 所示。這是一個作業系統核心
模式下的虛擬磁碟,設計者可以建立
並控制一個虛擬磁碟如同一個真實硬
碟,不像使用者模式的檔案系統[8]只
處理使用者資料,在虛擬磁碟上,虛
擬平台會產生硬體/韌體結合的 I/O 延
遲,設計者可以在任何時間測試並使
用虛擬磁碟,用這個方法設計硬體/韌
體整合將更加直接且靈敏,可以減少
修改和測試的時間。
如 Figure 4 所示,這裡有一些議題: 1)
作業系統的相互影響 2) metadata 的識
別,以及 3) I/O 延遲的計算。我們將會
在以下的部分討論這些議題。
A.
Host 作業系統相互影響
之前提到,在我們虛擬平台上,我
們設計了硬體/韌體抽象化 API。為了
讓設計 SSDs 硬體/韌體變簡單,這個
硬體/韌體抽象化 API 必須保留在作業
系統的使用者模式中。
Fig. 10 Rules database of metadata conception Fig. 9 Sync event flow between kernel mode and user mode
所以我們必須將作業系統的核心
模式與使用者模式做同步化動作。如
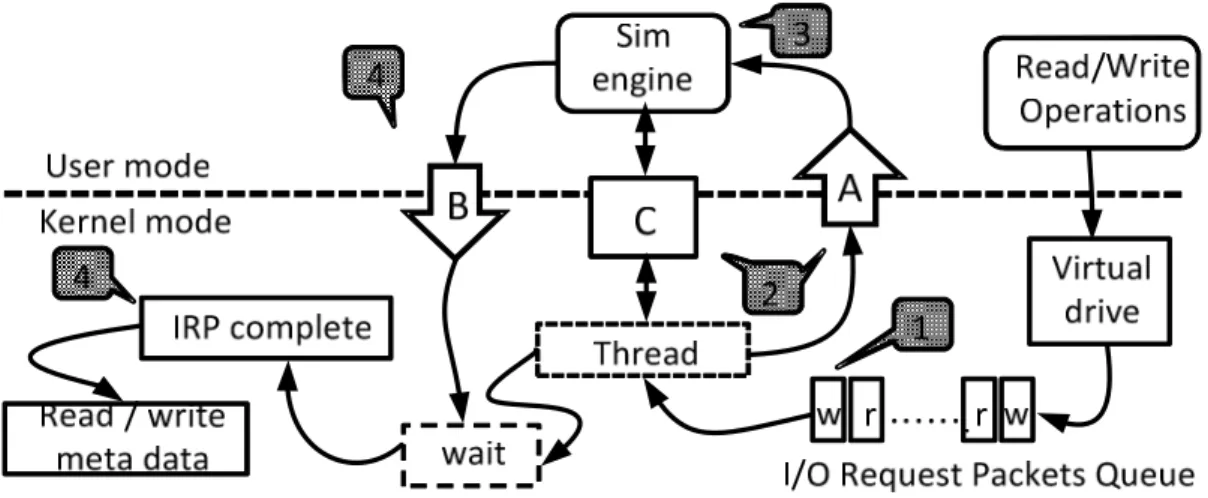
Figure 5 所示,有兩個共用物件 A 和 B
共用了記憶體 C,sim-engine 設成"wait"
狀態並且等待 A。接下來我們將會用
item 5-1 來解釋 Figure 5 中第一項
item。
虛擬磁碟將會接收從應用程式送
出的 I/O request packets(IRPs),並將它
們放在一個 Queue 中,如 item 5-1 所
示,接著用執行緒處理這個 Queue。在
使用者模式中,執行緒將模擬請求的
資 訊 給 C 並 且 設 置 A 來 通 知
sim-engine,如 item 5-2 所示,然後它
將會設置"wait"狀態。當 sim-engine 被
A 通知,如 item 5-3 所示,它將會啟動
並從 C 獲得資訊,並且開始模擬,我
們將會計算模擬所用去的時間以及作
業系統模式轉換的開銷,當模擬結束,
sim-engine 將會設置 B,如 item 5-4 所
示,而執行緒將會從記憶體 C 讀取延
遲資訊並產生虛擬 I/O 延遲及完成 IRP,
如 item 5-5 所 示 , 然 後 繼 續 處 理
metadata。我們將會在實際 SSD 平台
實驗中驗證模擬的 I/O 延遲正確性。關
於作業系統執行緒轉換的開銷,我們
將在第 IV.章節中解釋。
另一方面,sim-engine 也許會實施
排程機制,out-of-order 完成請求。
B.
Metadata 之辨識
為了利用大小有限的 RAM 去模擬
一個大容量的 SSD,我們提出了一種
定義 metadata 的構想。
Metadata 即為用來詮釋資料的一
種資料,又可以稱為 資料的索引,
metadata 只佔所有 data 的一小部分。
Disk 中即使只存 metadata ,檔案系統
也 可 以 正 常 運 作 , 並 且 讓 disk
benchmark tools 不要去驗證寫到 disk
上的 data,因此 benchmark tools 可以
正常運作在只存有檔案系統 metadata
的虛擬磁碟上。
舉例來說,當我們格式化一個
250GB 的硬碟成 NTFS 的磁區 ,則
這 個 硬 碟 上 的 metadata 只 佔 了
74.46MB 的硬碟空間,因此我們藉由
metadata 之識別方法來降低 SSD 虛擬
平台對 RAM 的使用量。Sivathanu[7]
提出一個方法去定義"live data",但這
個方法專注在資料內容的定義,而非
metadata。
要定義 metadata,不同檔案系統有
不同的架構,所以我們實作一套"rules
database" 在 我 們 的 虛 擬 磁 碟 中 , 如
Figure 6 所示,該"rules database"包含
許多的不同檔案系統 metadata 定義規
則,藉由這個資料庫,我們可以找到
並儲存 metadata 到不同的檔案系統上。
我們將會在接下來的章節中,來討論
NTFS 與 ext2 中定義 metadata 的方
法。
在 NTFS 檔案系統的環境中,最
主要的 metadata 都存在 MFT(Master
Files table)中。首先,在 disk 的開機磁
區中,我們可以知道 MFT 存放的位置,
幸運地,每個 MFT 的項目為一筆紀錄
的開頭,我們可以透過解析虛擬磁碟
上的資料內容來定義這些紀錄,因此
我們可以儲存這些紀錄來維持 NTFS
的正常運作,如 Figure 6 所示。
之前的研究[9]中只有辨識 EXT2
檔案系統上固定位置的 metadata,所以
無法辨認出 EXT2 中 block group 的
"directory i-node",因為 EXT2 的目
錄不是存在固定的位置。我們的 EXT2
metadata 定義方式可以辨認出 EXT2
的目錄,如 Figure 6 所示。首先,我們
可以解析 i-node 資料內容,接著比較
i-node 上的 i-node number 與 bitmap,
若 i-node 為一個目錄型的 i-node,則儲
存該 metadata 到記憶體中。
IV. I/O 延遲
延遲
延遲
延遲之
之
之
之模擬
模擬
模擬
模擬
虛擬平台有兩個 I/O 延遲模擬的
問題:硬體的時間花費,與作業系統
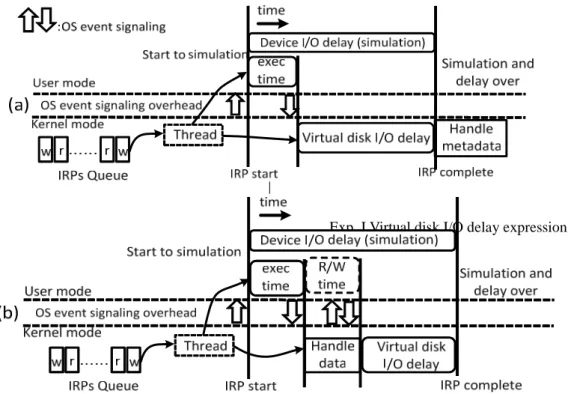
的時間消耗。I/O 延遲模擬有兩個模式:
一種是只儲存 metadata,另一種則是儲
存 metadata 與實際資料。如果我們不
考 慮 作 業 系 統 花 費 的 時 間 , 則 當
sim-engine 產生一個裝置 I/O 延遲,減
去模擬器執行的時間,與 kernel mode
的延遲時間,則為在虛擬磁碟上的 I/O
延遲,如圖 7(a)所示。虛擬平台可以儲
存實際的資料,如圖 7(b)所示,裝置
I/O 延遲必須扣除 sim-engine 執行時間
與處理資料時間。因磁碟的搜尋時間
會破壞虛擬 I/O 的延遲準確度,我們可
以用 ram disk 來解決。
由於虛擬平台使用事件訊號去同
步 sim-engine 與 virtual drive,所以會
產生一些 kernel mode 與 user mode 訊
號傳遞的 overhead。另一方面,user
mode 的 process 會被排程,排程器將
觸發 user process 的 context switch,也
會影響虛擬平台模擬的準確度。
為了最小化作業系統模式 switch
的時間消耗與使用者程序的 context
Exp. I Virtual disk I/O delay expression
switch,我們使用一些方法去解決這
個 問 題 。 首 先 , 我 們 得 到 處 理 器
(processor)的時間戳記(TSC)去計算用
來發送事件訊號的 CPU cycle time,換
句話說,我們使用一個時間校準階段
去計算事件訊號的時間消耗。第二,
我們加入的虛擬平台 I/O 延遲是在作
業系統核心模式,去避免使用者程序
的競爭。第三,我們讓 sim-engine 執
行在高優先權下,避免虛擬平台被系
統的 context switch 所影響。
在計算虛擬 I/O 延遲上符號的意
義與方法,如 TABLE I 所示。
與
皆由 TSC 計算出來的
,
為 多 通 道 架 構 環 境 下 處 理
request 所花的時間。
V. 實驗結果
實驗結果
實驗結果
實驗結果
在這一節,我們有兩個實驗部分。
第一個是驗證虛擬平台的準確性,我
們會與真正的 SSD(GP5086)平台來跟
虛擬平台的模擬結果比較。第二個是
在實際 workload 之操作下,虛擬平台
展現的硬體/韌體搭配之下的效能。
我們使用業界最常使用的磁碟效
能評比工具:IOmeter、ATTO 來驗證
我 們 的 虛 擬 平 台 與 真 實 的 SSD
(GP5086),並且在虛擬平台安裝 Office
軟體,來測試兩種不同的硬體/韌體組
合下的效能差異。
我們已經依照「硬體組態配置範
例」章節中,將虛擬平台設定為跟真
實平台(GP5086)相同的硬/韌體架構。
如同 TABLE II 所示,我們可以觀察到
虛擬平台的 I/O 延遲誤差低於百分之
五,其誤差的原因來自快閃記憶體晶
片的寫入/抹除時間會隨著溫度及電壓
的變化而改變。為了要測試我們處理
事件通知的時間消耗以及使用者程序
間的行程切換的方法 ,我們使用了
FFT-z 這套工具來增進 CPU 使用率,
測試我們的虛擬平台在 CPU 高壓力下
的效能,如同 TABLE III 所示。因為
行程切換的開銷影響不大,並且 I/O 延
遲是在作業系統核心模式,故可以降
TABLE I: I/O delay symbol table
TABLE II: Compare a real SSD (GP5086) results with our virtual platform
低使用者程序排程造成的影響,我們
的虛擬平台在高度壓力的環境下可以
維持虛擬 I/O 延遲的準確性。
為了要比較在兩種不同 SSD 設計
下安裝 Office 的效能,我們設定了以
下硬體配置組態:32GB 容量,256MB
備用空間。首先來看 Figure 8 所示的兩
種不同設計的硬體架構。我們定義了
Flash 晶片數量為八個,並且將通道數
量設定為 2 及 4。我們可以發現如果通
道數量越多,資料處理可以愈平行地
進行,因此在 GC 時有較低的回應時間;
但愈多的通道將會分割備用空間,其
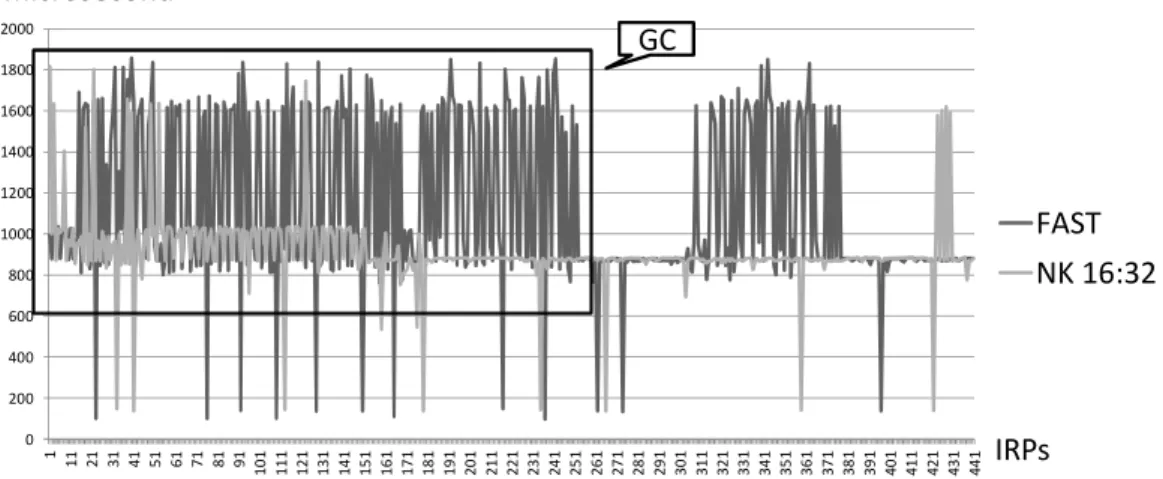
將導致頻繁的 GC。接著我們比較兩種
不同的韌體設計:NK 16:32 以及 FAST,
如 Figure 9 所示。FAST 不會限制 log
block 的關聯度,因此在 GC 的時候,
FAST 的回應時間會高於 NK,這意味
著在這段時間,FAST 將會使 SSD 產
生較明顯之延遲現象。
VI. 結論
結論
結論
結論
Fig. 13 Installing Office using two different FTL algorithms (firmware) Fig. 12 Installing Office using two different channel architectures of SSDs (hardware)
0 500 1000 1500 2000 2500 3000 3500 4000 1 17 33 49 65 81 97 1 1 3 1 2 9 1 4 5 1 6 1 1 7 7 1 9 3 2 0 9 2 2 5 2 4 1 2 5 7 2 7 3 2 8 9 3 0 5 3 2 1 3 3 7 3 5 3 3 6 9 3 8 5 4 0 1 4 1 7 4 3 3 4 4 9 4 6 5 4 8 1 4 9 7 5 1 3 5 2 9 5 4 5 5 6 1 5 7 7 5 9 3 6 0 9 6 2 5 6 4 1 6 5 7 6 7 3 6 8 9 7 0 5
2ch 4chip
4ch 2chip
IRPs
microsecond
GC
0 200 400 600 800 1000 1200 1400 1600 1800 2000 1 11 21 31 41 51 61 71 81 91 1 0 1 1 1 1 1 2 1 1 3 1 1 4 1 1 5 1 1 6 1 1 7 1 1 8 1 1 9 1 2 0 1 2 1 1 2 2 1 2 3 1 2 4 1 2 5 1 2 6 1 2 7 1 2 8 1 2 9 1 3 0 1 3 1 1 3 2 1 3 3 1 3 4 1 3 5 1 3 6 1 3 7 1 3 8 1 3 9 1 4 0 1 4 1 1 4 2 1 4 3 1 4 4 1FAST
NK 16:32
IRPs
GC
microsecond
TABLE III: Experiments with/without CPU stress
本 研 究 提 出 一 個 針 對 固 態 硬 碟
(SSD)的虛擬平台,並且在 user mode
中設計了一個抽象化的硬體/韌體介面
以方便設計 SSD。這個虛擬平台可以
做快速的"測試並修改"設計循環並於
線上模擬。該虛擬平 台可以只儲存
metadata,並在有限的記憶體下,建立
大容量的 SSD。在實驗中,我們驗證
了時間準確性之誤差相較於真實產品
是低於百分之五。此外,我們也比較
了兩種不同 SSD 的硬體/韌體設計來安
裝 Office 的效能。
[1]. N. Agrawal, V. Prabhakaran, T. Wobber, J.D. Davis, M. Manasse, and R. Panigrahy. Design tradeoffs for SSD performance. In
USENIX 2008 Annual Technical Conference on Annual Technical Conference, pages 57–70. USENIX Association, 2008.
[2]. J.S. Bucy, J. Schindler, S.W. Schlosser, G.R. Ganger, et al. The DiskSim simulation environment version 4.0 reference manual. Technical report, Technical report cmu-pdl-08-101, carnegie mellon university, 2008.
[3]. Youngjae Kim, Brendan Tauras, Aayush Gupta, and Bhuvan Urgaonkar. Flashsim: A simulator for nand flash-based solid-state drives. In Proceedings of the
2009 First International Conference on Advances in System Simulation, pages
125–131, Washington, DC, USA, 2009. IEEE Computer Society.
[4]. Jongmin Lee, Eujoon Byun, Hanmook Park, Jongmoo Choi, Donghee Lee, and Sam H. Noh. Cps-sim: configurable and accurate clock precision solid state drive simulator. In SAC’09, pages 318–325, 2009.
[5]. Sang-Won Lee, Dong-Joo Park, Tae-Sun Chung, Dong-Ho Lee, Sangwon Park, and Ha-Joo Song. A log buffer-based flash translation layer using fully-associative sector translation. ACM Trans. Embed.
Comput. Syst.,
[6]. Chanik Park, Wonmoon Cheon, Jeonguk Kang, Kangho Roh, Wonhee Cho, and Jin-Soo Kim. A reconfigurable ftl (flash translation layer) architecture for nand
flash-based applications. ACM Trans.
Embed. Comput. Syst., 7:38:1–38:23,
August 2008.
[7]. Muthian Sivathanu, Lakshmi N. Bairavasundaram, Andrea C. Arpaci-Dusseau, and Remzi H. Arpaci-Dusseau. Life or death at block-level. In Proceedings of the 6th
conference on Symposium on Opearting Systems Design & Implementation - Volume 6, pages 26–26, Berkeley, CA,
USA, 2004. USENIX Association.
[8]. Jun Wang, Rui Min, Yingwu Zhu, and Yiming Hu. Ucfs-a novel userspace, high performance, customized file system for web proxy servers. IEEE Trans. Comput., 51:1056–1073, September 2002.
[9]. Po-Liang Wu, Yuan-Hao Chang, and Tei-Wei Kuo. A file-system-aware ftl design for flash-memory storage systems. In Design, Automation Test in Europe
Conference Exhibition, 2009. DATE ’09.,
pages 393 –398, april 2009.
附件(已發表之會議論文):
1. Ming-Yi Yang, Li-Pin Chang, and Ya-Shu Chen, "Workload-Oriented Benchmarks for Solid-State Disks," International Workshop on Software Support for Portable Storage (IWSSPS), 2009.
2. Chun-Chieh Kuo, Jen-Wei Hsieh, and Li-Pin Chang, "Detecting Solid-State Disk Geometry for Write Pattern Optimization," The International Workshop on Cyber-Physical Systems, Networks, and Applications (CPSNA), 2011
Workload-Oriented Benchmarks for Solid-State Disks
Ming-Yi Yang
Department of Computer Science National Chiao-Tung University
Hsin-Chu, Taiwan
Li-Pin Chang
Department of Computer Science National Chiao-Tung University
Hsin-Chu, Taiwan
[email protected]
Ya-Shu Chen
Department of Electrical Engineering National Taiwan University of
Science and Technology
[email protected]
Abstract
A solid-state drive (SSD) uses flash memory as storage media. In the recent years, due to the SSD’s ability to conserve power, and to endure shock and vibration, as well as its random access capability, it has started to take the place of the traditional hard drive. However, users’ experiences usually do not match the performance claimed by the manufacturers for the SSD. The main reason for this is that most tools used to evaluate the performance of the SSD are the same as those used to test traditional hard drives. The performance cost of the internal management mechanism in SSD is not taken into account by the test methods, so that the apparent results do not represent the true performance of the SSD. This paper proposes a method to test the management efficiency of the SSD based on the disk workload of a real system. The proposed method is able to differentiate the access patterns of an SSD, categorize real workloads into four sets of benchmark suites, and then identify SSD performance bottlenecks.
Categories and Subject Descriptors
D.4.2 [Operating Systems]: Garbage collection; B.3.2 [Memory Structures]: Mass Storage.
General Terms
Design, Performance.
Keywords
Solid-State Disks, Flash Memory, Benchmark.
1. Introduction
NAND flash memory is known for its small dimension, ability to endure vibration and conserve power, and its fast random access capability. SSDs composed of NAND flash memory are already commonly used in personal computers. Unlike traditional hard drives, managing data in SSD is subject to physical constraints of NAND flash memory, such as uneven physical units of read/write and erase, address translation, free-space reclaiming and wear leveling. SSDs use a flash translation layer to simulation block device interface and to hide NAND flash memory’s physical characteristics. Manufacturers implement different management strategies in the hardware controller to process SSD management issues and handle performance problems caused by large amounts of data reading/writing.
Apart from the hardware specification, the performance of the SSD is also affected by the management algorithm in the SSD firmware. The test results delivered by such tools do not help users to make a fair evaluation of the SSD. Most current hard drive benchmark tools target traditional mechanical hard drives. They focus on seek, rotate, data transfer and time overhead, which are absent from the management issues of NAND flash memory.
So far, only a few papers have discussed the performance of the SSD and test methods. [1] studied the effects of a variety of design methods on the SSD performance, using by software simulation. However, the test was not conducted on a real product. [2] developed a tool to test SSD resource access patterns, but empirical test results were not reported. [3] defined a complete set of SSD performance evaluation methods including pre-test configuration, post-test configuration and a battery of access pattern tests. The focus of that work was the methodology of performance evaluation, but it failed to identify the reasons for the low performance of SSD management strategies.
The two problems with current test methods are: firstly, the performance metrics of traditional hard drives cannot identify the reasons that cause the SSD performance differential; secondly, tested access patterns do not cover the access patterns actually used by customers. To respond to these difficulties, we propose a new performance metric, Per-Byte-Response. The metric represents the response time of every kilobyte in a single read/write request. The metric emphasizes the overheads imposed by the SSD management activities on each individual request, neglecting the data transfer time. We analyze the spatial distribution and access time distribution of the data’s Per-Byte-Response, summarize the typical symptoms of poor resource management, and provide the user with an account of the causes of poor performance. Secondly, we gather the user’s real access patterns as a test workload, and conduct an analysis of the characteristic access patterns for different types of workloads. These workloads are categorized into four benchmark suites, which provide users with evaluations of transfer speed, address translation, free-space reclaiming and buffer management. The user can choose a suitable Benchmark suite for the specific SSD or SSD management issue which needs to be addressed, obtain performance metrics and find out what factors are adversely affecting performance.
2. SSD Management
The overall performance of the SSD depends on the hardware architecture and the data management schemes. The hardware architecture includes parallel transmission architecture (Multi-channel or Inter-leaving), controller, types of NAND flash memory, and buffer configurations.
Currently, there are two types of NAND flash memory, SLC and MLC. In order to increase the capacity of the device, many SSDs use MLC as the storage media. However, MLC has a longer read/write time than SLC. Therefore, MLC use has a significant impact on the performance and lifetime of the device.
To improve read/write performance, SSD employs additional RAM as write buffer or read cache. The current SSD buffer management can be categorized into: (1) traditional management schemes, such as FIFO, LRU; (2) new management schemes designed for NAND flash physical characteristics, such as FAB, BPLRU[4]. The former only utilizes the hardware advantage of RAM to shorten access time, while the latter optimize the management scheme costs as well.
The major management issues of the SSD are: address mapping, free-space reclaiming and wear leveling. As the unit of SSD read and write is a page, while the unit of erase is a block, it is necessary to use out-place updates to avoid frequent erasure operations. An address mapping mechanism is needed to translate logical addresses into physical addresses. Most of the current address mapping mechanisms divide the blocks into data blocks and log blocks. All the original data is stored in the data blocks. When each data update arrives, log blocks are used to hold the updated data. It is a design option that how data blocks are associated with log blocks. When a lot of free-space reclaiming actions are taken by a small amount of data written, we can conclude that the address mapping mechanism is not working well, and action needs to be taken [5].
When there is insufficient free-space for data writes, the SSD needs to reclaim free-space by erasing invalid data. However, the minimum unit that can be erased is a block. Garbage collection will trigger a sequence of data moves and erases. The time cost of garbage collection is the major management cost. Generally speaking, garbage collection should be postponed as late as possible, and should erase the block with most invalid pages. When the cold data (rarely updated data) and hot data (frequently updated) are mixed in the same block, the efficiency of garbage collection will be significantly impaired. It is therefore better, where possible, to store hot and cold data in different blocks.
3. Performance Evaluation using Real
Workloads
The SSD performance benchmarking proposed in this paper takes the form of a black-box test to evaluate external response time performance. The advantages of this method are easy test environment setup and simple parameters. The disadvantage is the difficulty in diagnosing the reasons for poor performance in a single test. This section will introduce the system configuration of the SSD benchmarking, performance metrics and typical symptoms of suboptimal management strategies.
Our SSD benchmarking method is composed of two steps. The first step is Trace-Collect. It operates in the driver layer of the file system, collecting users’ access patterns to hard drives. The second step is called Trace-Replay. It is mainly used to reproduce the data access activities on the SSD that is going to be tested. Because only write requests involve SSD management activities, the benchmarking method proposed in this paper only concerns write requests in the collected traces.
To focus on the impact of the SSD management strategies on performance, we propose the Per-Byte-Response (PBR) as a performance metric to eliminate the time overheads contributed by data transfer. For each SSD write request, the PBR is defined by the following formula:
Response time (in seconds) / Request size (in bytes).
Under optimal management scheme conditions, the management overheads in SSD are kept as low as possible, and no PBRs of requests are noticeably large. However, with suboptimal management schemes, it is possible that a small request introduces lengthy management activities, suddenly increasing its PBR. . General users can not easily identify performance bottleneck of various SSD devices by observing PBR only. To assist users to diagnose the problem, it is necessary to analyze PBR results exhibited by typical symptoms of suboptimal management strategies.
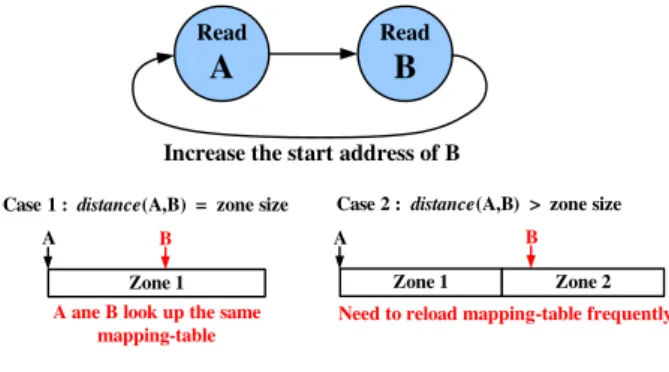
To observe the time and spatial distribution of the PBR values, we used a 3D visualization method, where the X axis represents data reference numbers, the Y axis represents the original logical address and the Z axis represents the PBR value.As shown in Figure (1), there is a significant difference between PBR values. The Figure shows how the data is buffered to improve the performance before the data is written in SSD. When there is free space in the write buffer, the extremely low PBR values represent the time cost of writing data to RAM. When the write buffer is full, data will be written to the SSD, which results in a series of management activities and a significant increase in the PBR value. However, this buffer management scheme is not optimized for the flash translation layer, instead of delivering stable PBR values, the PBR values changes severely. This phenomenon is defined as “suboptimal write buffer management”.
As shown in Figure (2), when the PBR values increase dramatically and are randomly distributed over a large range of logical addresses, garbage collection is triggered at a high frequency, even through the total amount of data written is low. The reason is that the suboptimal address mapping scheme results in low utilization rate of the SSD space (i.e., log-blcok threshing). This phenomenon is defined as “suboptimal address mapping”.
In Figure (3), the PBR values increase dramatically but only appear densely in a small area and in a short time. This means that certain data a updated frequently, triggering garbage collection. There are two reasons for this phenomenon: (1) extremely high PBR values representing large data relocation cost during garbage collection. (2) high incidence of PBR values, indicating a problematic garbage collection strategy, such as premature garbage collection or improper selection of recycling victims. This phenomenon is defined as “suboptimal garbage collection scheme”.
4. Workload Characterization and
Benchmark Suites
In this section, we will discuss how to conduct temporal and spatial analysis on the collected workloads, list important characteristics, analyze the relationship between these characteristics and SSD management schemes, and categorize
Figure (1) Suboptimal write buffer management
Figure (2) Suboptimal
these workloads into suites of evaluating transfer speed, address mapping, garbage collection and buffer management.
To completely reproduce the data access activities on the SSD to be tested, three parameters need to be recorded for each data item during the trace-collect stage: data write sequence, start address and length of transfer. Each data item is either a write or a rewrite. When the data is written into blank regions, it is known as a write. When the data is written into regions that contain addresses have already been written to, it is called a rewrite. Workloads with large amounts of rewrite requests have high time locality and space locality of data read and write.
According to the start address of each data item, we can further categorize the data into two types: sequential data and random access data. As modern operating systems support multi-tasking environment, sequential data writes or rewrites can be interrupted by write requests from other processes. We determine the sequence of read/write actions by assigning an error value K . Then, the data is defined as sequential data if the write address of
the Nth data item and the start address of the N+Kth data item are
contiguous, where N is an integer. If the data is non-sequential, it is deemed to be random access data. A workload with a high percentage of sequential data has high space availability, which means that it is easy to gather large amounts of invalid data space during garbage collection.
Most data write requests of the file system are for small writes, falling into the size range of 4KB. So request with transfers length smaller than 4KB are treated as small writes.
If a write request’s starting address is unable to align with the page boundary of NAND flash-memory pages, then writing a page may require extra overheads of read-modify-write operations. This concerns the performance of the address mapping scheme. To account this, we record whether the data’s start address and end address are aligned to the 4KB boundary in sector addresses, and further analyze the ratio of aligned data to the entire dataset.
According to the parameters collected in the trace-collect stage, we directly analyze the rewrite ratio, sequential ratio, alignment ratio and transfer length statistics. This analysis is called macroscopic analysis. For small-scale workloads with simple behaviors, these four characteristics can be categorized and used to test the performance of the SSD management schemes. However, for large-scale workloads with complex behaviors further parameter calculations are required.
Microscopic analysis focuses on the time distribution and space distribution of the access pattern, and understands the formation of its characteristics. To analyze the spatial locality of an access pattern, we derive the traditional performance metric “Seek Distance” to calculate the distance between the end address of the current data item and the state address of the next data item. Even though SSD does not suffer from the cost of the read/write head movements, this metric represents the randomness of the data access. If the variation of seek distances is very large, then the access pattern exhibits random access. This can be used to test the performance of the address mapping scheme.
The temporal locality of an access pattern represents the data rewrite frequency. There are two kinds of data, hot data and cold data, where the temperature of a piece of data is proportional to the frequency that the data is updated. However, for large-scale workloads, hot data are accessed by bursts of variable lengths.
Therefore, the time window of accessing hot data must be considered. We define life span and life cycle as follows:
Definition 1:Life Span
Let X be some Logical Sector Address (LSA). Let FIRST_ACCESS(X) represent the request sequence number when X is written for the first time; let LAST_ACCESS(X) represent the request sequence number when X is written for the last time. Life span is defined as:
Life_Span(X) = LAST_ACCESS(X)-FIRST_ACCESS(X).
Definition 2:Life Cycle
Assume Write_Count(X) represents the number of times a LSA address, X, was written. Then
Life_Cycle(X) = Life_Span(x) / Write_Count(x). If Life_Cycle(X)=0, no rewrite has occurred in this address.
Using the life span and life cycle definitions, we are able to observe hotness/coldness differences in the logical address space and understand the mixing level of the hot data and cold data. When the cold data and hot data are separated correctly, the data relocation cost during garbage collection can be reduced significantly. The cold/hot data distribution can be used to test the performance of the garbage collection.
After profiling workloads using the above mentioned indexes, workloads can be match to four benchmark suits, Transfer, Buffer, Mapping and Garbage Collection. The transfer suite is used to evaluate hardware transfer cost. The other three suites are used to evaluate the performance cost of the SSD management schemes. The data mainly composed of sequential write requests can be used in the hardware transfer architecture. Because sequential write requests are less likely to introduce extra copy operations during free-space reclaiming, workloads with a large number of sequential writes are classified as Transfer Suite. When the rewrite ratio of the workload is high and the transfer amount is larger than the write buffer capacity, the write-back mechanism will be triggered. Therefore, workloads with a high rewrite ratio and a large data amount are classified as Buffer Suite. When the rewrite activities of the workloads are random and consist of small writes, or there is unaligned write activity, the space usage rate is low. Therefore, workloads with random data and low alignment ratio are classified as Mapping Suite. When the workload has intensive rewrite activities and the cold and hot data are highly mixed, the garbage collection will be triggered, and such workloads are classified as Garbage Collection Suite. In the next section, workload testing will be described. The characteristics will be analyzed and assigned to appropriate benchmarking suites for SSD performance testing.
5. Experimental Results
5.1 Environment Setup
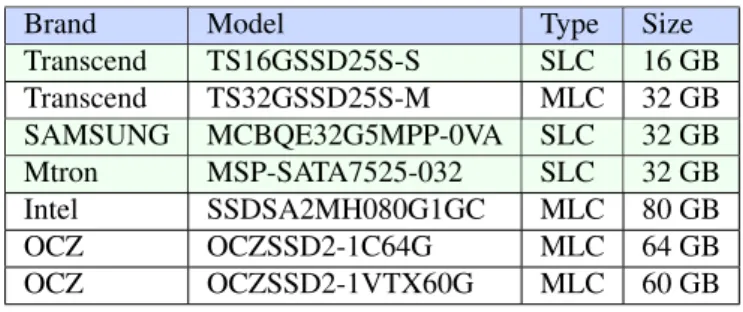
This section introduces the experiment environment setup, SSD to be tested and collected workloads. The experiment platform is built on a personal computer equipped with Intel Core 2 Dual 1.87GHz,2GB DDR2 memory, and the Windows XP operating system. A total of five SSD devices are tested. In order of price, MTRON and Samsung are high-end products with extra RAM available for write buffering. OCZ is a mid-price product, and TRANSCEND is a low-end product. The device specifications are shown in Table (1).
We collected user file access patterns from personal computers. User applications are of four types: general application, internet application, operating system installation, and P2P application. The access pattern of each user scenario is given in the table (2).
The first stage, trace-collection, was conducted with Windows XP, using the Diskmon trace tool [6] to collect access patterns and store them in a 16GB independent NTFS hard drive. The second stage, trace-replay, was implemented by using the functions CreateFile() and WriteFile() in the Windows API. Firstly, we used CreateFile() to open the SSD in the device driver mode. Secondly, we used WriteFile() to execute synchronous write activities. Time data from the CPU clock cycle was read by the assembly language function RDTSC().
5.2 Benchmark Suites
To conduct categorization of the workload benchmarking and management mechanism evaluation, a macroscopic analysis was first applied to the four collected workloads that are rewrite ratio, sequential ratio, data length and alignment ratio. The value of each application and its ratio to the overall data transfer rate is given in Table (3). For example, if the update data amount is
100MB and the overall data transferred is 200MB, the rewrite ratio is 50%. The error of the sequential activity is set to 10, which
means if the logical addresses of the Nth write and N+10th write
are contiguous, the action is considered a sequential write. Copy has a low rewrite ratio, and the write request is 64KB sequential write, which can be categorized in the Transfer suite for hardware transfer speed test. Browser has a high rewrite ratio: these are most likely small writes with random access, which can be categorized to the Garbage Collection Suite or to the Mapping Suite. eMule and Install Linux are large-scale workloads. The metric intensities of macroscopic analysis are not very clear, therefore, we also use microscopic analysis to find out the characteristics of eMule and Install Linux, as well as the hot/cold data distribution of Browser.
Figure (4)-(a)(b) are the Browser data logical address distribution and hot/cold data distribution graph. The X axis in Fig. 4 (a) is the data sequence, and the Y axis is the logical sector address. As can be seen from the graph, the random access of the Browser is small
and intense. This is because the browser temporarily stores website data on the hard drive to increase the website browsing speed. These temporary files are managed by Index.dat, which is frequently updated. The hot/cold data distribution is interpreted in the Life Cycle analysis. In Fig. 4 (b), the X axis is the logical sector address, and the Y axis is the life cycle (calculated by the definition 2 given in Section 4). As shown in the graph, the hot/cold data are highly mixed. The difference is not clear and hard to identify. Due to the intensity of the hot/cold data mix, we finally categorize Browser to the GC suite.
In the macroscopic analysis, the sequential ratio of Install
Linux is only 20%. As shown in the LSA distribution graph, Figure (5)(a), its random access is scattered over a wide area. The access addresses are mostly located in group headers –group headers are where the metadata is stored in EXT2/EXT3 file systems. In EXT2/3 default settings, reading data also causes write actions to update the a-time in inode, which causes random writes to be much more common than sequential write. Figure (5)(b) shows the Seek Distance distribution for Install Linux. The X axis is the LSA, and the Y axis is the seek distance. As shown in the figure, the write action of Install Linux is scattered over a large area. Therefore, we categorize Install Linux to the mapping suite to test the address mapping s performance of the SSD.
eMule is a popular P2P download software. Its principle is to cut files into several chunks and download multiple chunks simultaneously. A chunk is the minimum download unit, with size 9.28MB and buffer capacity of 128 KB. According to our macroscopic analysis results, 55% of rewrites are sequential and the data length is typically around 512KB. As shown in Figure (6)(a), the first half of eMule is a sequential write, which is caused by the data buffering before downloading each file; the second file is the random write of the chunk download. When a chunk starts to be downloaded, random access will be limited in the addresses of the corresponding chunk. Therefore, every chuck should have
Table (1) SSD device specifications
Manufacturer Interface Memory Unit Capacity Controller
MTRON SATAII SLC 32GB MTRON
Samsung SATAII SLC 32GB Samsung
TRANSCEND SATAII SLC 16GB SMI
TRANSCEND SATAII MLC 32GB SMI
OCZ SATAII MLC 64GB JMICRON
(a) Logical address Distribution (b) Life Cycle Distribution
Figure (4) Characteristics of the Browser workload Table (2) Workload of user scenarios
Workload Scenarios Copy Copy 200 files from one directory to another
Browser Use Internet Explorer 5.0 to browse internet for 3 hours
Install Linux
Install Fedora Linux Server 4,the file system is EXT3 eMule Use eMule 0.48b to download 3 files for 3 hours
Table (3) Workload Macroscopic Analysis Results
Workload Data Transfer Rewrites Ratio Sequ-ential Ratio Data Length Alig-nment Ratio Copy 816MB 0.1% 96% 64KB 0% Browser 477MB 80% 4% 4KB 31% Install Linux 2387MB 18% 25% 4KB, 128KB 0% eMule 9437MB 5% 55% 4KB, 512KB 0%
high time locality and space locality. As shown in Figure 6(b), we focused the logic sector address inside a chunk, however, we found the seek distance was large and random. It is suspected that this is because multiple chunks are downloaded simultaneously. When we introduced the life cycle concept, we found the time locality and space locality were indeed concentrated on a small area. The pseudo randomness in a large area created by multiple chunk download may instantly consume the buffer set by eMule and cause frequent rewrites. Therefore, we categorize eMule to the Buffer Suite to test the write buffer management, as well as to determine whether the buffer management mechanism can handle downloading multiple chunks.
Based on the macroscopic and microscopic analysis results, we conclude that the real workload and benchmark suite pairs as follows: Copy was matched to Transfer Suite, Browser is tied to GC Suite, Install Linux is categorized to Mapping Suite, and eMule is classified to the Buffer Suite.
5.3 Benchmark Results
SSD benchmarking is composed of two parts. In Part I, traditional sequential and random pattern test results are used. In Part II, real workloads from the benchmark suites are used to test the SSD. Finally, the impact on SSD management performance is discussed by comparing results obtain in both parts.
(a) Sequential Write (b) Random Write
Figure (7) IOMeter Sequential and Random Write Test :X axis is data length, Y axis is transfer speed in MB/sec
In Part I, the selected SSD devices are tested by the IOMeter sequential and random write patterns. In Figure (7)(a), MTRON has a faster transfer speed than any other competitors. Figure(7)(b) shows that SSD composed of SLC chipset outperform SSD composed of MLC chipset, which also indicates the performance gap of physical characteristics of SLC and MLC. Also, as shown in Figure (7)(b), MTRON and Samsung perform better than Transcend because of the extra write buffer. In addition, MTRON’s performance is slightly better than that of Samsung, which shows that the write buffer of MTRON effectively handles the small writes. Given the results, we can conclude that using SLC chipset and extra write buffer will improve the overall performance of SSD.
IOMeter test results match with the product price range. MTRON has the best performance, while Transcend with MLC chipset comes last. Next, we use the benchmark suite to test these devices and use the proposed performance metric Per-Byte-Response (PBR), which is the ratio of response time to data transferred. The experiment results are shown in 3D graphs with X axis representing data sequence, Y axis representing LSA, and Z axis representing PBR. The higher the PBR values are, the higher the management cost is.
Figure (8) shows the Transfer Suite test results of MRTON and Samsung. Both the performance and the readings match the IOMeter test results. Next, we test the performance of the SSD management mechanism of each device. In Figure (9), we demonstrate the results of MTRON and Samsung by using eMule in the Buffer Suite. We found that the PBR values of MTRON fluctuate considerably. This is probably because the write buffer does not integrate with FTL (File Transfer Layer) design, and is not able to reduce the management cost effectively. The frequent rewrites caused by downloading chunks in eMule triggers address mapping or garbage collection, which reduces performance. According to the Samsung PBR values, the buffer management mechanism effectively reduced the management cost, which indicates its management method integrates with the FTL design.
(a) MTRON: 22.95MB/sec
(b) Samsung: 18MB/sec (c) Transcend SLC: 4.47MB/sec
Figure (8) Transfer Suite Test Results
(a) Samsung:18MB/s (b) MTRON:8MB/sec
Figure (9) Buffer Suite Test Result
(a) LSA Distribution (b) Seek Distance Distribution
Figure (5) Characteristics of the Install Linux workload
(a) LSA Distribution (b) Seek Distance Distribution
Figure (6) Characteristics of the eMule workload
Chunk Group
Headers
Sequential Write 512KB
Figure (10) illustrates the results of the Mapping Suite test on MTRON, Transcend SLC and OCZ MLC by using the Install Linux workload. The results show lack of effective handling on the random rewrites caused by Install Linux. However, the overall performance differs from one device to another depending on whether write buffering is available. MTRON is significantly better than Transcend SLC. Significantly, OCZ MLC outperforms Transcend SLC, even though Transcend SLC has better hardware performance. As shown in Figure (10)(b), OZC has a much lower address mapping cost than Transcend SLC. It is clear that current SSD address mapping mechanisms are not suitable for the Install Linux workload. The reason is that EXT2/EXT3 headers will generate random rewrites over a large LSA area, causing a low space usage problem.
Figure (11) demonstrates the GC Suite test results on Transcend SLC and OCZ by using the Browser workload. The results show the PBR values of Transcend SLD scattered in a large LSA area with high intensities, which indicates that the garbage collection is triggered frequently and the garbage collection mechanism cannot handle the highly mixed hot/cold data and high rewrite ratio associated with this workload. OCZ also has high PBR readings, but the high readings are located at a few LSA, which represents low garbage collection frequency and high garbage collection cost.
According to IOMeter test results, the performance ranking of sequential write is MTRON->Samsung->OCZ->Transcend SLC; while the random access write ranking is MTRON->Samsung->Transcend SLC->OCZ. However, Benchmark Suite test results show that the performance of the SSD is related to the specific workload performed on the device. The reason for this is that the typical access patterns are lack of small data rewrite activities, which does not affect the performance of traditional mechanical hard drive. When the activities have random writes in a large LSA area or high mixed hot/cold data, they will lead to SSD management system bottlenecks.
In the random write test, Transcend SLC has much better performance than OCZ does. However, in the Mapping Suite test
and GC Suite test, OCZ outperforms Transcend SLC. This is mainly because the workload demands many small writes. When the small write data is distributed randomly in a large LSA area, the space usage utilization depends on the address mapping mechanism. Proper changes of the ratio of data block and log block can increase the space usage utilization, reduce unnecessary garbage collections and management cost. It is difficult to execute garbage collection effectively if the hot/cold data is highly mixed. Garbage collection should be postponed until enough invalid data has accumulated; at the same time hot data should be separated from cold data. As shown in the results, this was why the OCZ SSD with MLC outperformed Transcend SLC.
It follows from the discussion above that a necessary characteristic of SSD management is the ability to handle small and hot data. This is best accomplished by selecting an SSD device which offers RAM write buffering. In an IOMeter sequential test, MTRON performed significantly better than Samsung. However, when small data has random writes with large LSA area and the data with larger size than the write buffer capacity, the write back is frequently triggered by the buffer management of MTRON, which causes a higher management cost than Samsung’s. Although MRTOM has larger write buffer size, the write back mechanism is inappropriate. The time cost of data writes can be only achieved by the access time advantage of the RAM. Therefore, the overall performance still depends on the buffer write back mechanism. A good buffer write back mechanism should integrate with the FTL design to process small hot data and reduce the randomness of the data, rather than the size of the write buffer.
6. Conclusion
This paper discussed the test method for the SSD management performance. We proposed a new performance metric, Per-Byte-Response, to test SSD management performance, and analyzed the typical symptoms of the PBR when the management performance is low. Feedback is given to users so they can diagnose the reason for low performance. Four benchmark suites were used to evaluate each management performance. These benchmark suites, alongside PBR, yielded different results from traditional test methods. This offers considerable insight into the impact of SSD management mechanisms on actual performance.
References
[1] Nitin, A., P. Vijayan, et al. 2008. Design tradeoffs for SSD performance. USENIX 2008 Annual Technical Conference on Annual Technical Conference.
[2] Po-Chun, H., C. Yuan-Hao, et al. 2008. The Behavior Analysis of Flash-Memory Storage Systems. Proceedings of the 2008 11th IEEE Symposium on Object Oriented Real-Time Distributed Computing.
[3] Luc Bouganim., et al., uFLIP: Understanding Flash IO Patterns, 4th Biennial Conference on Innovative Data Systems Research (CIDR) January 4-7, 2009, Asilomar, California, USA.
[4] Hyojun, K. and A. Seongjun 2008. BPLRU: a buffer management scheme for improving random writes in flash storage. Proceedings of the 6th USENIX Conference on File and Storage Technologies. San Jose, California, USENIX Association.
[5] Sang-Won, L., P. Dong-Joo, et al. 2007. A log buffer-based flash translation layer using fully-associative sector translation. ACM Trans. Embed. Comput. Syst. 6(3):18.
[6] Diskmon.http://technet.microsoft.com/en-us/sysinternals/bb896646.aspx. (a) MTRON: 22.95MB/sec (b) Transcend SLC: 4.47MB/sec (c) OCZ: 5.95MB/sec
Figure (10) Mapping Suite Test Result
(a) Transcend SLC:0.98MB/sec (b) OCZ: 9.5MB/sec
Figure (11) GC Suite Test Result
Detecting Solid-State Disk Geometry for Write Pattern Optimization
Chun-Chieh Kuo
National Chiao-Tung University
Hsin-Chu, Taiwan, ROC
Jen-Wei Hsieh
TAIWAN TECH
Taipei, Taiwan, ROC
[email protected]
Li-Pin Chang
National Chiao-Tung University
Hsin-Chu, Taiwan, ROC
[email protected]
Abstract
Solid-state disks use flash memory as their storage medium, and adopt a firmware layer that makes data
map-ping and wear leveling transparent to the hosts. Even
though solid-state disks emulate a collection of logical sec-tors, the I/O delays of accessing all these logical sectors are not uniform because the management of flash memory is subject to many physical constraints of flash memory. This work proposes a collection of black-box tests can detect the geometry inside of a solid-state disk. The host system soft-ware can arrange data in the logical disk space according to the detected geometry information to match the host write pattern with the device characteristic for reducing the flash management overhead in solid-state disks.
1
Introduction
Flash storage is an enabling technology for cyper-physical systems because of its portability, energy effi-ciency, and small form factors. Because flash memory has some unique physical constraints such as erase-before-write and bulk erase, it exhibits highly asymmetric performance in terms of read and write. Thus, it is important that tem software and user applications of cyper-physical sys-tems cope with this performance characteristic for high-performance data access.
Solid-state disks use flash memory as their storage medium. They adopt a firmware layer to enable transpar-ent data access. This firmware layer is usually referred to as
flash-translation layer, which maps logical sectors to
phys-ical flash locations and levels the wear in the entire flash memory. Not surprisingly, the management of flash mem-ory imposes noticeable timing overheads on the processing ordinary read and write requests.
The design of an efficient flash translation layer aims at reducing the overhead of garbage collection, i.e, the extra data copy and flash erasure operations during the reclaim-ing of free space. Chiang et al. [1] proposed usreclaim-ing
page-level mapping between logical sectors and flash locations. This approach classifies data into different logical regions according to their update frequencies, and mapping these regions to different flash locations. Lee et al. [2] and Park et al. [4] proposed using hybrid mapping that combines block-level mapping and page-block-level mapping for a good balance between the mapping-table size and write performance.
In spite of firmware design optimizations, recently re-searchers started investigating how the host system soft-ware can cooperate with the solid-state disk firmsoft-ware to re-duce the flash management overheads inside of solid-state disks. Lee et al. [3] proposed a software layer in the host that converts random write requests into long and sequen-tial write bursts. This method effectively relieves flash stor-age devices of heavy garbstor-age-collection overheads, espe-cially for those low-end flash storage devices like thumb drives. A similar technique had also been proposed for tra-ditional disk-based storage systems: Schindler et al. pro-posed aligning file-system extents to disk-track boundaries to enable whole-track pre-fetching and to avoid extra disk-head movement during data accessing [6].
Even though geometry-aware data layout is a promis-ing technique for improvpromis-ing read-write performance, before the host system software can arrange data they must have the geometry information of the storage device (solid-state disks in our case). Such information includes parameters specific to the physical medium like the smallest unit sizes for read/write and flash erasure. There are also logical ge-ometry information such as the unit size of data mapping and the total number of logical sectors that a mapping table can reach. Unfortunately, storage devices will not disclose these information to the host. This prohibits the host soft-ware from optimizing data layout for device geometry.
This work proposes a test suite for detecting the geom-etry information inside of solid-state disks. This method treats solid-state disks as black boxes, and use a set of spe-cial read-write patterns to access the storage device and col-lects the I/O response times during the test. Finally, the distribution of these response times will reveal the desired geometry information.
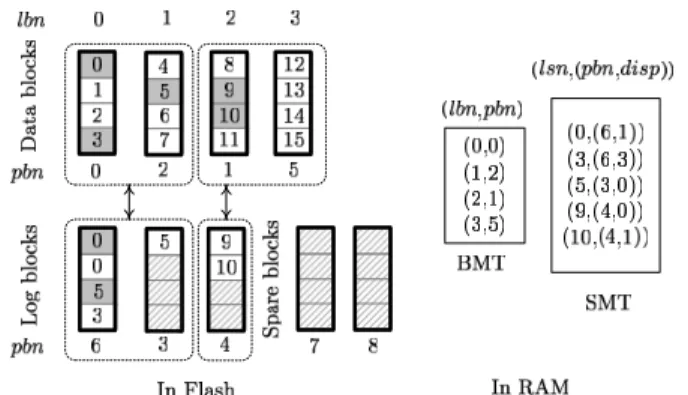
Figure 1. The set-associative mapping
scheme whose group size is two. Each
data-block group is associated with up to one log-block group.
The rest of this paper is organized as follows: Section II describes the flash characteristics and the fundamentals of flash translation layers. Section III introduces the typi-cal composition of the geometry inside of a solid-state disk, and discuss how the host system software can use these in-formation. Section IV presents a set of tests to detect these geometry information and the test results of several off-the-shelf products. Section V concludes this work.
2
Background
A piece of flash memory is a physical array of blocks, and every block contains the same number of pages. In a typical flash specification, a flash page is 4096 plus 128 bytes, while a flash block consists of 128 pages [5]. Solid-state disks emulate a collection of logical sectors using a firmware layer called the flash-translation layer (i.e., FTL). Flash-translation layers update existing data out of place and invalidate old copies of the data to avoid erasing a flash block every time before rewriting a piece of data. Thus, flash-translation layers require a mapping scheme to trans-late logical disk-sector numbers into physical locations in flash. After writing a large amount of data to flash, flash-translation layers must recycle flash pages storing invalid data by means of block erase. Before flash-translation lay-ers erase a block, it must secure any valid data in this block-to-erase by data copying. Garbage collection refers to these internal copy and erase operations.
Flash-translation layers use RAM-resident index struc-tures to translate logical sector numbers into physical flash locations, and mapping resolutions have direct impact on RAM-space requirements and write performance. Solid-state drives for a moderate-level performance requirement usually adopt hybrid mapping for a good balance between the above two factors. Fig. 1 shows a typical design of a hybrid mapping flash-translation layer [4]. Let lbn and pbn
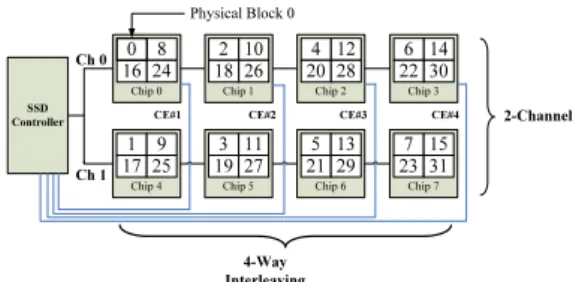
SSD Controller 8 16 24 Chip 0 2 10 18 26 Chip 1 4 12 20 28 Chip 2 6 14 22 30 Chip 3 1 9 17 25 Chip 4 3 11 19 27 Chip 5 5 13 21 29 Chip 6 7 15 23 31 Chip 7 Ch 0 Ch 1 2-Channel 4-Way Interleaving Physical Block 0 0
CE#2 CE#3 CE#4
CE#1
Figure 2. The effective page size is eight times as large as a flash page in a solid-state disk using a two-channel, four-way interleav-ing architecture. Disk sectors are mapped to flash chips using the RAID-0 style striping.
in Fig. 1 stand for a logical-block number and a physical-block number, respectively. A logical physical-block is a collection of logical sectors. Hybrid mapping maps logical blocks to physical blocks via a block mapping table (i.e., BMT in this figure).
Hybrid mapping uses spare flash blocks as log blocks to serve new write requests, and uses a sector mapping table (SMT in this figure) to redirect read requests to the newest versions of data in spare blocks. In Fig. 1, term lsn rep-resents a logical-sector number, and disp is the page offset in a physical block. A group of logical blocks can share a number of flash blocks as their log blocks. In this example, a mapping group size has two logical blocks, and a group can have up to two log blocks. Whenever garbage collec-tion is necessary, the flash-translacollec-tion layer “applies” the updates of sector data in the log blocks to logical blocks, and erases log blocks to reclaim spare (free) blocks. Ap-plying data change is basically a form of garbage collection because it involves data copy and block erase.
3
SSD Geometry Basics
This section introduce the composition of the geometry of solid-state disks and discuss how the system software can use these geometry information for data placement.
3.1
Effective Pages
Flash pages are relatively larger than disk sectors (4096 bytes compared to 512 bytes). The former is the est unit for flash read/write, while the latter is the small-est addressable unit in the host software. The effective unit for read and write in solid-state disks can even be several flash pages because many solid-state disks adopt multichan-nel architectures for parallel data transfer. Fig. 2 shows an example architecture, which uses two channels and 4-way