行政院國家科學委員會專題研究計畫 期中進度報告
銀行監理制度對銀行績效的影響:以 101 個國家為例(1/2)
計畫類別: 個別型計畫 計畫編號: NSC93-2416-H-004-043- 執行期間: 93 年 08 月 01 日至 94 年 07 月 31 日 執行單位: 國立政治大學金融系 計畫主持人: 沈中華 報告類型: 精簡報告 處理方式: 本計畫可公開查詢中 華 民 國 94 年 4 月 18 日
Determinants of the Financial Supervision Structure:
Global Evidence
Chung-Hua Shen
1Department of Money and Banking
National Chengchi University
Mucha, Taipei, 116
Taiwan ROC
TEL.: (02) 29393091–81020
FAX: (02) 29398004
email: [email protected]
April 7, 2005
1This paper is written while the author was a visiting scholar in De Nederlandsche Bank.
I would like to thank Prast, Bob as well as the seminar participants in the conference for constructive remarks. The views expressed here are those of the author and do not necessarily reflect official positions of De Nederlandsche Bank.
Abstract
This paper investigates the factors that determine the choice of a country financial su-pervisory system, which includes sectoral, partial and unified supervisions. The sectoral supervision means that a country’s bank, security and insurance sectors are supervised by the three different supervisors. The unified supervision prevails when the above three sectors are supervised by one supervisor. The partial supervision falls in between the above two systems. There are 101 countries in our sample. Our findings are that there is a “reverse central bank effect”, i.e., countries whose central bank also supervises banks tend to adopt sectoral supervision. Also, scale effect exists, i.e., countries with a higher population prefer sectoral supervision to partial supervision. Note that the poor country effect” is rejected because poor countries are prone to adopt sectoral supervision. Devel-oped countries tend not to adopt sectoral supervision but prefer unified supervision. Less developed countries, on the other hand, tend to adopt partial but not unified supervision. Central and eastern European countries prefer sectoral to unified supervision, which is our “CEE effect”. The striking result is that the reverse blurring of distinction effect” is found because a country whose banks are not allowed to engage in security and insurance activities tends to adopt partial and unified supervisions. Finally, “the good governance effect” does indeed exist because countries which have good governance prefer to adopt unified supervision.
Keywords: financial supervision, unified supervision, sectoral supervision JEL:
1
Introduction
In recent years, distinctions among financial intermediaries in the banking, securities and insurance sectors (hereafter the three sectors) have been blurred in many countries. In this regard, on November 12, 1999, the U.S. Congress, for example, passed the Finan-cial Modernization Act1 which authorizes bank holding companies to switch to financial
holding company (FHC) under certain circumstances. This new financial conglomerate allows banking, insurance and securities operations to be carried out under the same roof, policy which up to then had to some extent, been restricted. The new financial archi-tecture has not been confined to only developed countries as more and more developing countries are also gradually permitting their banks to engage in previously restricted non-bank activities. To cite one example, the Taiwan authority passed the Financial Holding Company Law in August 2000, permitting a FHC to hold more than 25% of the shares of the three sectors at the same time. That “blurring of distinction” goes on among financial products is also certainly well-known. Many new financial products share the features of deposits, annuities and securities simultaneously. In the Nether-lands, for example, a mortgage combined with a unit-life insurance policy embodies the components of the three financial sectors (Van der Zwet, 2003). Returning to Taiwan, security-linked deposits or insurance-linked deposits are typical examples of products which combine deposits with securities and insurance. To be sure, throughout the world, this “blurring of distinction” among financial institutions, products and markets across the three financial sectors has now become the norm rather than the exception.
Given the green light to a financial conglomerate to engage either in the above three activities, or in the existing financial institutions with a view to issuing hybrid products
clearly challenges existing supervisory systems which are typically organized sector-by-sector.2 Under such “sectoral supervision” system, the “blurring of distinction” aside it
is much less easy to supervise new financial conglomerates and products on account of what is referred to as the “blurring of responsibility”. To cite one example, ambiguity as regards to responsibility arises when a bank is in distress owing to its engagement in securities operations. The ”blurring of responsibility” argument is that none of the supervisors should be held accountable for cross-sector behaviour, thereby endangering the whole financial sector. Moreover, when one financial sector is in distress, the ensuing market turbulence may well spill over eventually into another sector, especially if the supervisors or regulators do not actively co-operate with each other. The threat that this “spillover effect” will intensify as a result of global financial integration. Recent Asian financial crisis and many other banking failures are thought to be consistent with this view. Hence, how to choose an optimal financial supervisory system has become a crucial issue.
The aim of this paper is to investigate, and, therefore, better understand the determi-nants that affect the choice of supervisory structure employed in 101 countries. Courtis (2002) has compiled data on the supervisory bodies of the three sectors for each and ev-ery country all over the world. We classify the countries in his compilation into sectoral, partial and unified supervisions. As for the first, sectoral supervision denotes that a country’s supervision is conducted sector-by-sector, i.e., there are three supervisors, one for each of the three sectors. Partial supervision denotes that any two out of the three sectors are supervised by one supervisor, while unified supervision means one supervisor oversees all three sectors. We provide a detailed discussion of the three groups in the
2A majority of countries in the world have adopted sectoral supervision. This issue will be discussed
next section.
Once we have classified the countries into three groups, we investigate whether there are certain features are shared among all countries. One pertinent question we ask is “Why do some countries choose to adopt sectoral, while others move to unified super-visions? Are there any systematic patterns in this decision? First of all, anecdotal evidence has it that poor countries tend to adopt unified supervision because of cost savings. Though that may be true in some cases, the rich countries of Norway, Sweden, the U.K., Japan and Germany, which have started to adopt unified supervision in recent years, seem to be against this argument. Hence, the first hypothesis raised in this paper is that, “Does the poor country effect really exist”? A second argument is based on Taylor and Fleming’s (1999) suggestion that a small transitional or developing country should adopt an integrated agency in an effort to alleviate bureaucratic red-tape. This could explain why small countries, like Malta, the Netherlands Antilles, Uruguay and Singapore, adopt the unified system but it cannot provide the rationale behind other small countries, like Hong Kong, Albania, Oman, Jamaica and Ghana among others, adopting the sectoral supervision. Hence, we ask, “Is the scale (i.e., size and population) a crucial factor in a country’s choice of supervisory system? This might be referred to here as the “scale effect”. The determinants might be also related to the development of a country, therefore, we also consider a country’s stage of development by dividing the sample into developed (DC) and less developed countries (LDC). The trend among central and eastern European (CEE) countries with regard to the supervisory system is also taken into account.
More institutional factors are considered. Based on the argument of blurring of dis-tinction, a country allows her banks to engage in securities, insurance and real estate
related should adopt the unified supervisory system, and not otherwise. The mixed evi-dence is found in the real world. For example, banks in the U.K. and U.S. are allowed to carry out the activities of securities and insurance but the former adopts the unified and the latter the sectoral supervisions. Hence, is there a “blurring of distinction effect”? Also, because the success elements of the unified supervision requires strong coopera-tive and coordination, countries adopt the unified supervision is expected to have good governance. Anecdotal evidence, such as those countries with good governance, Norway, Denmark, Sweden, Singapore, Germany and the U.K., seem to support this argument. The counter-evidence, however, also exists, such as Canada, Finland, France and the U.S. which have good governance but adopt either the sectoral or partial supervisions. Hence, “Are good governances, such as rule of law, investor and credit protections, etc, useful factors in determining the choice of supervisory system?” Namely, is there a “good gov-ernance effect”? Furthermore, are government supervisory abilities related to the choice of system? This could be measured by the official supervision power and private monitor abilities, two indices provided by Barth et al. (2004 ) in their survey of 89 countries. All above unanswered questions have not yet been explored in the past. This paper plans to fill this gap.
The role of the central bank as banking supervisor is also stressed here. Taylor and Flemming (1999) argue that a small country tends to allow the central bank to supervise all sectors. Singapore is one good example. The opposite cases, however, are also voluminous, such as Cayman, Costa Rica, El Salvador, Gibraltar, Guatemala, Panama, Venezuela and Peru are typically thought to be small but neither their central banks supervise banks nor adopt the unified supervision. Previous relevant studies mainly focus on how a central bank’s supervisory duties could affect its monetary policy, the
so-called dual-role effect. For example, Peek, Rosengren and Tootell (1999), who use confidential bank rating data for the U.S., find that information obtained from bank supervision helps the central bank to conduct monetary policy more effectively. Also, see Goodhart and Schoenmaker (1995), Di Noia and Di Giorgioi (1999) and Ioannidou (2002) for discussing the case when monetary policy and banking supervision are given to the same agency. They, however, do not investigate the role of central bank in affecting the choice of supervisory system. This paper investigates the role of central bank in choosing the supervisory system.
Our cross-country study has the same methodological limitation as other cross-country studies. Supervisory change is a dynamic process but we can only study for one point of time (see Barth et al., 2002, for the same argument). Also, the information of supervi-sion is employed only up to 2001. This implies that countries whose supervisupervi-sion system has changed after 2001 are not taken into account. This includes China’s new sectoral supervisory system from 2002, Germany’s unified supervision from May 1, 2002 (Sanio, 2003), the Netherlands’s integration of banking and insurance from April 1, 2004 (Mooij and Prast, 2003) and Taiwan’s single new agency to supervise three sectors from July 1, 2004 (Shen, 2003).
The remainder of the paper is organized as follows. Section 2 provides the background of supervision. Section 3 introduces the methodology used in this paper. Sections 4 and 5 describe the data and basic statistics and empirical findings, respectively with the concluding remarks being collected in Section 6.
2
Background of Financial Supervision
2.1
Three Supervisory Systems
The above mentioned blurring of distinction of financial activities give rise to the question of choice of supervisory system. Four possible suggestions have been raised to solve the blurring of distinction (Van der Zwet, 2003), namely, strengthening the co-operation between sectors (e.g. the Netherlands before 2002),3 adopting functional supervision
(e.g., Australia and recent Netherlands), asking the central bank to take charge of the three activities (e.g., Singapore) and creating a single regulatory agency (e.g., the U.K.). The most persuasive argument against the first approach, i.e., strengthening coop-eration among agencies is the “blurring of responsibility” discussed earlier. Taylor and Fleming (1999) argue that simply because co-ordination is difficult, costly and inefficient when the banking, securities and insurance businesses are regulated and supervised by different authorities, there is a need to unify them into a single agency to reduce potential financial instability. Hence, the first approach has not gained wide acceptance since the recent Asian financial crises.
The second approach, adopting functional supervision, has also not been widely adopted probably because its prerequisites of responsibilities and objectives are not easy to be clearly defined. Something that is often lacking in developing countries.
The recent tide of restructuring financial supervision seems to have started to dismiss the third approach, putting the central bank in charge of these activities, as more and more countries have recently removed the central bank’s role in banking supervision.4
Hence, while Llewellyn (1999) argues that currently the single most common model is
3Note that the Netherlands merged bank and insurance supervisors on April 1, 2004, see Mooij
and Prast (2003), in line with the supervisory practice in Australia. Hence, Netherlands now adopts functional supervision after April 1, 2004.
one where the central bank is responsible for banking supervision, it is expected that the number of countries that do this will decrease. Tuya and Zamalloa (1994), in fact, show that in 167countries, “banking supervision is conducted by the central bank in over 60 per cent and that the Western Hemisphere was the only region where the percentage declined to 50 per cent. Nevertheless, in over 80 per cent of Asian, African and Middle Eastern countries, banking supervision is a function of the central bank.”5 Whether the central
bank should be given the power of supervision is a long lasting issue. While the main task of the central bank is to conduct monetary policy, the “optional tasks” of banking supervision may, in some cases, become the center of policy debates (Di Noia and Di Giorgio, 1999). The main objection to allowing a central bank to supervise banks is the “conflict of interest” between monetary policy and banking supervision. On the other hand, the synergy of information from supervision and monetary policies is considered strong grounds to support the policy.
Among the four approaches, the last one, creating a single regulatory agency, has attracted the most attention probably because the new Labour government in the UK announced plans in 1997 to consolidate financial supervision in a separate and new agency. Taylor and Fleming (1999) claim that by integrating existing diversified regulators and supervisors, unified supervision can minimize conflict resolution and improve account-ability. They refer to this unified supervisory agency as the “integrated supervisor(s)” against the conventional “sectoral supervisors”. Other than the U.K. countries, which have changed from other supervisory systems to this unified supervision, include Japan, South Korea (hereafter Korea), Taiwan and Germany.
Based on the discussion above, we classify countries into three supervisory
classifica-5The number, however, needs to be interpreted cautiously as it includes many very small states, see
tions, where the role of the central bank is taken into account independently. First, in a “sectoral supervision system”, each sector is responsible for one of the three objectives, whereas in a “unified supervision system”, a single supervisor assumes responsibility for all three. Thirdly, “partial supervision”, which is a system in between the two, is more complicated. It could be a functional supervision system, with two supervisory agents: one for prudential supervision and the other is for conduct-of-business supervision. The Netherlands and Australia seem to be the only two countries that have clearly announced the adoption of such a functional supervision system.6 The partial supervision system
could alternatively consist of just two supervisory agents, where one supervises two sec-tors, while the other supervises the remaining one. Because we have only two observations of the functional supervisory system, we do not make a distinction between these two types of partial supervision.
2.2
Advantages and Disadvantages of Each Supervisory System
Typically, three objectives of financial supervision are presented in the literature: sys-temic stability, financial soundness of individual institutions and consumer protection (Bikker and Van Lelyveld, 2003; Schoenmaker and Wierts, 2002).7
Though there appears to be a “trend” toward adopting the unified supervision system,8
a consensus has not been reached. Academic discussions on the advantages and disad-vantages of each supervisory system are still abound. Advocates of integration point out five advantages of adopting a single agency (Briault, 1999). These are that integration
6Those countries which adopt unified approach may also adopt the functional supervision. We,
however, skip this issue.
7The four statutory objectives in the U.K.’s supervisory system is to maintain confidence in the
financial system, to prompt public understanding of the financial system, to secure the appropriate degree of protection for consumers and to reduce the extent to which it is possible for a financial services firm to be used for a purpose connected with financial crime (see Briault, 2002).
8In that only a handful of countries have adopted unified supervision, it might not be appropriate to
creates economies of scale and scope, has efficient resource allocation, reduces conflict resolutions, and establishes better accountability. Opponents of integration argue that a single regulator is not necessarily under any obligation to deliver these advantages. For example, Goodhart et al. (1998) show that specialized divisions will exist even within a single agency, thus creating potential problems in communication, information sharing, co-ordination and consistency. Goodhart et al. (1998) and Taylor (1995) argue that the divergent objectives are better resolved at a political level rather than by a single regulator.
Empirical studies aimed at investigating the success at achieving the three objectives, however, are difficult since it is not easy to find the operational definitions of the objectives in the literature. Barth, Caprio and Levine’s (2002) work could be regarded as being in line with the second objective of financial soundness.
2.3
Is There a Trend?
The choice of financial supervision has been widely discussed since the U.K.’s estab-lishment of a single statutory body in 1997 , the Financial Services Authority (FSA). The establishment of a single European monetary authority further heated up the issue as to whether Europe should have a central financial supervisor (Di Noia and Giorgio, 1999). While the U.K. case has drawn much attention from both the international fi-nancial press and policy-makers, it was not the first country to create an independent supervisory agency. The three Nordic countries (Norway, Sweden and Denmark ) had been moving toward the integration of these different supervisory functions into a single agency since the early 1990s, hoping to increase the soundness of their financial sector.
The issue soon became even more of a global one given the reemergence of financial turbulence, individual bank failures and systematic crises in Latin America, Asia and
eastern Europe as well as bank failures and near-failures in developed countries. It has been argued that one of the reasons for all of these financial turmoils was probably that sectoral supervisors were not used to co-operate. The fact that financial conglomerates were then allowed to be established lends support to this belief. Thus, Japan (in 1998), South Korea (in 1999) and Taiwan (on July 1, 2004) adopted the integrated supervision system after the 1997 Asian financial crisis. Germany, as stated earlier, also adopted a similar system, thereby setting up an independent, unified supervisory agency on March 1, 2002. Against the “trend” toward unified supervision, Australia adopted functional supervision in 1997 by combining banking, insurance and securities under the name of conduct of business. Banking and insurance supervision in Australia were integrated for the purposes of prudential supervision.9 Very recently, the Netherlands adopted a similar
set-up to that of Australia around 2002 (Mooij and Prast, 2003). Interestingly enough, in 2002, China, reversed the so-called “tide” or trend and adopted sectoral supervision by removing the supervision of insurers and securities from the control of the central bank. Obviously, different countries seem to have different preferences. In fact, what is generally agreed is that no single model of regulatory structure is appropriate for all countries (Abrams and Taylor, 2000; Briault, 2002), and perhaps for this fact alone, investigating what the determinants of financial supervision is important.
9Whether Australia really adopts the system of unified supervision is controversial. While Abrams
and Taylor’s (2000) and Llewellyn’s (1999) studies include Australia as having adopted unified supervi-sion, we find it is inclined to the functional supervision and the supervisors are not fully integrated.
According to Courtis’s (2002) data, securities activities in Australia are supervised by an ”old” su-pervisory body, i.e., ASIC (Australia Securities and Investment Committee), regardless of which sectors are engaged in the securities business. Simply put, functional supervision has been adopted in Australia for securities activities. The banking and insurance sectors, however, are supervised by a new agency, the APRA (Australia Prudential Regulation Authority). The supervisory systems in Australia have not yet been completely integrated.
2.4
The Role of the Central Bank
Studies of the “double role” of a central bank are also in line with research into financial supervision. As a matter of fact, some researchers have focused on the effects of monetary policy when central banks are also responsible for banking supervision. This double role is mostly found to have a less-than satisfactory impact on the effectiveness of monetary policy since the agency that conducts banking supervision must have clear responsibilities and objectives in order for it to be effective. Each such agency must posses operational independence and adequate resources. Di Noia and Di Giorgio (1999) claim that the combination of different responsibilities and objectives in one agency may result in weak banking supervision, hence negatively affecting monetary policy. Not surprising, then, that Heller (1991), Goodhart and Schoenmaker (1995) and Di Noia and Di Giorgio (1999) find that countries with a central bank having supervisory responsibility experience higher inflation rates. They interpret this as evidence of the “conflict of interest” argument case. (see Ioannidou (2002) and the references therein.)
3
Econometric Model
Studying what determines whether a country adopts a particular system of financial su-pervision is of particular interest. We use a multinomial logit (MNL) model to explore the determinants of financial supervision. The MNL is intended for use when the de-pendent variable takes on more than two discrete outcomes with no natural ordering; this is the case when the values assigned to the dependent variable are arbitrary. In the case of our supervision, we have one multiple choice variable, FSIi, = 1, 2, 3, where i is
the ith country, for example, a country takes the value of 1 if the country adopts sector supervision (FSIi = 1) and 2 if the supervision includes any two sectors (FSIi = 1), and
3 if it is unified supervision (FSIi=1). Thus, our determinant equation is
P rob(FSIi = j)
= F {([a1j + a2jSCALEi][a3jGDPperi+ a4jDCi+ a5jLDCi + a6jCEEi])(a7j + a8jCBi)
+a9jBank Activity Restrictions + a10jGovernancei
+a11jSupervisory Power + a12jBank Share Heldi+ εij} (1) i = 1, 2, . . . , N, j = 1, 2, 3
= F (AjXi+ εi), (2)
where i is the ith country; j is the choice of the jth supervision system; aij is an unknown
coefficient of the ith variable of jth choice; N is the number of countries used; εij is the
error; and F is the logistic function. We can rewrite equation (1) as (2) to reduce the notational burden where Aj is the vector of coefficients aij, and Xi is the vector of
the explanatory variables. For simplicity, we remove the subscript i provided that no confusion arises.
Our dependent variables FSIi is a multiple choice variable denoting whether a country
adopts no integration, partial integration or full integration, respectively. That is, FSIi
is equal to one if a country adopts sectoral supervision (no integration), 2 if partial integration is adopted, and 3 if full integration is adopted. For simplicity, the subscript i is deleted if no confusion is created.
Our explanatory variables are discussed below.
Central Bank. Whether a central bank should be responsible for supervising a bank is a controversial issue in both bank supervision and monetary policy (Giddy, 1994; Goodhart and Schoenmaker, 1995). It may very well give rise to a conflict of interest between their goals. Term CB is a dummy variable which is equal to 1 if the central
bank is in charge of bank supervision, and zero otherwise.
Scale of Country. It is argued that a small country tends to adopt unified supervi-sion to have an economies of scope. The scale (SCALE) variables considered is proxied by the population (POPULA). One would expect that the smaller the scale of a country, the higher is the probability that it will adopt unified supervision.
Economic Development We consider the economic development of a country by using the proxy of a developed country (DC), a less developed one (LDC) or a central eastern European countries (CEE) in an effort to capture the features of the development of a country. They are all dummy variables. We exclude all of the least developed countries (LLDC),10 thus, the sample does not consist of many very small or any very
poor countries, which have very limited financial activities. The economic development is also proxied by GDP per capita (GDPper).
Our model considers the interactions among CB, DC/LDC, GDPper and SCALE. The interaction terms allow us, for example, to determine whether a small, less developed country increases the probability of adopting unified supervision when its central bank is responsible for bank supervision, Expressed mathematically:
∂3FSI
∂CB × ∂LDC × ∂SCALE = a8j × a5j × a2j
In the estimation, only one coefficient of SCALE × LDC × CB is obtained. Postulations of other interactive variables are similarly tested.
Bank Activity Restriction Variables. These variables are the restrictions of banking activity in securities, insurance and real estate. As mentioned in the Intro-duction, one of the arguments in favor of adopting unified supervision is based on the blurring activities of these three industries. If a country does not allow its banks to
10The United Nations currently designates 49 countries as least developing countries, and these
engage in these activities, it has less intention to adopt unified supervision. Bank restric-tions are proxied by three index variables which represent restricrestric-tions on banks’ activities in securities (BANK-S), insurance (BANK-I) and real estate (BANK-R) activities. They are discrete variables ranging from 1 to 4 denoting unrestricted, permitted, restricted and prohibited in terms of a bank’s right to engage in the above activities, respectively. Barth, Caprio and Levine (2001) survey these bank activity restriction on variable for 66 countries, and hence adding theses variables into the model decreases the number of countries used.11 Because higher numbers denotes tighter restrictions, the effect of
the blurring of distinction would suggest negative coefficients, which imply a decreasing probability of adopting unified supervision.
Governance. Governance is that of a government (GoodGov), including the rule of law, efficiency of judicial system, corruption, risk of expropriation, risk of contract repudiation and accounting standard, compiled by La Porta, Lopez-de-Silanes, Shleifer and Vishny (1998, LLSV). While the LLSV scores are based on a 1995 survey, academic studies regarding governance still refer to this source probably because a country’s gov-ernance structures are relatively stable. The scores are ranged from 1 to 10 with a higher score indicating a better governance.
Supervisory Power. The Supervisory Power variable, contains the Official Super-visory Power Index (OSPI) and the Private Monitor Index (PMI), taken from Barth et al. (2004). The OSPI measures the extent to which official supervisory authorities have the right to take specific actions to prevent and correct problems. It includes three
11Barth et al. (1998) use only 45 countries to examine the degree of restrictions on banking activities
using cross-country data and find that banks with more diversified power are less likely to suffer a banking crisis. However, they also mention that this result may be sensitive to other components of the regulatory environment which are their omitted variables. It may be that countries that authorize broader powers to a bank may have higher capital requirements. Shen and Chang (2002) use similar approach and find that the rule of law in La Porta et al. (1998) is crucial in affecting bank performance when banks are restricted with regard to engaging in securities. Also, see Shen and Chih (2005).
components, i.e., prompt correction action, restructuring power and the power to declare insolvency. The PMI measures the monitor function of the private-sector and includes four components, i.e., a required certified audit, a rating by international rating agen-cies, an explicit deposit insurance scheme and bank accounting transparency. These two variables are also used to investigate whether the governance of a country is related to the choice of financial supervision.12 Higher values imply greater supervisory power.
It is worth noting that not all coefficients can be estimated in the MNL model. If there are N choices in the system, only N − 1 choice parameters can be estimated, with the remaining one being selected as the benchmark. The explanations of the estimated coefficients are all relative to this benchmark, which is chosen arbitrarily.13 We select
sectoral supervision (FSI=1) as the benchmark, and hence, two sets of coefficients–A2 for
FSIi = 2, and A3 for FSI = 3–are obtained. We estimate the MNL by using the following
logistic functions: P r(FSIi = 1) = 1 1 + exp(A2Xi) + exp(A3Xi) ; (3) P r(FSIi = 2) = exp(A2Xi) 1 + exp(A2Xi) + exp(A3Xi) ; and (4) P r(FSIi = 3) = exp(A3Xi) 1 + exp(A2Xi) + exp(A3Xi) . (5)
We can rely on the following odds ratios for a better understanding of the coefficient signs and magnitudes. For example, the relative probability of selecting unified supervision with respect to sectoral supervision would be
P r(FSIi = 3) P r(FSIi = 1)
= exp(A3Xi),
12While Barth et al. (2004) provide eight banking-related governance indices, we only take the OSPI
and PMI because these two measures are the most relevant indices to our study.
13It is noted that the possibility of using the estimates in this manner relies on the validity of the
independence of irrelevant alternative (IIA) assumption: the inclusion or exclusion of choices does not affect the odds ratios associated the remaining choices.
which means that we compare different probabilities with regard to a decision regarding the selection of sectoral supervision. We obtain the coefficients of A2 in a similar fashion.
4
Data Description and Basic Statistics
4.1
Data Sets of Sample Countries
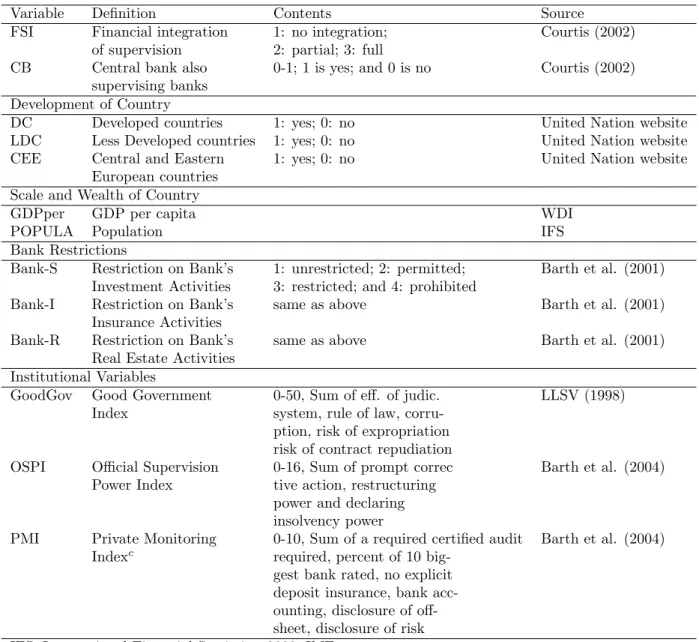
Table 1 lists the mnemonics of the variables as well as their definitions and sources. Not all explanatory variables are available for all countries. In fact, based on the data availability, we have four sets of data. The first set uses the 101 sample countries when regressors contain such variables as POPULA, SIZE, LDC, DC and INFLATION. These variables are available for all of the sample countries. Worth noting is that we have only 98 countries when GDP per capita is used because this variable is not available for Bermuda, the Cayman Islands, and Netherlands Antilles. Even if there are 98 countries when GDP per capita is used, we, however, still refer to this as the “whole sample”. This is our benchmark sample.
The second data set concerns the bank activity restriction variables, S, BANK-I and BANK-R. These variables, taken from Barth et al. (1998), are available for only 46 countries. Thus, whenever we use these variables, a subset of the full of sample countries is employed. Third, when the OSPI and bank restriction variables are used simultaneously, the sample size does not change. Finally, when LLSV’s governance and bank restrictions variables are used simultaneously, the sample size diminishes to 41. Tables A1 and A2 report a detailed summary of the subsets of the variables.
4.2
Basic Statistics on Financial Supervision
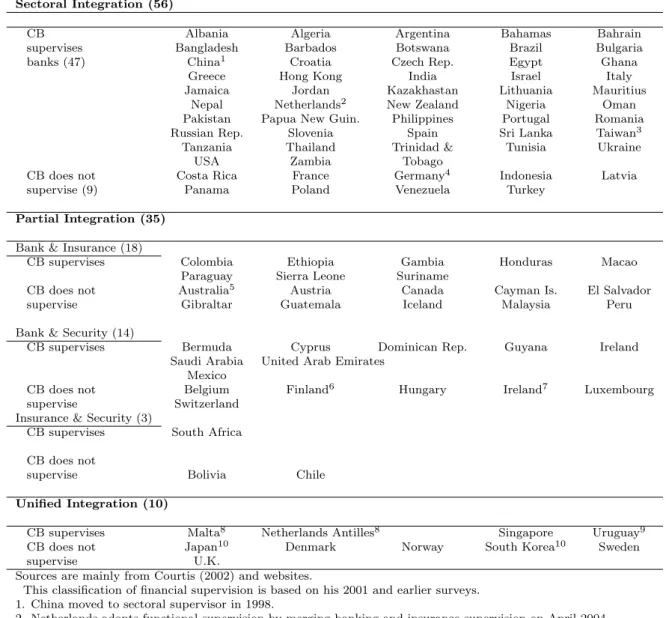
Table 2 lists the names of countries categorized into the three supervisory systems. In each system, we further divide the countries into whether their central bank is responsible
for bank supervision or not. The majority of countries (56) adopt sectoral supervision and in 47 out of 56 the central bank is responsible for bank supervision. Next, there are 35 countries which adopt partial supervision, and 18 of them have one supervisor for banks and insurance firms,14 14 of them have one supervisor for banks and securities and
only 3 countries have one supervisor for insurance and securities. Hence, in the partial supervisory system, banks and insurance firms tend to share one supervisor, whereas securities and insurance do not. Worthy of note is that though we have three different types of partial supervision, we do not distinguish them in the following regression anal-ysis due to a loss in the degree of freedom. The unified supervisory category consists of 10 countries with 4 supervised by their central bank and 6 by a newly-established agency. In sum, countries adopting sectoral supervision with their central banks supervising their banks outnumber other cases here. We find similar results to those of Tuya and Zamalloa (1994), but their sample contains many small countries (like Sao Tome, Myan-mar, Vanuatu etc.), which has been subject to criticism for fear of biasing the findings (see Di Noia and Di Giorgio, 1999). Our study considers developed and less developed countries and CEE, and as a result, is free of such criticism. Banks and insurance com-panies are often supervised by the same supervisor. With the exception of Taiwan, the recent “trend” toward adopting unified supervision occurs only in OECD countries.15
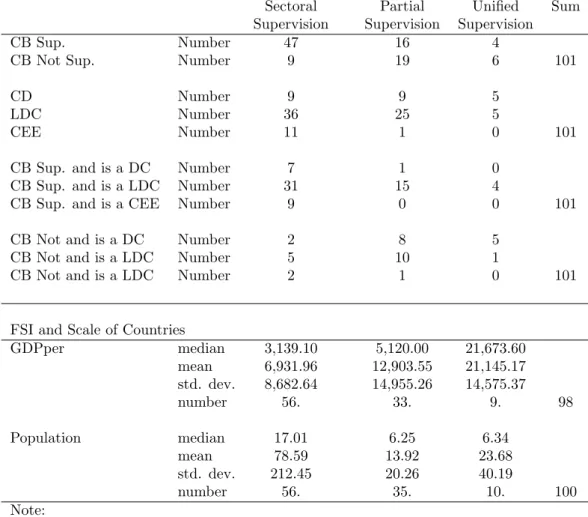
Panel A in Table 3 further analyzes various features of each of the countries and also discusses the number of developed and less developed countries in each system. Among 66 LDCs, 36 adopt sectoral supervision, 25 adopt partial supervision and only 5 adopt
14We are unsure about Paraguay since its central bank is responsible for regulations but it has an
independent supervisor for banks.
15Important here is that changes in the supervision systems in the past 5 years have been more drastic
than in the past three decades combined. The above classification is based on information available before 2001, but a note is made in the bottom of Table 2 whenever there are changes after that.
the unified supervision.16 Regarding the role of the central bank, 50 LDCs give the power
of bank supervision to their central bank, but only 8 do so in DCs. Thus, unlike DCs, LDCs are prone to ask their CB to supervise banks. There are 12 CEE countries in our sample and 11 of them adopt sectoral supervision, with 9 of them having the central bank in charge of bank supervision. None of the CEE countries adopt unified supervision.
In sum, the majority of the LDCs adopt sectoral supervision, and at the same time, their central bank supervises banks. The DCs are equally spread across the three systems but are displaying an increasing tendency to adopt unified supervision. CEE countries are most likely to adopt sectoral supervision, with the central bank supervising banks. No CEE countries adopt unified supervision.
Panel B in Table 3 presents the average of the wealth variable, GDP per capita and the scale variable, i.e., population. We report the median, average, standard deviation and number of countries. The median GDP per capita of the sectoral, partial and unified supervisory systems are $3,139, $5,120 and $21,673, respectively. It is evident that rich countries tend to adopt unified supervision, which contradicts our poor country effect. Also, the mean of population of three supervisory systems are 78.59, 13.92 and 23.68, respectively. Accordingly, large countries tend to adopt sectoral supervision, while small countries tend to adopt partial and unified supervision, supporting the “small country effect”. No other patterns can be highlighted because of large variations across countries. Except for GDP per capita in the unified case, the standard deviations are overwhelmingly larger than the mean. These large heteroscedasticities are also reflected in the significant differences found between median and the mean.
16If Korea and Singapore are excluded from the LDC based on the IMF classifications, then there are
5
Empirical Results
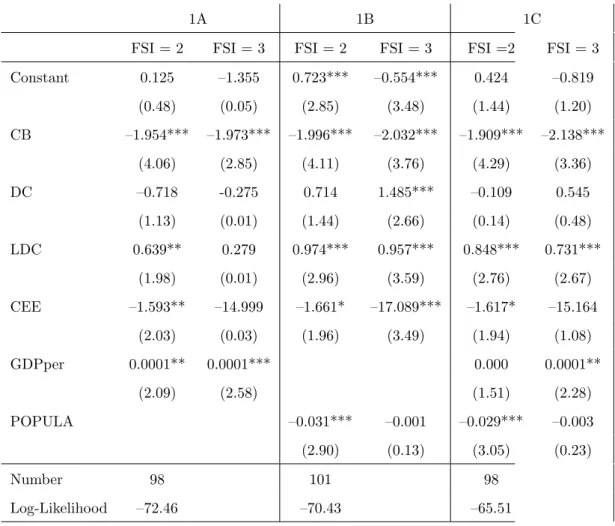
Tables 4∼6 present the estimated results from using the determinant equation. The absolute t-values are put in parentheses. Because we use FSI = 1 as the benchmark, the explanations of the estimated results under columns FSI = 2 and FSI =3 are relative to this benchmark. Also, we attempt different specifications, denoted as 1A, 1B and 1C to examine robustness. Because CB, DC, LDC and CEE are our core explanatory variables, we do not remove them when we change the specifications.
Table 4 presents the estimated results when we take into consideration full the sample of countries. Specification 1A is the simplest model and includes only six explanatory variables, i.e., CB, DC, LDC, CEE, GDPper and POPULA. The coefficients of CB, which are respectively –1.954 and –1.973 in the FSI =2 and FSI =3 equations, are highly significant. This result strongly suggests that if a country’s central bank is in charge of bank supervision, it is prone to move away from partial and unified supervisions and is more likely to adopt sectoral supervision. Accordingly, there is a “reverse central bank effect”. In short, those countries which adopt sectoral supervision also tend to use the central bank to supervise banks. The coefficients of the DCs are insignificantly negative regardless of FSI, indicating that there is no DC effect on the choice of supervisory system when the whole sample is used. The coefficients of the LDCs are significantly positive when FSI = 2 but insignificantly positive when FSI = 3, implying that a LDC tends to adopt partial but not unified supervision. A significantly negative coefficient of CEE country when FSI= 2 but not when FSI= 3 equation means that a CEE is more inclined to adopt sectoral supervision over partial supervision. GDP per capita is significantly positive in both FSIs’, which has the implication that richer countries have less tendency to adopt sectoral supervision.
Specification 1C of Table 4 replaces GDP per capita by POPULA which shows a significantly negative sign when FSI =2 but an insignificant negative sign when FSI = 3. This resembles the results for CEE, that is, a greater population decreases the tendency to adopt partial supervision. Results from population supports partially the “scale effect” because coefficients of POPULA are significant only when FSI = 2. In the case of FSI = 3, the coefficients of DC, LDC and CEE all change from insignificant to significant. We find that this is owing to the extra explanation provided by POPULA. Specification 1C takes GDPper and POPULA into account and the results do not change.
Judging from the results of four specifications in Table 4, CB is overwhelmingly sig-nificantly negative, and this evidence does not change even if we use a different sample size in the tables which follows. Thus, there is a “reverse central bank effect”, in other words, a country with its central bank supervising banks, strongly prefers sectoral super-vision. This result holds for all specifications. The impact of DC is elusive with the sign changing in different specifications, and it is only significant in specification 1C. LDC, by contrary, is a rather robust factor because, except for 1B, its effect is overwhelm-ingly significant. Compared to partial supervision, a higher population prefers sectoral supervision. To sum up, the scale effect that a large country does not adopt sectoral supervision is quasi-supported when FSI = 2.
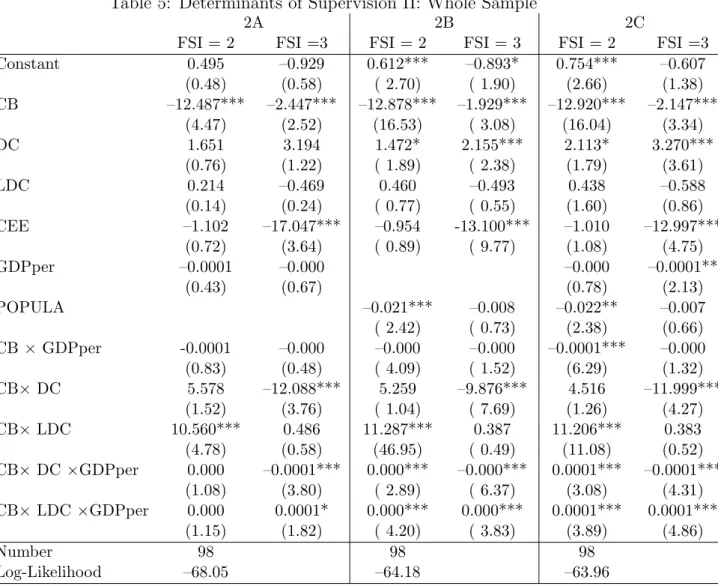
Table 5 expands the explanatory variables to consider five interaction terms, namely, CB×GDPper, CB×DC, CB×LDC, CB×DC×GDPper and CB×LDC×GDPper using the whole sample size. 17 There are three specifications, 2A, 2B and 2C. Because the
sample size is the same for the three specifications (=98), the log likelihood ratio (LR) test can be performed. The log-likelihood values of the three specifications are –68.05,
17Our of interaction term of two variables always considers CB. Then, DC, LDC and GDPper are
–64.18 and –63.96, respectively, and the latter two are nested in the third, making the LRs 8.72 and 0.44. Consequently, we reject specification 2A, but we cannot reject 2B in a statistical sense. Specification 2B, therefore, is the grounds for the discussion below.
The coefficients of CEE are overwhelmingly significantly negative when FSI = 3. Thus, CEE prefers sectoral supervision to unified supervision, which we could call “the CEE effect”. The coefficients of DC in specifications 2B and 2C are both significantly positive, which suggests that developed countries are inclined to adopt either partial or unified supervisions but not the sectoral one. It is inconsistent with the common notion that rich countries have a larger capacity, enabling them to adopt sectoral supervision. Hence, a “reverse DC effect” is found. LDC has no effect on the choice of supervisory system. GDP per capita, to our surprise, changes its signs from positive in Table 4 to negative here, though mostly it is insignificant. One explanation for this change is probably related to the added interactive terms which mitigate the effect of GDP per capita per se. Population remains strongly negative when FSI = 2, supporting the “scale effect”.
The interactive terms also show particularly interesting results. Firstly, the coeffi-cients of CB×DC are significantly negative when FSI = 3. Thus, a developed country with its central bank supervising banks is strongly against the adoption of unified super-vision, but instead, prefers sectoral supervision. Given this evidence together with the above evidence from DC alone, what we can conclude is that developed countries when their central bank are not supervising banks tend to adopt unified supervision; conversely, they tend to adopt sectoral supervision when their central banks do not supervise banks. Secondly, the coefficients of CB×LDC are significantly positive when FSI =2. This evidence along with the insignificant coefficient of LDC suggests that less developed
countries with their central bank supervising banks prefer partial supervision. If the central bank of a LDC does not supervise banks, it evidently has no effect whatsoever on the supervisory system. Thirdly, even among developed countries whose their central bank supervises banks the GDP per capita has a negative impact when FSI =3 but a positive effect when they are LDC. Thus, increasing GDP per capita decreases the probability of adopting unified supervision in DC×CB but increases the likelihood in LDC×CB.
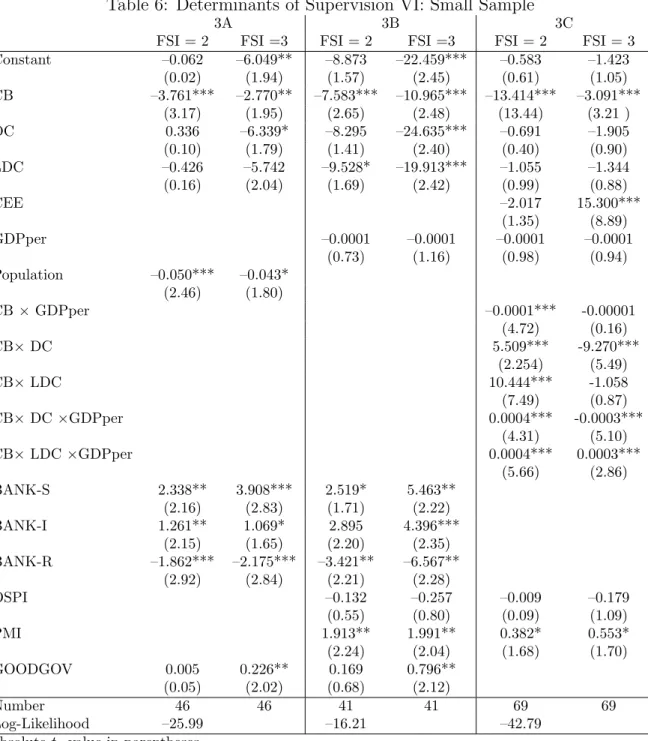
Table 6 presents the estimated results using the subset samples. There are three specifications, 3A, 3B and 3C, in the table, and the sample size of each specification is different. Recall that only 46 countries have useable data when bank activity restriction variables are used. The sample is reduced to 41 further when both bank activity restric-tion variables and the OSPI and the PMI are used. As stated earlier, we thus do not conduct any LR tests when sample sizes are different.
Table 6 adds OSPI, PMI and GOODGOV into the model and also contains three specifications 4A, 4B and 4C. Because the sample size is not the same, no LR tests are conducted. None of coefficients of OSPI are insignificant, suggesting that whether official supervisory authorities have the authority to take specific actions to prevent and correct problems is not related to the choices of financial supervisory system. Coefficients of PMI are significantly positive regardless of specifications. Because PMI is more related to the concept of market discipline and self-correction, thus, a country with better pri-vate market discipline is inclined to adopt partial and unified, relative to the sectoral system, supervisory systems. The coefficients of GOODGOV are significant when FSI = 3 regardless of the specifications. This is not surprising because countries which adopt unified supervision, such as Denmark, Norway, Sweden and the U.K. have very good
gov-ernance. To a lesser degree, so do Japan and Korea.18 Thus, there is a good governance
effect; countries with good governance are inclined to adopt unified supervision.
Also, when we use the small sample size of only 41 countries, the bank restriction variables become significant. For both FSI = 2 and 3, BANK-R is overwhelmingly significantly negative, whereas BANK-S and BANK-I are overwhelmingly significantly positive. Accordingly, a country which allows its bank to engage in real estate tends to adopt sectoral supervision. Furthermore, because of positive coefficients of BANK-S and BANK-I, a country which prohibits its banks to engage in securities and insurance are prone to adopt partial and unified supervisions. This contradicts the “blurring of the distinction effect” but supports the alternative. That is, most countries, which allow their banks to engage in security and insurance activities, adopt sectoral supervision. For example, Germany in our case, allowing banks to engage in these two non-bank activities but adopts only partial supervisory system. Thus, whether a country adopts a unified supervisory system clearly depends on many factors and are not completely linked to the mentioned blurring effect.
6
Conclusions
We classify the sample of countries on the basis of sectoral, partial and unified supervi-sions systems. The main findings of our study are the following.
First, the most striking results of our study is the evidence contradicting our earlier assertion. That is, those countries allow banks to engage in securities and insurance should be the most urgent to adopt unified supervision. Empirical results, however, lead little support for this assertion. That is, there is a “reverse central bank effect”.
18Taiwan has not yet been included in this group because it will join the unified supervision club in
Countries whose central bank also supervises banks tend to adopt sectoral supervision. This result is robust regardless of sample size and specifications
Second, “the scale effect” is half-supported because coefficients of population are sig-nificant only when FSI = 2. Countries with a higher population prefer sectoral supervision to partial supervision. This is a marginal robust factor.
Third, “the poor country effect” is rejected because it is the rich countries, not the poor ones, that prefer unified supervision. Poor countries are prone to adopt sectoral supervision.
Fourth, similar to the conclusion drawn from the third determinant, developed coun-tries tend not to adopt sectoral supervision but prefer unified supervision. Less developed countries, on the other hand, tend to adopt partial but not unified supervision.
Fifth, central and eastern European countries prefer sectoral to unified supervision, which is our “CEE effect”.
As for the sixth determinant, a less developed country with its central bank (LDC×CB) supervising is are inclined to adopt partial supervision. A LDC without its central bank supervising banks has no effect on the choice of supervisory system.
Turning to the seventh determinant, Given this evidence together with the above evidence from DC alone, what we can conclude is that developed countries when their central bank are not supervising banks tend to adopt unified supervision; conversely, they tend to adopt sectoral supervision when their central banks do not supervise banks.
“The reverse blurring of distinction effect” is found when banks are restricted in engaging in securities business. That is, a country whose banks are not allowed to engage in security and insurance activities tends to adopt partial and unified supervisions. By contrast, when banks in a country are not allowed to engage in real estate activity, the
country tends to adopt sectoral supervisory system.
Ninth, in regard to the OSPI and the PMI, the former has no effect, whereas the latter is positively significant for both FSIs. A country with good private market discipline tends to adopt the partial and unified supervision.
Finally, “the good governance effect” does indeed exist. A country with good gover-nance tends to adopt the unified supervision, probably because this type of supervision desires full cooperation and coordination.
Our research is the first step systematically study the determinants of financial super-visory system. Future studies can study the performance of banks in different financial system.
References
Abrams, R. K. and M. W. Taylor (2000), Issues in the unification of financial sector supervision, working paper, IMF
Abrams, R. K. and M. W. Taylor (2001), Assessing the Case for Unified Sector Super-vision, Risk Management and Insurance International Conference, 2001.
Barth, J. R., G. Caprio Jr., and R. Levine (1998), Financial Regulation and Perfor-mance: Cross Country Evidence, The World Bank WP. 2037
Barth, J. R., L. G. Dopico, D. E. Nolle and J. W. Wilcox, (2001), An International Com-parison of the Structure of Bank Supervision, The Future of Financial Regulation in Taiwan, Taipei, July 6.
Barth, J. R., L. G. Dopico, D. E. Nolle and J. A. Wilcox (2001), Bank Safety and Soundness and the Structure of Bank Supervision: A Cross-Country Analysis, FMA Annual Meeting, Toronto, Canada, V1.5
Barth, J. R., G. Caprio Jr., and R. Levine (2001), “Banking Systems Around the Globe: Do Regulation and Ownership Affect Performance and Stability?” in F. S. Mishkin, Editor: Prudential Supervision: What Works and What Doesn’t?” University of Chicago Press
Barth, J. R., G. Capiro, Jr. and R. Levine (2004), Bank Regulation and Supervision: What Works Best? Journal of Financial Intermediation, 13, 205-248
Basel Committee on Banking Supervision (2001), The Relationship Between Banking Supervisors and Banks’ External Auditors, Consultative Paper issued by the Basel Committee on Banking Supervision and the International Federation of Accoun-tants.
Beck, T., Demirg¨u¸c-Kunt, A., R. Levine (2001), ”The Financial Structure Database”. in Demirg¨u¸c-Kunt and Levine, Editor: Financial Structure and Economic Growth: A Cross-Country Comparison of Banks, Markets, and Development, MIT Press, Cambridge, MA, 17-80
Bikker, J. and I. van Lelyveld (2003), Economic versus Regulatory Capital for Financial Conglomerates, in Kuppens, Prast and Wesseling (ed.), Banking Supervision at the Crossroads. Edward Elgar, USA
Briaut, C. (1999), The Rationale for a Single National Financial Services Regulator, Financial Services Authority, Occasional Paper No.2, London, Financial Services Authority.
Briault, C. (2002), Revisiting the Rationale for a Single National Financial Services Regulator, the Financial Services Authority Occasional Paper, series 16.
Carmichael, J. (2001), Experiences With Integrated Regulation, the Financial Regula-tor, vol. 6.
Courtis, N. (2002), How Countries Supervise their Banks, Insurers and Securities Mar-ket, Central Banking Publications, and various issues.
De Krivoy, R., Reforming Bank Supervision in Developing Countries.
Di Noia, C. and G. Di Giorgio (1999), Should Banking Supervision and Monetary Policy Tasks Be Ginven to Different Agencies?, The EUI workshop on Macroeconomic Policy After EMU, Florence, April 30th, 1999.
Giddy, I. H. (1994), Who Should Be the Banking Supervisors, The Seminar on Current Legal Issues Affecting Central Banks, IMF.
Goodhart, C. A. E., Hartmann, P., Llewellyn, D. T., Rojas-Suarez, L. and Weisbrod, S. (1998), Financial-Regulation, Routledge, London and New York.
Goodhart, C. A. E. (1995), Some Regulatory Concerns, London School of Economics Financial Markets Group, Special Paper, no.79.
Goodhart, C. A. E. and D. Schoenmaker (1995), Should the Functions of Monetary Policy and Banking Supervision Be Separated? Oxford Economic Paper 47, pp.539-560.
Ioannidou, V. (2002), Does Monetary Policy Affect the Central Bank’s Role in Bank Supervision? Center and Department of Economics, Tilbury University, no. 2002-54.
Ioannidou, V. P. (2002), Does Monetary Policy Affect the Central Bank’s Role in Bank Supervision? Center, and Department of Economics, Tilburg University.
La Porta, R., F. Lopez-de-Silanes, A. Shleifer and R. W. Vishny (1998), Law and Finance, Journal of Political Economy, 1998, 106, 1113-1148
Lee, L. F. (1983), Generalized Econometric Models with Selectivity, Econometrica, 51, 507-512.
Lelyveld, I. V. and A. Schilder, (2002), Risk in Financial Conglomerate: Measurement and Supervision, Research Series Supervision No. 49, De Nederlandsche Bank Llewellyn, D. T., 1999, Introduction: the Institutional Structure of Regulatory Agencies,
in N. Courtis(ed.), How Countries Supervise Their Banks,Insurers,and Securities Markets, London: Central Bank Publications, xi-xix.
Masciandaro, D. (2004), Unification in Financial Sector Supervision: The Trade-Off Between Central Bank and Single Authority, forthcoming in Journal of Financial Regulation and Compliance, 12, 2
Mooij, J and H. Prast (2003), A Brief History of the Institutional Design of Banking Supervision in the Netherlands. in Kuppens, Prast and Wesseling (ed.), Banking Supervision at the Crossroads. Edward Elgar, USA
Roe, M. J. Strong Managers and W. Owners (1994), The Political Roots of American Corporate Finance, Princeton, N. J., Princeton Univ. Press
Romano, R. (1997), The Political Dynamics of Derivative Securities Regulation, Yale Journal of Regulation, vol.1.
Sanio, J. (2003), The New Single Regulator in Germany, in Kuppens, Prast and Wes-seling (ed.), Banking Supervision at the Crossroads. Edward Elgar, USA
Shen, C. H. (2002), Changes of Financial Supervisions in Taiwan, paper presented in 2nd conference of capital market, Taipei
Shen, C. H. and Y. Y. Chang (2002), Bank Regulations, Bank Performance and Gov-ernance: A Global Study, Economic Essay, Academic Sinica, Taiwan. 30, 277-310 Shen, C. H. and H. L. Chih (2005), Investor Protection, Prospect Theory, and Earnings
Management: An International Comparison of the Banking Industry, Journal of Banking and Finance, forthcoming
Taylor, M. and A. Fleming (1999), Integrated Financial Supervision:Lessons of Northern European Experience, The FPSI Network of the World Bank.
Taylor, M. (1996), Peak Practice: How to Reform the United Kingdom’s Regulatory System, Centre for the Study of Financial Innovation, London, October.
Taylor, M. (1995), Twin Peaks: A Regulatory Structure for the New Century, Centre for the Study of Financial Innovation, London.
Taylor, M. and A. Fleming (1999), Integrated Financial Supervision:Lessons from North-ern European Experience, World Bank, Policy Research Working Paper, no. 2223. Tuya, J. and L. Zamalloa (1994), Issues on Placing Banking Supervision in the Central Bank, in T. Bali˜no and C. Cottarelli (eds), Frameworks for Monetary Authority Stability, IMF
Wall, L. D. and R. A. Eisenbeis (2000), Financial Regulatory Structure and the Reso-lution of Conflicting Goals, Journal of Financial Services Research 17:1, 223-245. Zwet, A. van der (2003), The Blurring of Distinctions between Financial Sectors: Fact
Table 1: Variable Definitions and Sources
Focused Variables
Variable Definition Contents Source
FSI Financial integration 1: no integration; Courtis (2002) of supervision 2: partial; 3: full
CB Central bank also 0-1; 1 is yes; and 0 is no Courtis (2002) supervising banks
Development of Country
DC Developed countries 1: yes; 0: no United Nation website LDC Less Developed countries 1: yes; 0: no United Nation website CEE Central and Eastern 1: yes; 0: no United Nation website
European countries Scale and Wealth of Country
GDPper GDP per capita WDI
POPULA Population IFS
Bank Restrictions
Bank-S Restriction on Bank’s 1: unrestricted; 2: permitted; Barth et al. (2001) Investment Activities 3: restricted; and 4: prohibited
Bank-I Restriction on Bank’s same as above Barth et al. (2001) Insurance Activities
Bank-R Restriction on Bank’s same as above Barth et al. (2001) Real Estate Activities
Institutional Variables
GoodGov Good Government 0-50, Sum of eff. of judic. LLSV (1998) Index system, rule of law,
corru-ption, risk of expropriation risk of contract repudiation
OSPI Official Supervision 0-16, Sum of prompt correc Barth et al. (2004) Power Index tive action, restructuring
power and declaring insolvency power
PMI Private Monitoring 0-10, Sum of a required certified audit Barth et al. (2004) Indexc required, percent of 10
big-gest bank rated, no explicit deposit insurance, bank acc-ounting, disclosure of off-sheet, disclosure of risk IFS: International Financial Statistics, 2000, IMF
Table 2: Countries of Financial Integration of Supervision Sectoral Integration (56)
CB Albania Algeria Argentina Bahamas Bahrain supervises Bangladesh Barbados Botswana Brazil Bulgaria banks (47) China1 Croatia Czech Rep. Egypt Ghana
Greece Hong Kong India Israel Italy Jamaica Jordan Kazakhastan Lithuania Mauritius
Nepal Netherlands2 New Zealand Nigeria Oman
Pakistan Papua New Guin. Philippines Portugal Romania Russian Rep. Slovenia Spain Sri Lanka Taiwan3
Tanzania Thailand Trinidad & Tunisia Ukraine USA Zambia Tobago
CB does not Costa Rica France Germany4 Indonesia Latvia
supervise (9) Panama Poland Venezuela Turkey Partial Integration (35)
Bank & Insurance (18)
CB supervises Colombia Ethiopia Gambia Honduras Macao Paraguay Sierra Leone Suriname
CB does not Australia5 Austria Canada Cayman Is. El Salvador supervise Gibraltar Guatemala Iceland Malaysia Peru Bank & Security (14)
CB supervises Bermuda Cyprus Dominican Rep. Guyana Ireland Saudi Arabia United Arab Emirates
Mexico
CB does not Belgium Finland6 Hungary Ireland7 Luxembourg
supervise Switzerland Insurance & Security (3)
CB supervises South Africa CB does not
supervise Bolivia Chile Unified Integration (10)
CB supervises Malta8 Netherlands Antilles8 Singapore Uruguay9
CB does not Japan10 Denmark Norway South Korea10 Sweden supervise U.K.
Sources are mainly from Courtis (2002) and websites.
This classification of financial supervision is based on his 2001 and earlier surveys. 1. China moved to sectoral supervisor in 1998.
2. Netherlands adopts functional supervision by merging banking and insurance supervision on April 2004. 3. Taiwan adopts unified supervision club on July 1, 2004
4. Germany adopted a modified unified supervision in May, 2002. 5. Australia adopted functional supervision.
6. See Taylor and Fleming (1999) but Finland’s supervision is subject to conflicting reports. 7. The Central Bank of Ireland took charge of the three supervisions in April 2002.
8. These are small countries; thus, central banks are in charge of all types of supervision all supervision. 9. Also, see Taylor and Fleming (1999).
Table 3: Basic Statistics I: FSI, Basic Features and Scales
FSI and Basic Features of Countries
Sectoral Partial Unified Sum Supervision Supervision Supervision
CB Sup. Number 47 16 4
CB Not Sup. Number 9 19 6 101
CD Number 9 9 5
LDC Number 36 25 5
CEE Number 11 1 0 101
CB Sup. and is a DC Number 7 1 0 CB Sup. and is a LDC Number 31 15 4
CB Sup. and is a CEE Number 9 0 0 101 CB Not and is a DC Number 2 8 5
CB Not and is a LDC Number 5 10 1
CB Not and is a LDC Number 2 1 0 101
FSI and Scale of Countries
GDPper median 3,139.10 5,120.00 21,673.60 mean 6,931.96 12,903.55 21,145.17 std. dev. 8,682.64 14,955.26 14,575.37 number 56. 33. 9. 98 Population median 17.01 6.25 6.34 mean 78.59 13.92 23.68 std. dev. 212.45 20.26 40.19 number 56. 35. 10. 100 Note:
1. CB Sup. means that the central bank also supervises banks. 2. CB Not means that a central bank does not supervise banks.
3. DC, LDC and CEE denote developed, less developed and central and eastern European countries, respectively.
3. GDPper is GDP per capita. 4. Population size is million.
6. Number is the number of countries belonging to this category. 7. std. dev. is the standard deviation.
Table 4: Determinants of Supervision I: the Whole Sample Size
1A 1B 1C
FSI = 2 FSI = 3 FSI = 2 FSI = 3 FSI =2 FSI = 3 Constant 0.125 –1.355 0.723*** –0.554*** 0.424 –0.819 (0.48) (0.05) (2.85) (3.48) (1.44) (1.20) CB –1.954*** –1.973*** –1.996*** –2.032*** –1.909*** –2.138*** (4.06) (2.85) (4.11) (3.76) (4.29) (3.36) DC –0.718 -0.275 0.714 1.485*** –0.109 0.545 (1.13) (0.01) (1.44) (2.66) (0.14) (0.48) LDC 0.639** 0.279 0.974*** 0.957*** 0.848*** 0.731*** (1.98) (0.01) (2.96) (3.59) (2.76) (2.67) CEE –1.593** –14.999 –1.661* –17.089*** –1.617* –15.164 (2.03) (0.03) (1.96) (3.49) (1.94) (1.08) GDPper 0.0001** 0.0001*** 0.000 0.0001** (2.09) (2.58) (1.51) (2.28) POPULA –0.031*** –0.001 –0.029*** –0.003 (2.90) (0.13) (3.05) (0.23) Number 98 101 98 Log-Likelihood –72.46 –70.43 –65.51 absolute t−value in parentheses.
Table 5: Determinants of Supervision II: Whole Sample
2A 2B 2C
FSI = 2 FSI =3 FSI = 2 FSI = 3 FSI = 2 FSI =3 Constant 0.495 –0.929 0.612*** –0.893* 0.754*** –0.607 (0.48) (0.58) ( 2.70) ( 1.90) (2.66) (1.38) CB –12.487*** –2.447*** –12.878*** –1.929*** –12.920*** –2.147*** (4.47) (2.52) (16.53) ( 3.08) (16.04) (3.34) DC 1.651 3.194 1.472* 2.155*** 2.113* 3.270*** (0.76) (1.22) ( 1.89) ( 2.38) (1.79) (3.61) LDC 0.214 –0.469 0.460 –0.493 0.438 –0.588 (0.14) (0.24) ( 0.77) ( 0.55) (1.60) (0.86) CEE –1.102 –17.047*** –0.954 -13.100*** –1.010 –12.997*** (0.72) (3.64) ( 0.89) ( 9.77) (1.08) (4.75) GDPper –0.0001 –0.000 –0.000 –0.0001** (0.43) (0.67) (0.78) (2.13) POPULA –0.021*** –0.008 –0.022** –0.007 ( 2.42) ( 0.73) (2.38) (0.66) CB × GDPper -0.0001 –0.000 –0.000 –0.000 –0.0001*** –0.000 (0.83) (0.48) ( 4.09) ( 1.52) (6.29) (1.32) CB× DC 5.578 –12.088*** 5.259 –9.876*** 4.516 –11.999*** (1.52) (3.76) ( 1.04) ( 7.69) (1.26) (4.27) CB× LDC 10.560*** 0.486 11.287*** 0.387 11.206*** 0.383 (4.78) (0.58) (46.95) ( 0.49) (11.08) (0.52) CB× DC ×GDPper 0.000 –0.0001*** 0.000*** –0.000*** 0.0001*** –0.0001*** (1.08) (3.80) ( 2.89) ( 6.37) (3.08) (4.31) CB× LDC ×GDPper 0.000 0.0001* 0.000*** 0.000*** 0.0001*** 0.0001*** (1.15) (1.82) ( 4.20) ( 3.83) (3.89) (4.86) Number 98 98 98 Log-Likelihood –68.05 –64.18 –63.96 absolute t−value in parentheses.
Table 6: Determinants of Supervision VI: Small Sample
3A 3B 3C
FSI = 2 FSI =3 FSI = 2 FSI =3 FSI = 2 FSI = 3 Constant –0.062 –6.049** –8.873 –22.459*** –0.583 –1.423 (0.02) (1.94) (1.57) (2.45) (0.61) (1.05) CB –3.761*** –2.770** –7.583*** –10.965*** –13.414*** –3.091*** (3.17) (1.95) (2.65) (2.48) (13.44) (3.21 ) DC 0.336 –6.339* –8.295 –24.635*** –0.691 –1.905 (0.10) (1.79) (1.41) (2.40) (0.40) (0.90) LDC –0.426 –5.742 –9.528* –19.913*** –1.055 –1.344 (0.16) (2.04) (1.69) (2.42) (0.99) (0.88) CEE –2.017 15.300*** (1.35) (8.89) GDPper –0.0001 –0.0001 –0.0001 –0.0001 (0.73) (1.16) (0.98) (0.94) Population –0.050*** –0.043* (2.46) (1.80) CB × GDPper –0.0001*** -0.00001 (4.72) (0.16) CB× DC 5.509*** -9.270*** (2.254) (5.49) CB× LDC 10.444*** -1.058 (7.49) (0.87) CB× DC ×GDPper 0.0004*** -0.0003*** (4.31) (5.10) CB× LDC ×GDPper 0.0004*** 0.0003*** (5.66) (2.86) BANK-S 2.338** 3.908*** 2.519* 5.463** (2.16) (2.83) (1.71) (2.22) BANK-I 1.261** 1.069* 2.895 4.396*** (2.15) (1.65) (2.20) (2.35) BANK-R –1.862*** –2.175*** –3.421** –6.567** (2.92) (2.84) (2.21) (2.28) OSPI –0.132 –0.257 –0.009 –0.179 (0.55) (0.80) (0.09) (1.09) PMI 1.913** 1.991** 0.382* 0.553* (2.24) (2.04) (1.68) (1.70) GOODGOV 0.005 0.226** 0.169 0.796** (0.05) (2.02) (0.68) (2.12) Number 46 46 41 41 69 69 Log-Likelihood –25.99 –16.21 –42.79 absolute t−value in parentheses.
Appendix
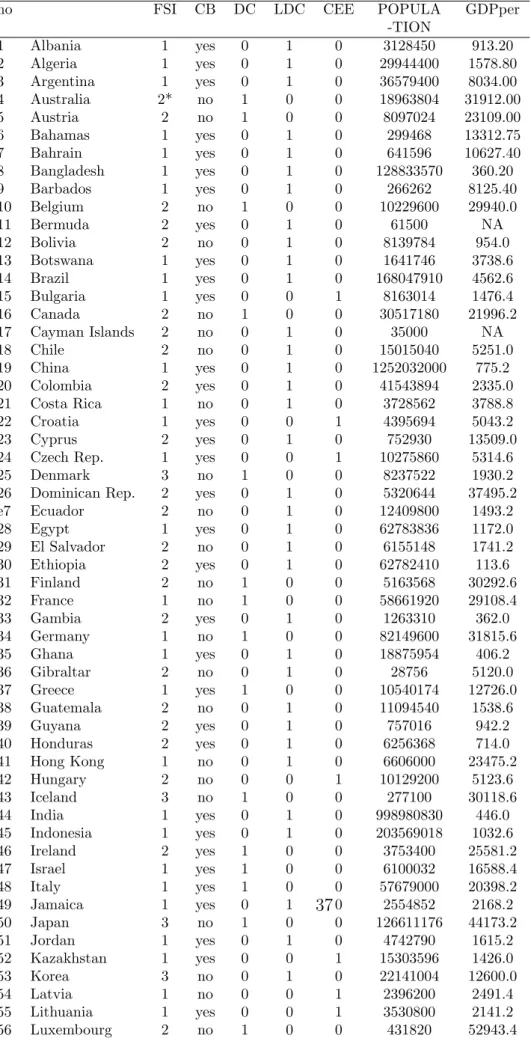
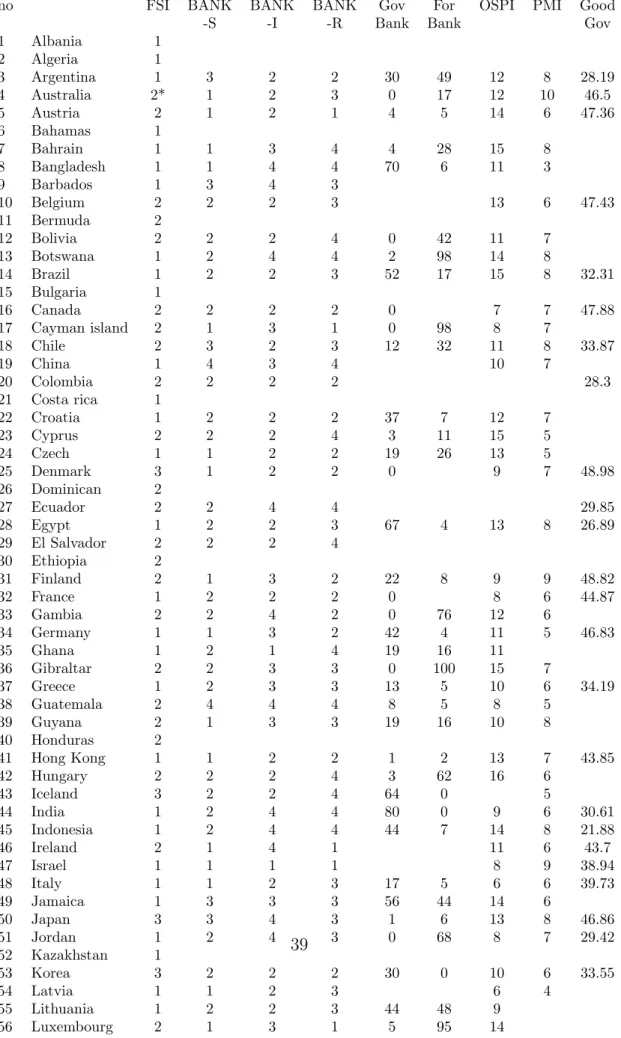
Table A1: Supervision, CB and Scale of Countries: Whole Set of Countries no FSI CB DC LDC CEE POPULA GDPper
-TION 1 Albania 1 yes 0 1 0 3128450 913.20 2 Algeria 1 yes 0 1 0 29944400 1578.80 3 Argentina 1 yes 0 1 0 36579400 8034.00 4 Australia 2* no 1 0 0 18963804 31912.00 5 Austria 2 no 1 0 0 8097024 23109.00 6 Bahamas 1 yes 0 1 0 299468 13312.75 7 Bahrain 1 yes 0 1 0 641596 10627.40 8 Bangladesh 1 yes 0 1 0 128833570 360.20 9 Barbados 1 yes 0 1 0 266262 8125.40 10 Belgium 2 no 1 0 0 10229600 29940.0 11 Bermuda 2 yes 0 1 0 61500 NA 12 Bolivia 2 no 0 1 0 8139784 954.0 13 Botswana 1 yes 0 1 0 1641746 3738.6 14 Brazil 1 yes 0 1 0 168047910 4562.6 15 Bulgaria 1 yes 0 0 1 8163014 1476.4 16 Canada 2 no 1 0 0 30517180 21996.2 17 Cayman Islands 2 no 0 1 0 35000 NA 18 Chile 2 no 0 1 0 15015040 5251.0 19 China 1 yes 0 1 0 1252032000 775.2 20 Colombia 2 yes 0 1 0 41543894 2335.0 21 Costa Rica 1 no 0 1 0 3728562 3788.8 22 Croatia 1 yes 0 0 1 4395694 5043.2 23 Cyprus 2 yes 0 1 0 752930 13509.0 24 Czech Rep. 1 yes 0 0 1 10275860 5314.6 25 Denmark 3 no 1 0 0 8237522 1930.2 26 Dominican Rep. 2 yes 0 1 0 5320644 37495.2 e7 Ecuador 2 no 0 1 0 12409800 1493.2 28 Egypt 1 yes 0 1 0 62783836 1172.0 29 El Salvador 2 no 0 1 0 6155148 1741.2 30 Ethiopia 2 yes 0 1 0 62782410 113.6 31 Finland 2 no 1 0 0 5163568 30292.6 32 France 1 no 1 0 0 58661920 29108.4 33 Gambia 2 yes 0 1 0 1263310 362.0 34 Germany 1 no 1 0 0 82149600 31815.6 35 Ghana 1 yes 0 1 0 18875954 406.2 36 Gibraltar 2 no 0 1 0 28756 5120.0 37 Greece 1 yes 1 0 0 10540174 12726.0 38 Guatemala 2 no 0 1 0 11094540 1538.6 39 Guyana 2 yes 0 1 0 757016 942.2 40 Honduras 2 yes 0 1 0 6256368 714.0 41 Hong Kong 1 no 0 1 0 6606000 23475.2 42 Hungary 2 no 0 0 1 10129200 5123.6 43 Iceland 3 no 1 0 0 277100 30118.6 44 India 1 yes 0 1 0 998980830 446.0 45 Indonesia 1 yes 0 1 0 203569018 1032.6 46 Ireland 2 yes 1 0 0 3753400 25581.2 47 Israel 1 yes 1 0 0 6100032 16588.4 48 Italy 1 yes 1 0 0 57679000 20398.2 49 Jamaica 1 yes 0 1 0 2554852 2168.2 50 Japan 3 no 1 0 0 126611176 44173.2 51 Jordan 1 yes 0 1 0 4742790 1615.2 52 Kazakhstan 1 yes 0 0 1 15303596 1426.0 53 Korea 3 no 0 1 0 22141004 12600.0 54 Latvia 1 no 0 0 1 2396200 2491.4 37
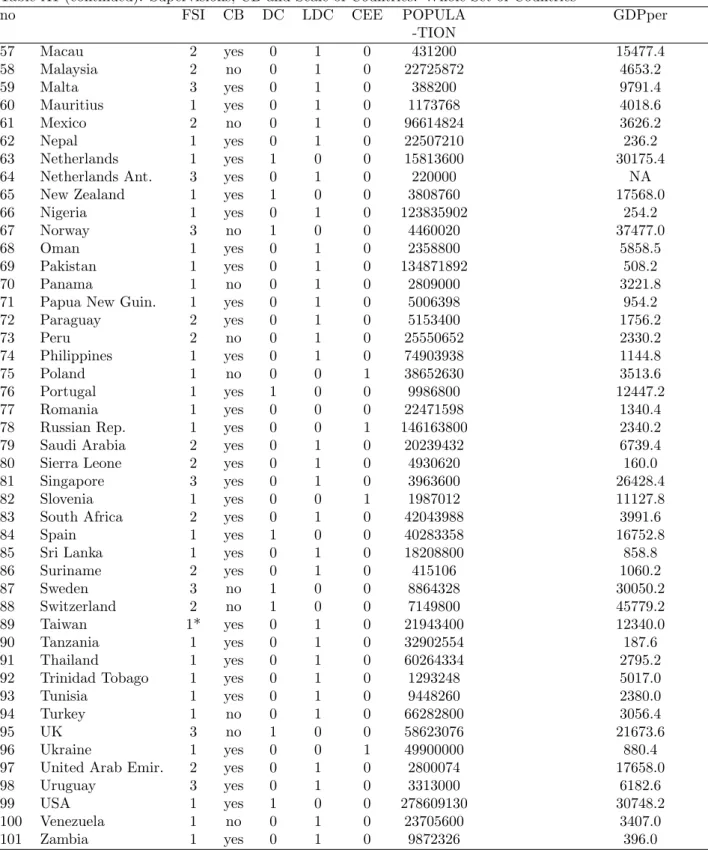
Table A1 (continued): Supervisions, CB and Scale of Countries: Whole Set of Countries
no FSI CB DC LDC CEE POPULA GDPper -TION 57 Macau 2 yes 0 1 0 431200 15477.4 58 Malaysia 2 no 0 1 0 22725872 4653.2 59 Malta 3 yes 0 1 0 388200 9791.4 60 Mauritius 1 yes 0 1 0 1173768 4018.6 61 Mexico 2 no 0 1 0 96614824 3626.2 62 Nepal 1 yes 0 1 0 22507210 236.2 63 Netherlands 1 yes 1 0 0 15813600 30175.4 64 Netherlands Ant. 3 yes 0 1 0 220000 NA 65 New Zealand 1 yes 1 0 0 3808760 17568.0 66 Nigeria 1 yes 0 1 0 123835902 254.2 67 Norway 3 no 1 0 0 4460020 37477.0 68 Oman 1 yes 0 1 0 2358800 5858.5 69 Pakistan 1 yes 0 1 0 134871892 508.2 70 Panama 1 no 0 1 0 2809000 3221.8 71 Papua New Guin. 1 yes 0 1 0 5006398 954.2 72 Paraguay 2 yes 0 1 0 5153400 1756.2 73 Peru 2 no 0 1 0 25550652 2330.2 74 Philippines 1 yes 0 1 0 74903938 1144.8 75 Poland 1 no 0 0 1 38652630 3513.6 76 Portugal 1 yes 1 0 0 9986800 12447.2 77 Romania 1 yes 0 0 0 22471598 1340.4 78 Russian Rep. 1 yes 0 0 1 146163800 2340.2 79 Saudi Arabia 2 yes 0 1 0 20239432 6739.4 80 Sierra Leone 2 yes 0 1 0 4930620 160.0 81 Singapore 3 yes 0 1 0 3963600 26428.4 82 Slovenia 1 yes 0 0 1 1987012 11127.8 83 South Africa 2 yes 0 1 0 42043988 3991.6 84 Spain 1 yes 1 0 0 40283358 16752.8 85 Sri Lanka 1 yes 0 1 0 18208800 858.8 86 Suriname 2 yes 0 1 0 415106 1060.2 87 Sweden 3 no 1 0 0 8864328 30050.2 88 Switzerland 2 no 1 0 0 7149800 45779.2 89 Taiwan 1* yes 0 1 0 21943400 12340.0 90 Tanzania 1 yes 0 1 0 32902554 187.6 91 Thailand 1 yes 0 1 0 60264334 2795.2 92 Trinidad Tobago 1 yes 0 1 0 1293248 5017.0 93 Tunisia 1 yes 0 1 0 9448260 2380.0 94 Turkey 1 no 0 1 0 66282800 3056.4
95 UK 3 no 1 0 0 58623076 21673.6
96 Ukraine 1 yes 0 0 1 49900000 880.4 97 United Arab Emir. 2 yes 0 1 0 2800074 17658.0 98 Uruguay 3 yes 0 1 0 3313000 6182.6 99 USA 1 yes 1 0 0 278609130 30748.2 100 Venezuela 1 no 0 1 0 23705600 3407.0 101 Zambia 1 yes 0 1 0 9872326 396.0 CB: yes means the central bank is in charge of bank supervision; no means it does not.
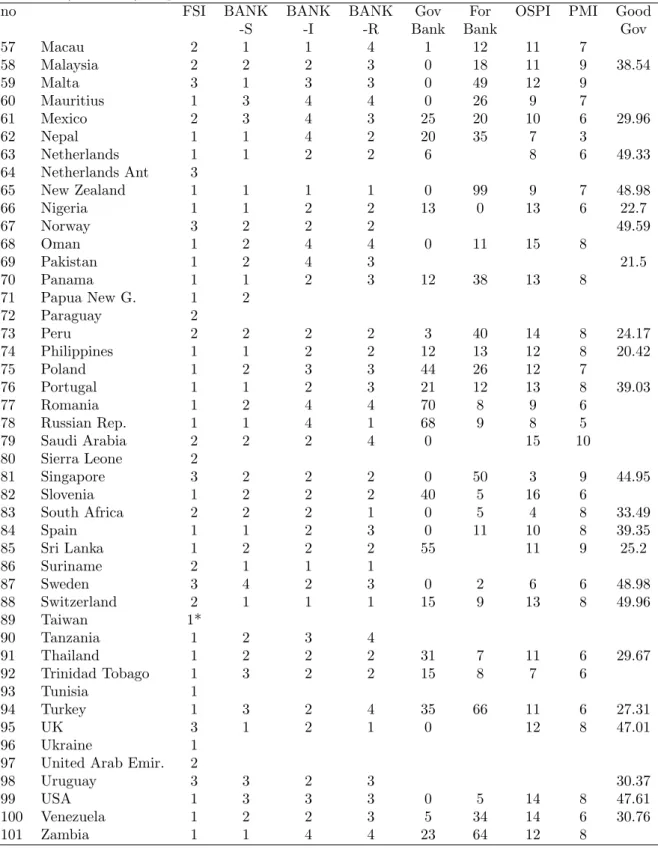
Table A2: Supervisions, Restrictions: Subset of Countries
no FSI BANK BANK BANK Gov For OSPI PMI Good -S -I -R Bank Bank Gov 1 Albania 1 2 Algeria 1 3 Argentina 1 3 2 2 30 49 12 8 28.19 4 Australia 2* 1 2 3 0 17 12 10 46.5 5 Austria 2 1 2 1 4 5 14 6 47.36 6 Bahamas 1 7 Bahrain 1 1 3 4 4 28 15 8 8 Bangladesh 1 1 4 4 70 6 11 3 9 Barbados 1 3 4 3 10 Belgium 2 2 2 3 13 6 47.43 11 Bermuda 2 12 Bolivia 2 2 2 4 0 42 11 7 13 Botswana 1 2 4 4 2 98 14 8 14 Brazil 1 2 2 3 52 17 15 8 32.31 15 Bulgaria 1 16 Canada 2 2 2 2 0 7 7 47.88 17 Cayman island 2 1 3 1 0 98 8 7 18 Chile 2 3 2 3 12 32 11 8 33.87 19 China 1 4 3 4 10 7 20 Colombia 2 2 2 2 28.3 21 Costa rica 1 22 Croatia 1 2 2 2 37 7 12 7 23 Cyprus 2 2 2 4 3 11 15 5 24 Czech 1 1 2 2 19 26 13 5 25 Denmark 3 1 2 2 0 9 7 48.98 26 Dominican 2 27 Ecuador 2 2 4 4 29.85 28 Egypt 1 2 2 3 67 4 13 8 26.89 29 El Salvador 2 2 2 4 30 Ethiopia 2 31 Finland 2 1 3 2 22 8 9 9 48.82 32 France 1 2 2 2 0 8 6 44.87 33 Gambia 2 2 4 2 0 76 12 6 34 Germany 1 1 3 2 42 4 11 5 46.83 35 Ghana 1 2 1 4 19 16 11 36 Gibraltar 2 2 3 3 0 100 15 7 37 Greece 1 2 3 3 13 5 10 6 34.19 38 Guatemala 2 4 4 4 8 5 8 5 39 Guyana 2 1 3 3 19 16 10 8 40 Honduras 2 41 Hong Kong 1 1 2 2 1 2 13 7 43.85 42 Hungary 2 2 2 4 3 62 16 6 43 Iceland 3 2 2 4 64 0 5 44 India 1 2 4 4 80 0 9 6 30.61 45 Indonesia 1 2 4 4 44 7 14 8 21.88 46 Ireland 2 1 4 1 11 6 43.7 47 Israel 1 1 1 1 8 9 38.94 48 Italy 1 1 2 3 17 5 6 6 39.73 49 Jamaica 1 3 3 3 56 44 14 6 50 Japan 3 3 4 3 1 6 13 8 46.86 51 Jordan 1 2 4 3 0 68 8 7 29.42 52 Kazakhstan 1 53 Korea 3 2 2 2 30 0 10 6 33.55 54 Latvia 1 1 2 3 6 4 39