Abstract
The detection of crack development in masonry wall is an important task for investigating the earthquake resistant capability of masonry structures. Traditionally, the work is done by manual observation and documenting, which are inaccurate and time-consuming. The well-known measurement technology of crack observation utilizes the strain gauge or elongation meters. However, these methods usually fail in prediction of crack position. Other precise technologies require austere test conditions, which make them unrealistic.
The present study attempted utilizing the digital image correlation (DIC) technique to identify the crack development. The DIC is a new developed non-contact-type measurement technique. The advantage of this technique is that the whole displacement and strain field can be analyzed and the sample will not be disturbed. It compares two photos of specimens without and under loading respectively. By optimizing the correlation coefficient of the two images, the optimal parameters of the displacement filed are identified. The strain field is then obtained. Subsequently, the crack can be found out by identifying the significant variation of strain and/or displacement.
In this paper, a test on one masonry wall sample was performed to verify the performance of the digital image correlation method. The micro cracks are successfully identified by DIC before they can be found manually. The results shows a great application possibility of the DIC in various situations such as shrinkage induced crack of fresh concrete, healthy monitoring of masonry and reinforced concrete structures and safety monitoring of bridges.
Keywords: digital image correlation, crack observation, masonry structure, deformation measurement.
Paper 86
The Application of a Digital Image Correlation Method for
Crack Observation
M.H. Shih†, S.H. Tung‡, J.C. Kuo* and W.P. Sung#
† Department of Construction Engineering, National Kaohsiung First University of Science and Technology, Kaohsiung, Taiwan ‡ Department of Civil and Environmental Engineering
National University of Kaohsiung, Kaohsiung, Taiwan * Department of Materials Science and Engineering National Cheng-Kung University, Tainan, Taiwan # Department of Landscape Design and Management
National Chinyi Institute of Technology, Taichung, Taiwan
©Civil-Comp Press, 2006.
Proceedings of the Eighth International Conference on Computational Structures Technology, B.H.V. Topping, G. Montero and R. Montenegro, (Editors), Civil-Comp Press, Stirlingshire, Scotland.
1 Introduction
Strain distribution is often analyzed in civil engineering and mechanical engineering, etc. In particular, problems with anisotropic materials or stress concentration require essentially important measuring techniques. Of which, digital image correlation method is a latest optical measuring technique, which offers low-cost and high precision strain distribution for a field. Chu et al. [1] developed in 1985 a measuring technology by combining deformation theory and digital image correlation method, and strived to expand the field of applications using interpolation theory. They also demonstrated the applicability with some reference examples. In 1991, Sutton et al. [2, 3] mentioned the noise of common measured data in a research paper. Accordingly, they proposed a method of reducing noise effect. In addition, the measured noise is less than 0.01 pixels based on digital image correlation method.
Many ancient European buildings were built from stone and mortar. To study the behavior of these buildings, French scholars Raffard et al. [5]in 2001 applied digital image correlation method to measure the deformation of mortar, providing a further insight into mortar mechanics. Dost et al.[6, 7] acquired nano-images using an atomic force microscope, which help them not only find out the profiles of nano materials, but also analyze nano-displacement and nano-crack by integrating DIC technique.
Wall quantity has significant influence upon earthquake resistance of structures. According to the survey report for 921 Chichi Earthquake[8], most of sawtooth shaped buildings collapsed almost in parallel with the street, primarily owing to relatively low wall quantity along the street. In view of spatial restriction of such buildings, it is an important task to study how to offer a minimum wall quantity with strong resistance to earthquake. Professor Mao-hsiung Hsu from the National Cheng Kung University is a leading scholar for the behavior study of brick wall. After years of full size tests, his research team found that, no unique conclusion could be made due to big deviation of materials and construction level. If crack formation and development could be accurately measured, it would contribute to definition and identification of the patterns of destruction for a uniform conclusion.
By using digital image correlation method, this paper observed surface deformation of brick wall, and studied the feasible applications of this method on crack observation of solid materials.
2 Theoretical Basis of Strain Analysis via Digital Image
Correlation Method
Firstly, digital image correlation method is used to analyze so-called “structural speckle” on the surface [4], which results in grey scale distribution on image surface. Based on the distribution feature of grey scale, the characteristics of undeformed and
deformed images are compared, and relative position of images inferred accordingly. Thus, displacement vectors of various image points are calculated, while other physical values, such as X-Y strain field, X-Y shear strain and Von Mises strain, can also be inferred.
2.1 Two-Dimensional Digital Image Correlation Method
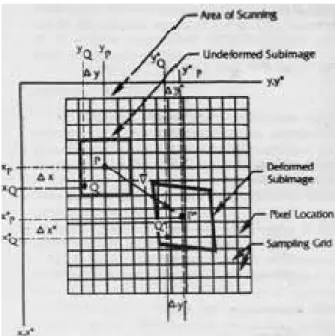
Digital image correlation method is widely applied to the field of image identification technique. By comparing local correlation of two images, the relationship (under assumption of parameter’s functional relationship) of two undeformed and deformed images could be identified. As shown in Figure 1, central point prior to deformation is point P, and then changed to point P* after deformation, with the functional relationship expressed below:
x*= x+u(x,y) (1a) y* = y+v(x,y) (1b)
For undeformed images, finite element method (FEM) is used to divide the images into several sub-images. According to digital image correlation method as shown in Figure 2, the sum of grey scale value of undeformed and deformed secondary images is assumed to the same. Assuming undeformed image is A and deformed image B, the correlation is called as a functional relationship. The level of correlation is defined below [9]:
Figure 1: Schematic drawing of relative location of sub-images of deformed and undeformed images on surface. [8]
2 2 ~ ~ ij ij ij ij g g g g COF Σ ⋅ Σ Σ = (2)
Where, g and ij g~ij is grey scale of image A on coordinate (i, j) and image B on
coordinate (i, j ), respectively. And, coordinate (i,j ) of image B corresponds to
coordinate (i,j) of image A.
If optimum function parameter for every sub-image is recognized by an optimization procedure, the corresponding coordinate of every undeformed and deformed sub-image could be obtained. Accordingly, displacement vector and displacement field can be individually computed.
2.2 Calculation of Strain Field
Green-Lagrange’s tensor E is defined as:
[
1]
2
1 ⊗ −
= F F
E T (3)
Where, F is gradient tensor of displacement field, and I is unit matrix. Tensor E is rewritten into the function of displacement field as follows:[3]
(
i j ji)
ki k j ij u u u u E , , , , 2 1 2 1 + + = (4)Where, i,j,k∈(x,y), and ui,j =δui δj . Strain is computed below: Fig. 2 Schematic Drawing of Sub-images (Grids) on Surface [8]
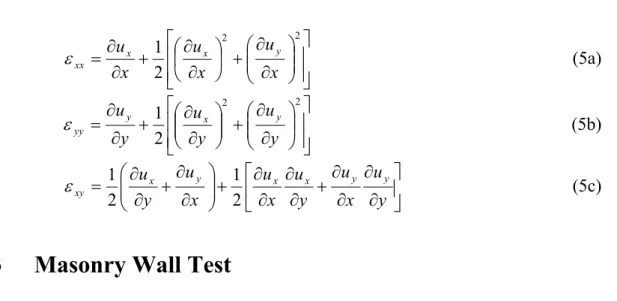
⎥ ⎥ ⎦ ⎤ ⎢ ⎢ ⎣ ⎡ ⎟⎟ ⎠ ⎞ ⎜⎜ ⎝ ⎛ ∂ ∂ + ⎟ ⎠ ⎞ ⎜ ⎝ ⎛ ∂ ∂ + ∂ ∂ = 2 2 2 1 x u x u x ux x y xx ε (5a) ⎥ ⎥ ⎦ ⎤ ⎢ ⎢ ⎣ ⎡ ⎟⎟ ⎠ ⎞ ⎜⎜ ⎝ ⎛ ∂ ∂ + ⎟⎟ ⎠ ⎞ ⎜⎜ ⎝ ⎛ ∂ ∂ + ∂ ∂ = 2 2 2 1 y u y u y uy x y yy ε (5b) ⎥ ⎦ ⎤ ⎢ ⎣ ⎡ ∂ ∂ ∂ ∂ + ∂ ∂ ∂ ∂ + ⎟⎟ ⎠ ⎞ ⎜⎜ ⎝ ⎛ ∂ ∂ + ∂ ∂ = y u x u y u x u x u y ux y x x y y xy 2 1 2 1 ε (5c)
3 Masonry Wall Test
Since brick and cement mortar are brittle materials, crack development process may provide a basis of destruction pattern if this process can be accurately observed from test. Through a test on standard 45° specimen for brick wall, this paper explored the feasibility of crack observation via digital image correlation method.
3.1 Design of Test Block and Loading Method
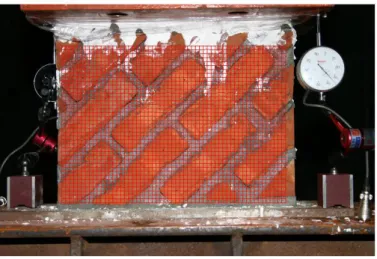
This paper designed a 45° brick wall for test purpose pursuant to DIN EN 1052-1. As illustrated in Figure 3, the brick wall has an external width of 40cm, and height of 30cm. The brick is sized by 19.5×8.7×5cm (L×B×T); and a shrink-free mortar. This test is conducted under the displacement-controlled test method, whereby a MTS hydraulic jack with 1000KN capacity is used to compress via a rigid beam the test block at a speed of 1mm/min, until the bearing force begin to decrease.
Gauge-1
Stiffening beam
Figure 3: Brick wall and test settings vertical loading
Gauge-2
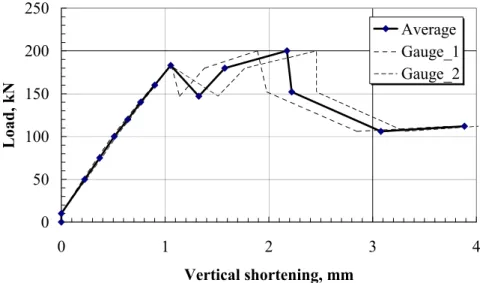
Figure 4: Relationship bearing force and deformation 0 50 100 150 200 250 0 1 2 3 4 Vertical shortening, mm Load, kN Average Gauge_1 Gauge_2
3.2 Test Results
The test process is described in detail below:
(1) No obvious destruction is visualized before 182KN is loaded onto the test block. In the case of 182KN, crack occurs and develops obviously as found from dial gauges and from the voice of breaking. Extremely fine cracks could be visualized at left lower corner of Fig. 3.
(2) In the case of 200KN, load cell of jack indicates the force is no longer increased. So, the limit strength of test block is 200KN. In such case, crack width increases by about 1mm, and gypsum shedding is found at upper part of the test block.
(3) When the stroke of jack is continuously loaded up to 112KN, no more loading capacity could be added. So, this test is completed, but block-like shedding of mortar begins to occur.
A relationship chart of bearing and deformation is drawn from vertical shortening of test block recorded by dial gauge and loading capacity recorded by jack load cell. It is observed from Figure 4 that, when the load is added up to 182KN, the deformation of brick wall increases sharply and load declines perpendicularly, showing occurrence of crack. When the jack is continuously loaded until exceeding original maximum value, it indicates that crack occurred just now has not penetrated the test block. When the load is added to 200KN, original changes (in the case of 182KN) will reoccur. Therefore, this is possibly owing to the fact that original crack increases and leads to penetration, or new crack occurs. When the load ranges between 106KN~112KN, brick wall is compacted by 1mm, indicating the level of destruction.
Figure 5: Typical test photos and analytical range (32 pixels for sub-images) Though major crack occurs at 182KN, it is difficult to identify whether or not finer crack existed previously. Unlike the situation at 182KN, the displacement has not increased when the load declines suddenly at 200KN. Does this variance reflect actual or local destruction of brick wall? This is worthy further study.
As shown in Figure 4, the measured displacement prior to crack formation in gauge-1 is the same as that in gauge-2, but differs markedly when the load reaches 182KN. It is thus judged that, the test block is prone to rotate clockwise, leading to different displacements at both sides of brick wall.
4 Methods of Image Acquisition and Analysis
4.1 Image Acquisition Method
A camera is permanently mounted onto a support rightly in front of the test block (as long as entire test block is covered). To avoid the analysing error induced by manual vibration during image acquisition, shutter release or remote-controlled shooting shall be required to enable high quality image acquisition. Furthermore the forced flash was used in this experiment. The image acquisition instrument in this test is a Canon EOS 300D monocular digital camera with a Canon EF-S 18-55mm f/3.5-5.6 zoom lens (focal length of 55 mm). With a maximum resolution of 3072×2048, the image is stored by JPG format.
4.2 Image Analysis
An analytical software developed by our test team is used for analysing the acquired images, while analytical procedure is prepared according to the principle in Section 2.1. Firstly, it is required to identify the size of sub-image, which has influence upon
Figure 6: Displacement field of 50KN; grid size 32 pixels
the resolution from strain analysis. A higher level of displacement accuracy is often obtained from bigger sub-images, but local strain change cannot be reflected. In this paper, the sub-image is sized in 32 pixels. The actual length of a pixel is 0.19 mm, according to the calibration results from measured photos. The relevant literature [4] also shows that, the analytical accuracy of this procedure is about 0.01 pixels. So, actual displacement resolution is about 0.0019mm. Figure 5 depicts a typical photo in this test process. At later stage of test, the shedding phenomenon of gypsum at lower part of stiffening beam will make it more difficult for analysis. Moreover, owing to extremely big lateral deformation, some brick walls will be shielded by dial gauge at later stage. Thus, a bigger margin is reserved at upper part and right-hand of the test block for analysis purpose.
5 Analytical Results of Digital Images
The distribution of displacement fields and strain fields at different loading phases is obtained from analytical results. The observed results of displacement field are described below.
Figures 6~8 depict displacement fields at early stage of test and various stages of destruction, showing horizontal displacement (x), vertical displacement (y), counterclockwise (z) rotation and displacement vector. At right hand of color scale figure are some numerical units such as pixels (x- and y-translational) and radian (z- rotational), which are converted to actual displacement by multiplying the moving pixels by 0.19mm/pixel.
Figure 7: Displacement field of 182KN; grid size 32 pixels
Figure 8: Displacement field of 200KN; grid size 32 pixels
The following key considerations are induced from the observed results of displacement field:
(1) Different stiffness of brick-mortar composite leads to non-uniform deformation: Figure 6-8 depict non-uniform distribution of x-y translational and z rotational displacement. Since 45°-trend non-uniform distribution matches the laying direction of brick wall, it is possible to identify the validity of image analysis procedure. Vertical displacement has a stepped trend along a vertical line, where the mortar is placed at the staircase. These results account for a much higher stiffness of brick than mortar. And, non-uniform displacement is clearly found even at loading case of 50KN. It can thus be seen that, the analytical procedure developed by our team features a high level of accuracy. Although the cement mortar is very brittle material and only minute deformation can take place in it, the deformation can also be efficiently identified. Since non-uniform displacement due to soft mortar is practically a barrier to crack observation, so how to identify deformed concentration and crack of soft formation is a key focus of image analysis and interpretation.
(2) Correlation between change of displacement field color block and block movement: Crack can be identified according to color change of displacement field pattern. As shown in Figure 6, a region is considered to be a complete block if colour of displacement distribution changes gently. Although color scale change could be obviously found from y displacement pattern in Figure 6 (up to down), it is considered to be a complete object due to smaller variation gradient. Owing to frequent offset of crack along shear direction, even 45° non-uniform displacement requires appropriate 45° shear offset. At left upper corner of Figure 7, two 45° boundary lines are found at left side of X-displacement pattern. The variation gradient isn’t proportional to nearby region. If an unusual boundary line for variation gradient is found in a certain region of displacement field distribution map, it appears not to be complete block, and this boundary line is probably the location of crack.
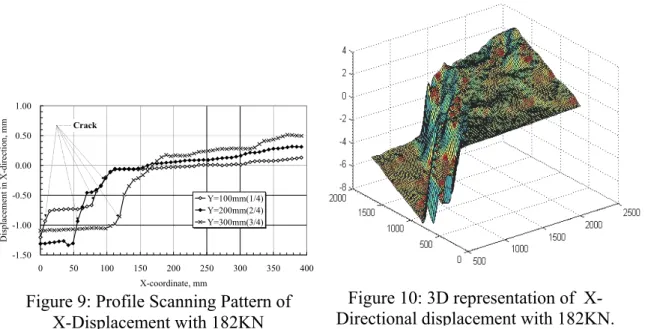
As shown in Figure 7, different displacement at both sides of two boundary lines, which extend at 45°from left lower corner of the displacement pattern, is about 4 and 5 pixels(i.e. 0.8 and 1.0mm). Of which, the upper boundary line will continue to extend upwards, and reach the top after two deflection nearby the top. This phenomenon indicates crack has penetrated the test block. According to the log of test process (Section 3.2), brick wall cracks acoustically and visibly. If observing right upper section along the second boundary line, it turns leftwards by 90°at 1/3 section of the test block, and then turns rightwards. That location is a boundary line between brick and mortar, as found from Figure 5. If you continue to observe rightwards, the section with a uniform color is identified as a complete block. Figure 9 depicts a profile scanning pattern of x-displacement at 1/4, 2/4 and 3/4, while Figure 10 shows a three-dimensional representation. On the profiles of 1/4 and 2/4 of Figure 10, there are found discontinuous changes of two displacements, and a suspected crack on profile 3/4. Only a crack is found from y-displacement pattern, possibly owing to the fact that the second crack is caused by combining shear and thrust offset, and the first crack is a pure shear offset crack.
Figure 10: 3D representation of X-Directional displacement with 182KN. Figure 9: Profile Scanning Pattern of
X-Displacement with 182KN -1.50 -1.00 -0.50 0.00 0.50 1.00 0 50 100 150 200 250 300 350 400 X-coordinate, mm Displac eme nt i n X-dire cti on, mm Y=100mm(1/4) Y=200mm(2/4) Y=300mm(3/4) Crack
(3) Block Rotation matches experimental observation. When crack occurs theoretically on a test block, a relative slippage often exists between two lateral blocks. Thus, it is expected that there shall be an extremely big rotary displacement vector at the point of crack. Secondly, strong rotary displacement can be identified due to the different rigidity between brick and mortar. It can be observed from angular displacement pattern in Figure 6(Rotation), the test block could positively rotate on the interface of brick and mortar, but no crack occurs in this case. In fact, soft mortar is compressed, leading to slight rotation as previously discussed in the second situation. As shown in Figure 11, there is an obvious interface between mortar and brick at 100KN, and also a positive and negative rotation with extremely different absolute values. Of which, counterclockwise rotation occurs at mortar, and clockwise rotation at brick, showing a possible occurrence of crack. From this point, it is clear that crack occurs prior to 182KN, which could be found by image analytical technique earlier than acoustic or visual method.
In addition, the test log in Section 3.2 shows a negative angular displacement of major blocks, indicating the blocks rotate clockwise. Also, Dial-Gauge shows displacement vector at right lower part of test blocks is bigger than that at left side. At 1/4 of Figure 11, a rotary boundary line extends upwards at 45°, and proceeds with elongation even at Figure 8. Besides, a smaller rotation occurs at lower part, which complies with previous conclusion of the location of crack formation. Therefore, rotation diagram is an efficient tool to identify the location of crack formation.
6 Conclusions
A compressive test on a brick-mortar wall is conducted in this research. The authors used the digital image correlation method to analysis the deformation field of the surface. The key point for identifying crack formation is the high deformation concentration. The following results can be drawn according to the observation:
1. Initial crack can be identified through digital image correlation method. 2. Brick wall may lead to non-uniform deformation distribution due to different
material characteristics, which could be found by digital image correlation method.
3. Rotation diagram is an efficient tool to identify the location of cracks.
4. Deformation distribution map at 50KN corresponds to the occurrence points of crack.
Acknowledgement
This work has been supported by the National Science Council of Taiwan, ROC through grant no. NSC94-2625-Z-327-005. This support is gratefully acknowledged.
References
[1] T.C. Chu, W.F. Ranson, M.A. Sutton and W.H. Peters, “Application of Digital-Image-Correlation Techniques to Experimental Mechanics”, Experimental Mechanics, 25(3), pp.232-244, 1985.
[2] M.A. Sutton, J.L. Turner, H.A. Bruck and T.A. Chae, “Full-field Representation of Discretely Sampled Surface Deformation for Displacement and Strain Analysis”, Experimental Mechanics, Vol. 31, pp.168-177, 1991. [3] W.P. Vellinga and S. Onraet, “Measurement of Strain Fields in the Micron
Range”, Proceedings of the joint Meeting of the BVM and the NVvM 2000 in Papendal, Arnhem, pp.110-111, 2000.
[4] S.-H. Tung, J.-C. Kuo, M.-H. Shih, “Strain Distribution Analysis Using Digital-Image-Correlation Techniques”, The Eighteenth KKCNN Symposium on Civil Engineering-NTU29, Taiwan, December 19-21, 2005.
[5] D. Raffard, P. Ienny and J.-P. Henry, “Displacement and Strain Fields at a Stone/Mortar Interface by Digital Image Processing”, Journal of Testing and Evaluation, Vol. 29 (2), pp.115-122, 2001.
[6] M. Dost, D. Vogel, T. Winkler, J. Vogel, R. Erb, E. Kieselstein,“How to detect Edgar Allan Poe’s ‘purloined letter’ - or: Cross correlation algorithms in digitised video images for object identification, movement evaluation and deformation analysis”, Nondestructive Detection and Measurement for Homeland Security, Proceedings of SPIE Vol. 5048, 2003.
[7] M. Dost, N.Rümmler, E. Kieselstein, R. Erb, V. Hillmann, V. Großer, “Correlation Analysis at Grey Scale Patterns in an in-situ Measuring Module for Microsystem Technology”, Materials Mechanics – Fracture Mechanics –
Micromechanics, Eds. T. Winkler, A. Schubert, pp. 259-266, Berlin/ Chemnitz,
1999.
[8] J.B. Shiao et al. (1999) “Report on the Investigation of the Damages due to 921 Chichi Earthquake – Buildings”, National Center for Research on Earthquake Engineering, report no.: NCREE-99-054, Nov. 1999.
[9] T.C. Chu, W.F. Ranson, M.A. Sutton and W.H. Peters, “Application of Digital-Image-Correlation Techniques to Experimental Mechanics”, Experimental Mechanics, 25(3), pp.232-244, 1985.