國
立
交
通
大
學
資訊科學與工程研究所
碩
士
論
文
嵌入式即時編譯器中方法展開之設計與實
作
Design and Implementation of Method Inlining in
Embedded Just-In-Time Compiler
研 究 生:唐心磊
指導教授:單智君 博士
嵌入式即時編譯器中方法展開之設計與實作
學生:唐心磊 指導教授:單智君 博士
國立交通大學資訊工程學系碩士班
摘要
近來有越來越多將 Java 應用於嵌入式系統上的趨勢,例如應用
於手機和個人數位助理(PDA)等。而隨者這些智慧型裝置中使用
Java 應用程式的普及,效能就成為很重要的議題。為了達到更佳的
執行速度,嵌入式 Java 虛擬機器使用了輕量化的即時編譯器,稱
為嵌入式即時編譯器。嵌入式即時編譯器只編譯了簡單的位元組
碼,而複雜的運算例如: 方法呼叫等,則交由直譯器執行。而此設
計方式導致執行方法呼叫的效能低落。本論文中,我們設計並實作
一方法展開的機制,來提高程式執行效能,且讓程式空間的的擴張
在一個合理的範圍內。
我們的方法展開機制除了可以展開傳統的靜態方法外,也結合
了在高效能即時編譯器中的方法展開機制使得虛擬方法也可以被展
開,以利用虛擬方法中單型的特性來提高效能。此外,在單型的假
設被動態類別載入破壞時,我們的回覆機制也使得後續的執行還有
機會重新利用展開過的方法。整體而言,我們的方法展開機制使程
式執行效能增進了
1.43 倍,而只增加少量的系統動態記憶體使用空
間。
Design and Implementation of Method Inlining
in Embedded Just-In-Time Compiler
Student:Shin-Lei Tang Advisor:Dr. Jean Jyh-Jiun Shann Department of Computer Science and Information Engineering
National Chiao-Tung University
Abstract
Recently there has been a growing interest in using Java on embedded portable devices such as cellular phones and PDAs. With the popularization of deploying Java applications on these devices increases, performance will become an important issue. To achieve higher performance, embedded JVMs are usually enhanced with a lightweight just-in-time (JIT) compiler, embedded JIT compiler, instead of incorporating a full-fledged JIT compiler as high performance JVM. For fast compilation and low code size expansion, an embedded JIT compiler usually compiles simple bytecode instructions and lets interpreter handle method calls, but it results in poor performance on method calls. In this thesis, we design and implement a method inlining mechanism that is suitable for embedded JIT compiler to improve speed performance while keeping the code size expansion in a reasonable size.
In addition to inlining conventional static methods, our method inlining mechanism can also inline virtual methods and make use of monomorphic property to further improve performance. Even when this monomorphic property is violated by dynamic class loading, the inlined code can still have chances to be executed by our recovery mechanism. As a whole, our method inlining mechanism demonstrates 1.43 speedup with only about 3% code size expansion (if 512Kbytes memory).
誌謝
首先要感謝我的父母,一直在我身邊關心我鼓勵我,常常為我
擔心,有了他們的支持,我才可以全心全意投入研究中。再來感謝
我的指導老師 單智君教授。在老師諄諄教誨、辛勤的指導之下,我
得以完成此論文,讓我在學業方面有所精進。
也感謝實驗室的陳裕生學長,常常給我一些寶貴的意見與指
導。另外也感謝一些朋友、隊友還有教練的鼓勵,讓我能繼續有學
習的動力。
謹向所有支持我、勉勵我的師長與親友,奉上最誠摯的感謝的
祝福。謝謝你們!
唐心磊
2007. 4.19
Contents
摘要 ... i ABSTRACT...ii 誌謝 ...iii CONTENTS... iv LIST OF FIGURES ... v LIST OF TABLES... vi CHAPTER 1 INTRODUCTION ... 11.1EMBEDDED JAVA ENVIRONMENT... 2
1.2EMBEDDED JUST-IN-TIME COMPILER... 3
1.3METHOD INLINING... 4
1.4RESEARCH MOTIVATION AND OBJECTIVE... 5
1.5THESIS ORGANIZATION... 6
CHAPTER 2 BACKGROUND ... 7
2.1JAVA TECHNOLOGY... 7
2.2JVMINTERNALS... 8
2.2.1 Class Loader and Method Area... 9
2.2.2 PC Register and Java Stack ... 9
2.2.3 Java Heap ... 10
2.2.4 Execution Engine ... 11
2.3OVERVIEW OF OUR EMBEDDED JIT COMPILER –KJITC ... 12
CHAPTER 3 RELATED WORK ... 15
3.1THE DIFFICULTIES OF INLINING IN JAVA... 15
3.2.1 Guard Test ... 18
3.2.2 Direct Inlining with Recompilation ... 19
3.2.3 Direct Inlining with Code Patching ... 22
3.3SUMMARY... 24
CHAPTER 4 DESIGN AND IMPLEMENTATION ... 26
4.1DESIGN AND IMPLEMENTATION ISSUES... 26
4.2SYSTEM OVERVIEW... 29
4.2.1 Design Overview ... 29
4.2.2 Interactions between Components... 31
4.3METHOD INLINER... 32
4.3.1 Code Expansion Control Mechanism ... 33
4.3.2 Callsite Selector ... 34
4.3.3 Inliner... 36
4.4CLASS HIERARCHY ANALYSIS MANAGER... 46
CHAPTER 5 EXPERIMENTS ... 52
5.1EXPERIMENT ENVIRONMENT... 52
5.2BENCHMARKS... 53
5.3EXPERIMENT RESULTS... 54
5.3.1 Program Behavior... 55
5.3.2 Effects of our Expansion Control ... 57
5.3.3 Performance Results ... 59
5.3.4 Speedup Analysis... 60
5.3.5 Comparison... 65
CHAPTER 6 CONCLUSION AND FUTURE WORK... 67
List of Figures
FIGURE 1-1.JAVA2PLATFORM (EXTRACTED FROM SUN)... 2
FIGURE 1-2.METHOD INLINING DIAGRAM... 5
FIGURE 2.1.THE INTERNAL ARCHITECTURE OF JAVA VIRTUAL MACHINE... 8
FIGURE 2-2.PC REGISTERS AND JAVA STACK OF EACH THREAD... 10
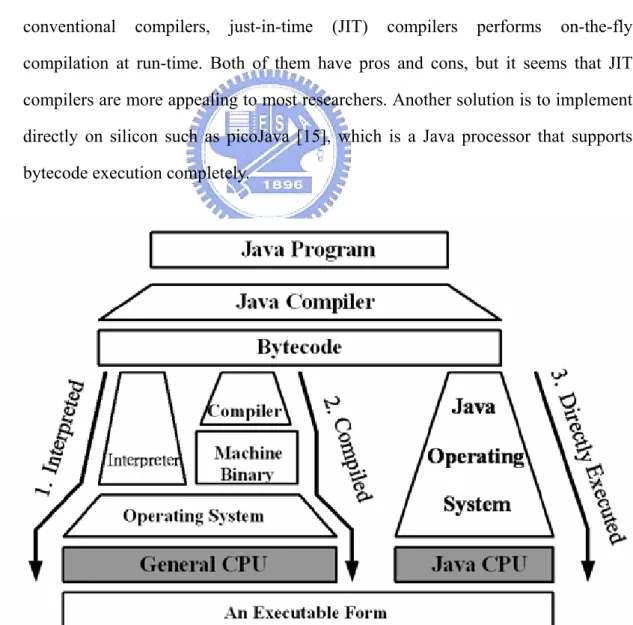
FIGURE 2-3.ALTERNATIVES TO EXECUTING JAVA PROGRAMS... 11
FIGURE 2-4.SYSTEM COMPONENTS AND THEIR INTERACTIONS IN KJITC... 12
FIGURE 2-5.KJITCCOMPILER ARCHITECTURE... 13
FIGURE 3-1.DYNAMIC DISPATCHING OF VIRTUAL METHOD... 15
FIGURE 3-2.DYNAMIC CLASS LOADING EXAMPLES... 17
FIGURE 3-3.GUARD TEST MECHANISM... 19
FIGURE 3-4.DIRECT INLINING WITH RECOMPILATION—DIRECT INLINING... 21
FIGURE 3-5.DIRECT INLINING WITH RECOMPILATION—RECOVERY... 22
FIGURE 3-6.DIRECT INLINING WITH CODE PATCHING—DIRECT INLINING... 23
FIGURE 3-7.DIRECT INLINING WITH CODE PATCHING—RECOVERY... 24
FIGURE 4-1.DIRECT INLINING WITH GUARD TEST CODE PATCHING—DIRECT INLINING... 27
FIGURE 4-2.DIRECT INLINING WITH GUARD TEST CODE PATCHING—RECOVERY... 28
FIGURE 4-3.SYSTEM COMPONENTS OF OUR INLINING SYSTEM... 30
FIGURE 4-4.INTERACTIONS BETWEEN COMPONENTS... 31
FIGURE 4-5.OVERVIEW OF CALLSITE SELECTOR AND INLINER... 33
FIGURE 4-6.CODE EXPANSION CONTROL MECHANISM... 33
FIGURE 4-7.FLOW CHART OF OUR SELECTION ALGORITHM... 36
FIGURE 4-8.OVERVIEW OF INLINER... 38
FIGURE 4-8.INLINING PATTERNS AND THE DESIGN OF TWO PSEUDO BYTECODE... 39
FIGURE 4-9.ILLUSTRATION OF APPENDING LOCAL VARIABLES... 40
FIGURE 4-12.INLINING TABLE CONSTRUCTION... 47
FIGURE 4-13.RECOVERY INFORMATION RECORDING... 48
FIGURE 4-14.GUARD TEST CODE PATCHING... 50
FIGURE 4-15.SNAPSHOT OF INLINING TABLE –AFTER RECOVERY... 51
FIGURE 5-1.PROGRAM BEHAVIOR OF BENCHMARKS... 56
FIGURE 5-2.EFFECT OF EXPANSION FACTOR –Α ON PERFORMANCE... 58
FIGURE 5-3.EFFECT OF INLINE CACHE SIZE ON PERFORMANCE... 59
FIGURE 5-4.INLINING EFFECT ON PROGRAM BEHAVIOR... 62
FIGURE 5-5.SPEEDUP ANALYSIS... 63
List of Tables
TABLE 1-1. J2MECONFIGURATION... 3
TABLE 3-1.COMPARING AMONG THE THREE APPROACHES -GUARD TEST,DIRECT INLINING WITH RECOMPILATION (RECOMPILATION) AND CODE PATCHING MECHANISM... 25
TABLE 4-1.COMPARING TO CODE PATCHING MECHANISM... 28
TABLE 5-1:EMBEDDED CAFFEINEMARK 3.0... 53
TABLE 5-2:CLDCHOTSPOTTMIMPLEMENTATION EVALUATION KIT VERSION 1.0.1 ... 54
TABLE 5-3.INVOCATION COUNTS ON VARIOUS TYPES... 57
TABLE 5-4.PERFORMANCE RESULTS... 60
TABLE 5-5.INLINE COUNTS OF DIFFERENT TYPE... 63
Chapter 1 Introduction
Recently there has been a growing interest in using Java on embedded portable devices such as cellular phones and PDAs. With the popularization of deploying Java applications on these devices increases, performance will become an important issue. To achieve higher performance, embedded JVMs are usually enhanced with a lightweight just-in-time (JIT) compiler, embedded JIT compiler, instead of incorporating a full-fledged JIT compiler as high performance JVM. For fast compilation and low code size expansion, an embedded JIT compiler usually compiles simple bytecode instructions and lets interpreter handle method calls, but it results in poor performance on method calls. Method inlining is a well-known and effective solution to the problem but entails large code expansion if excessive inlining. On another hand, embedded applications are often amenable to inlining due to relative small call sites that could be inlined compared to large applications. In this thesis, we design a method inlining mechanism that is suitable for embedded JIT compiler and can make full use of method properties to reduce method call overhead and keeps code size expansion in a reasonable size, and implement it in our embedded JIT compiler – KJITC.
In this chapter, we introduce some essential materials to help readers understand the concepts behind and the terms in our research. First, we give an overview of the current states of the Java technology in embedded environment. Second, we introduce more features of embedded JIT compiler and its interactions with embedded JVM. Third, we introduce the concept of method inlining with pro and con. After the introduction comes our research motivation and objectives. Finally, organization of this thesis is provided.
1.1 Embedded Java Environment
Java Technology is developed by Sun in 1991 and becomes popular rapidly in all application fields, such as powerful large-scale server, desktop PCs, or even in small portable devices. To meet the demands of different application fields with different characteristics, Sun in 1999 has grouped Java technologies into the Java 2 platform [1], which consists of three editions as Figure 1-1. Each edition is specialized for a specific area:
y Java 2 Enterprise Edition (J2EE) - targeted at scalable, transactional, and database-centered enterprise applications with an emphasis on server-side development.
y Java 2 Standard Edition (J2SE) - targeted at conventional desktop applications. y Java 2 Micro Edition (J2ME) - targeted at embedded and consumer devices,
such as wireless handhelds, TV set-top boxes, PDAs, and other devices that lack the resources to support full J2SE implementation.
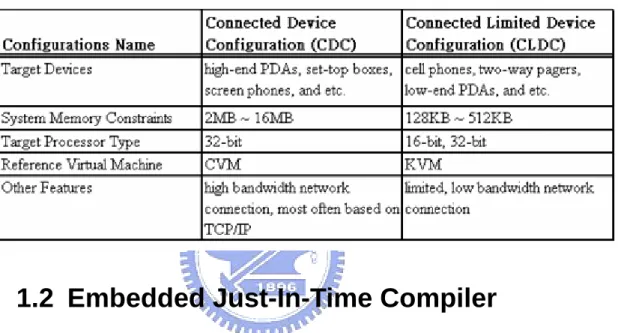
To address the diversity of embedded devices with different memory footprint and network connectivity, J2ME specifies two configurations: Connected Device Configuration (CDC) and Connected Limited Device Configuration (CLDC). Each configuration targets at different types of embedded devices and therefore provides different class libraries and APIs. Table 1-1 gives an overview of the two configurations.
Table 1-1. J2ME Configuration
1.2 Embedded Just-In-Time Compiler
Although the JVM can be easily realized by an interpreter, its slow performance is a concern in performance-aware system. To solve the problem, some compilation technologies must be applied. For example, ahead-of-time (AOT) compilers [2] allow offline compilation, so no run-time compilation overhead is needed. Conventional JIT compilers translate bytecode into machine code on the fly before execution with the expense of code size increase and run-time compilation overhead. However, embedded JVM with footprint memory and low performance CPU can tolerate neither the static compiled code size expansion imposed by AOT compilers nor the code size/compilation overhead imposed by conventional JIT compilers.
improve performance without too much size/compilation overhead, a lightweight JIT compiler which is highly customized for an embedded JVM– embedded JIT compiler – is adapted ([3] [4] [5]). For fast compilation and low code size expansion, an embedded JIT compiler usually compiles only simple bytecode instructions and incorporates simple optimization techniques (such as constant folding). Hence, the other part of the program without compiled will be handled by the interpreter. This kind of execution model letting interpreting and native executing co-exist is called mixed mode execution ([6] [7]) and here are its principles:
y Performance-critical parts (Hot Spot) of the program are compiled by embedded JIT compiler, and then natively executed.
y Non-performance-critical parts of the program are interpreted by an interpreter. y Close interactions between the JIT compiler and interpreter is necessary.
Generally, for keeping itself compact, an embedded JIT compiler regard method invocation bytecode instructions (such as INVOKEVIRTUAL) as complex and delegates the interpreter to handle the heavy task involving pushing and popping frame, passing arguments and etc. Hence, method call overhead in embedded JVM is costly even if enhanced with an embedded JIT compiler.
1.3 Method Inlining
Method inlining is an important compilation optimization technique ([8] [9]) that replaces a method call site with the body of the method. A simple illustration is given in figure 1-2. This technique reduces the overhead resulting from method calls. The savings are especially pronounced for applications where only a few call sites are responsible for the bulk of the method calls. Inlining also expands the context of analysis and the wider scoped analysis introduces opportunities for further optimization techniques (such as constant propagation and etc).
the code size, cache miss rate, register pressure and dynamic compilation cost (if in dynamic compilation environment). Therefore, finding the best tradeoff among these benefits and costs becomes an important issue of method inlining.
Method Inlining call caller callsite callee Inlined return Callee Inlined Body callee
Figure 1-2. Method Inlining Diagram
1.4 Research Motivation and Objective
In our survey, we found that small applications are usually more amenable to aggressive inlining and the experiment results in [10] show that aggressive inlining of small applications not only improves performance well but also increases little code size. We also observed that most applications running on embedded systems are small ([11] [12]) and suitable for inlining. Motivated by [10] and our observation of embedded applications, the objective of this thesis is to design and implement a method inlining mechanism that is suitable for embedded JIT compiler and can make full use of method properties to improve speed performance while keeping the code expansion within a reasonable size.
In addition, the embedded JIT compiler we choose to implement is developed by [6]. The embedded JIT compiler, named KJITC, is combined with a mixed mode JVM modified from Sun’s CLDC KVM 1.0.4 and the KJITC generates ARM instructions in its current implementation.
1.5 Thesis Organization
The rest of the thesis is organized as follows. Chapter 2 provides more detailed background knowledge on JVM internals and an overview of our embedded JIT compiler - KJITC. Chap 3 describes the problem of method inlining in Java and introduces current common solutions. In Chap 4, the design and implementation of our method inlining mechanism is presented. Chap 5 exhibits and analyze the experiment results. In the end we make a brief summary in Chap 6.
Chapter 2 Background
This chapter provides more background details on JVM and an overview of our embedded JIT compiler - KJITC. Readers who are already familiar with these two topics can skim over them.
2.1 Java Technology
Generally, Java is refer to a computer language, but it more that that. In reality, Java is rather a complete architecture consisting of four components [13].
y Java programming language y Java class file format
y Java Application Programming Interface (Java API) y Java Virtual Machine (JVM)
A Java program is written in Java programming language, and then compiled into Java class files which conform to Java class file format by a Java source compiler (such as javac compiler in Sun JDK). Java class files can be executed on any environment with JVM, the core of Java technology. The Java program can also access predefined libraries or system resources (such as I/O and Network, for example) by calling methods in the classes implementing the Java API. And during program execution, JVM loads and executes user-written class files as system classes that Java API defines.
2.2 JVM Internals
Java Virtual Machine, the core of Java technology, is definitely the key component among the all and it is responsible for the well-known advantages of Java comparing to traditional native execution systems. Those advantages include cross-platform portability, security of the execution environment and small size of compiled code etc.
Figure 2.1. The Internal Architecture of Java Virtual Machine
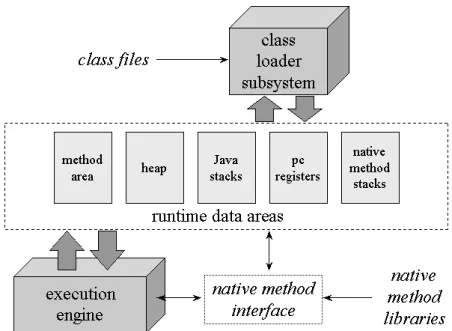
To realize the JVM, the functionality of a real processor must be provided that adhere to the Java virtual machine specification [14], which describes the behaviors of a JVM instance in terms of subsystems, runtime data areas, and instructions. These components are described as an abstract inner architecture instead of detail implementation of each. Figure 2-1 shows a block diagram of Java virtual machine including the major subsystems and runtime data areas described in JVM specification. Next we will simply describe those components.
2.2.1 Class Loader and Method Area
In Java virtual machine, static information about each class is loaded by a class loader and stored in method area. The class loader loads Java class files and converts to corresponding run time data structure in JVM and store it into method area. The information in method area contains bytecode instructions that are associated with the methods in the compiled code and the symbol table, named constant pool, needed for dynamic linkage. All threads in a JVM instance share the same method area, so access to the method area’s data structures must be designed to be threadsafe.
Furthermore, class loader presents the dynamic class loading feature of JVM, which provides the Java platform with the ability to install software components at run-time and has a number of characteristics such as lazy loading, type-safe linking and user-definable class loading policy.
2.2.2 PC Register and Java Stack
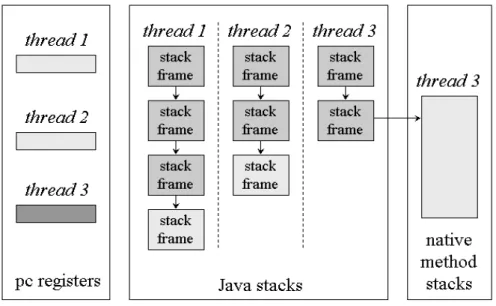
When each new thread comes into existence, it receives its own PC registers and Java Stack. If the thread is executing a Java method, the PC registers contain the current state of JVM and the next instruction to execute.
The Java stack is composed of stack frames, each of which contains the execution state of its corresponding invoked method, including its own local variables, parameters, return values (if any) and intermediate calculations on operand stack. When a thread invokes a Java method, the JVM pushes a new stack frame onto the Java stack of the thread. When the method completes and returns, the JVM pops the frame for that method. The state of native method invocations is stored in an implementation-dependent way in native method stacks, such as in
registers or other implementation-dependent memory areas.
Figure 2-2 shows the memory areas that JVM creates for each thread. These areas are private to their owning thread, and there is no thread that can access the PC register or Java Stack of another. At the figure, thread 1 and thread 2 are executing Java methods while thread 3 is executing a native method.
Figure 2-2. PC registers and Java Stack of each thread
2.2.3 Java Heap
The Java heap is the dynamic memory of JVM, and it usually contains a collection of objects. When an object is created with the “NEW” bytecode instruction, a reference to the object is returned. The reference can be used subsequently, or stored in the current stack frame. An object is live in heap until there are no references to it. An object becomes garbage when there are no such references, and a garbage collector will reclaim its resources.
2.2.4 Execution Engine
Execution engine is the kernel of execution in Java virtual machine, and it is also the critical section affecting performance of JVM. The execution engine is not restricted to software interpreter implementation. There are other alternatives such as JIT and Java processor, as depicted in figure 2-3. Interpreting the bytecode has the advantage of fast JVM porting but makes the execution of Java programs relatively slow. One solution to improve performance is to use a bytecode compiler which is responsible for translating bytecode into native machine code to substitute interpreter. While ahead-of-time (AOT) compilers performs offline compilation as conventional compilers, just-in-time (JIT) compilers performs on-the-fly compilation at run-time. Both of them have pros and cons, but it seems that JIT compilers are more appealing to most researchers. Another solution is to implement directly on silicon such as picoJava [15], which is a Java processor that supports bytecode execution completely.
Recently, an interpreter can still coexist and cooperate with a JIT compiler in JVM, mixed-mode execution JVM. As well, a mixed software/hardware approach comes to exist; ARM has introduced its own Java instruction extension – Jazzle [16]. A subset of bytecode instructions can be directly executed when the ARM processor is executed in Java mode while the remaining bytecode instructions are still handled in software (interpreted or compiled).
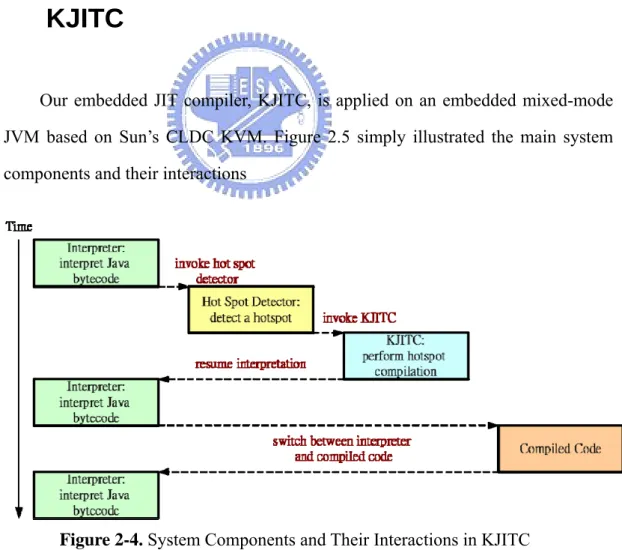
2.3 Overview of our embedded JIT compiler –
KJITC
Our embedded JIT compiler, KJITC, is applied on an embedded mixed-mode JVM based on Sun’s CLDC KVM. Figure 2.5 simply illustrated the main system components and their interactions
Figure 2-4. System Components and Their Interactions in KJITC
JIT) as follows:
y Interpreter-based JVM (KVM)
The interpreter-based JVM provides a JVM infrastructure that performs method invocation, garbage collection, exception handling, synchronization and etc. For mixed-mode execution, the interpreter is also responsible for invoking the hot spot detector and switching to and from compiled code in addition to interpreting of those bytecode that have not been compiled or will not be compiled.
y Hot Spot Detector
Due to the memory constraints, only valuable parts of the program are selected for compilation. The responsibility of the hot spot detector is to discover performance-critical part of program and then invoke JIT compiler for hot compilation. The basic unit of hot spot is a method. When a method is invoked frequently or contains at least one loop that iterates many times, it is regarded as a hot spot and invokes KJITC to compile it.
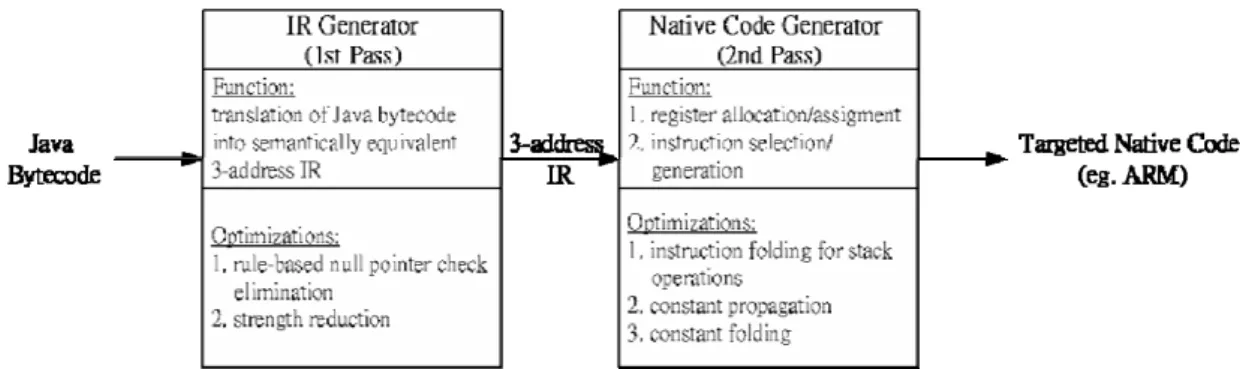
y KJITC
The KJIT is divided into the Intermediate Representation (IR) generator and the native code generator. The IR generator is mainly responsible for translating bytecode into three-address IR. And then code generator translates IR, generated by IR generator, into targeted native code to be executive in a native way dependent on the target processor. A simple illustration is given in Figure 2-6.
In order to reduce compilation cost and to keep the KJITC small footprint, several design decisions are made.
1. Only Local optimization Within an Extended Basic Block
No global optimization is performed because of the potential high compilation cost of control and data flow analysis. However, the maximum optimization range was extended to an extended basic block rather than a basic block.
2. No Support for Complex Bytecode
Complex bytecode refers to those bytecode instructions that involve complicated operations, such as method invocation, synchronization, object construction, and etc, that suit for interpreter handling. As result these complex bytecode instructions are regarded as non-compile-able in the KJIT.
y Compiled Code Buffer
The compiled code buffer holds all compiled code. During native execution, the machine program counter points to native code that resides in the buffer. The compiled code buffer is allocated statically and its size is also predetermined in current implementation.
In addition to the four components above, the switching mechanism between the interpreter and the compiled native code is described here. Similar to a function call, the switch from the interpreter to the compiled native code includes spilling register into memory and then transfer execution by a branch; and the switch from the compiled native code to the interpreter includes restoring registers from memory, transferring execution by a branch, and updating Java PC (program counter) and Java SP (stack pointer).
Chapter 3 Related Work
In this chapter, we describe the difficulties in inlining of Java’s virtual methods and discuss three common approaches that make it possible to virtual inlining. Section 3.1 explains the difficultly in inlining of virtual methods with some examples. Section 3.2 introduces the three common approaches. Finally the three approaches are summarized in section 3.3
3.1 The difficulties of Inlining in Java
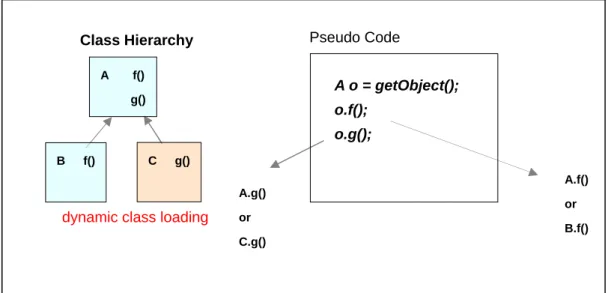
Generally, there are two kinds of methods in Java - static method and virtual method. Static method can be statically bound at compile time and virtual method can only be resolved at run time depending on the actual instance of the method, known as dynamic dispatch. Figure 3.1 gives a simple example for illustration.
Class Hierarchy A.f() or B.f() Pseudo Code B f() A f() g() A o = getObject(); o.f(); o.g(); A.g() dynamic dispatching
Figure 3-1. Dynamic Dispatching of Virtual Method
In figure 3.1, the left side is class hierarchy graph (CHG), which represents the inheritance relationship between classes and their methods; and the right exhibits the
pseudo code that invokes virtual methods. From the CHG, we know that there are two classes – class A with method f() and class B with methods f() and g() – in the current execution. Class B inherits class A and method f() in B (B.f()) overrides method f() in A (A.f()). It is not known which versions (A.f() or B.f()) o.f() would invoke until the statement “ A o = getObject(); “ is executed. Hence, we can’t directly inline virtual method because the caller may invoke different version of callees through dynamic dispatching if there are at least two versions existing in the CHG.
In closed world language, like C++, classes are prohibited from being loaded after compilation. [17] exploits this property to inline monomorphic virtual methods, only one version in CHG, by class hierarchy analysis that analyzes the class hierarchy graph and decides whether a method is monomorphic. For example, the method g() in figure 3.1 is monomorphic because only A.g() version exists.
However, Java supports dynamic class loading that enables new classes to be loaded by JVM at run time (such as Class.forName()). The support for dynamic class loading impedes inlining of monomorphic virtual methods. According to class hierarchy graph in figure 3.1, for example, we know that method g() is monomorphic and the call site “o.g();” always invokes A.g(). But as the time goes by, JVM loads new class C dynamically that inherits class A and its method g() overrides method A.g(), as shown in figure 3.2. If A.g() is inlined before class C is loaded, it may leads to error because now there are two versions of g().
A.f() or B.f() Pseudo Code B f() A f() g() A o = getObject(); o.f(); o.g(); A.g() or C.g() C g() Class Hierarchy
dynamic class loading
Figure 3-2. Dynamic Class Loading Examples
Due to the two features of Java described above - dynamic dispatching and dynamic class loading, a given virtual call site may invoke several different actual methods over the course of a program execution. Thus, it is impossible to uniquely identify method to be inlined at a virtual callsite. But on one hand, virtual methods are heavily presented in Java applications in object-oriented design. On the other hand, in many applications some virtual call sites actually execute only one method, that is, are monomorphic though the program execution rather than polymorphic; some call sites are “almost monomorphic”, in that several methods might be executed, but one is executed much more frequently than the others. Therefore, it is worthy of investigating mechanisms to virtual inlining.
Some approaches ([17] [18] [19]) have been proposed to make inlining of virtual methods possible with some side effect. Next section we will introduce three common approaches to inlining of virtual methods.
3.2 Inlining of Virtual Methods
must be implemented. Guard test mechanism [17] employs a test to guard the inlined code to ensure correctness, while direct inlining with recompilation mechanism [18] and direct inlining with code patching mechanism (code patching mechanism) [19] directly inline monomorphic method without guard test code and the inlined code is executed until the monomorphic assumption about the method becomes invalidated, at which time the compiler recompiles or performs code patching to make original normal dispatch code executed subsequently. A point should be noted that the three approaches are not individually adopted and can be used interchangeably.
3.2.1 Guard Test
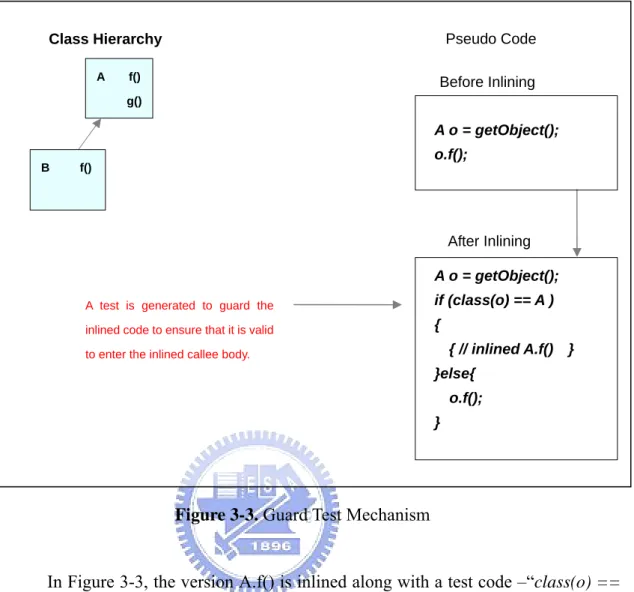
When a virtual method is selected to be inlined, the compiler with this mechanism generates a test code along with the inlined code to ensure that it is valid to enter the inlined callee body. If the test fails, the normal virtual call mechanism, dynamic dispatch, is applied. Figure 3-3 gives an example about how the guard test mechanism works.
Class Hierarchy Pseudo Code B f() A f() g() A o = getObject(); o.f(); Before Inlining A o = getObject(); if (class(o) == A ) { { // inlined A.f() } }else{ o.f(); } After Inlining
A test is generated to guard the inlined code to ensure that it is valid to enter the inlined callee body.
Figure 3-3. Guard Test Mechanism
In Figure 3-3, the version A.f() is inlined along with a test code –“class(o) ==
A”– that guards the inlined A.f(). Before entering into the inlined A.f(), the test code
checks if the class of the instance o is equal to class A.1 If they are equal, it means that our inlining assumption is valid and the inlined A.f() is executed; otherwise, the normal virtual dispatch, o.g(), is applied to invoke the actual method.
3.2.2 Direct Inlining with Recompilation
This mechanism only allows monomorphic methods2 to be inlined, by analyzing the current class hierarchy. When a monomorphic callee is selected to be
1 In recent studies, there are two kinds of guard test – class test and method test. Class test guards the inlined code by testing the receiver of the class while method test guards that by testing the method address. In this thesis we see class test as our guard test mechanism. The detail can be found in [17]. 2 We say the method is “monomorphic” in the thesis is based on the class hierarch graph at that time, and it may becomes polymorphic by dynamic class loading.
inlined, the JIT compiler with this mechanism generates the inlined code directly (without test code) and records the fact that the inlining of the monomorphic callee depends on the monomorphic assumption about the callee. Then the inlined code is executed until the assumption monomorphic becomes invalidated by dynamic class loading. When it happens, the JIT compiler is responsible for recompiling the inlined caller and let it work as original dynamic dispatch. In case that when the monomorphic assumption about callee is violated, an invocation of the inlined caller is being executed, the JIT compiler is responsible for adjusting the state of the corresponding methods on the stack (called on-stack replacement) [17].
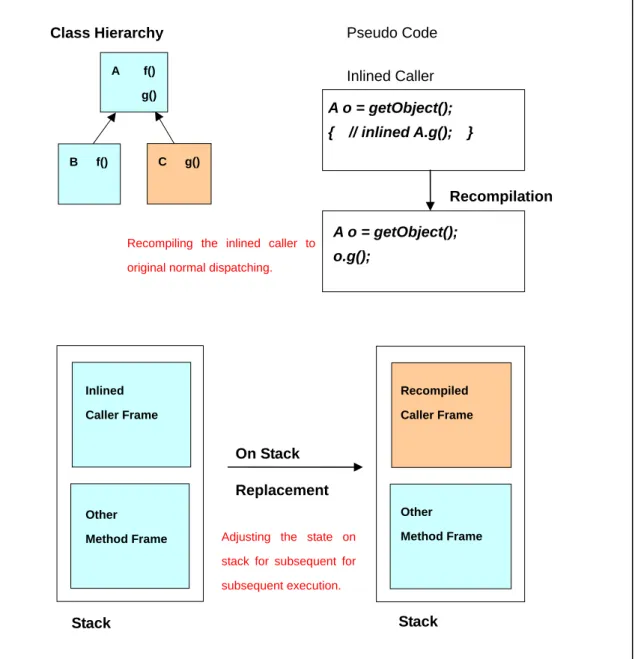
Figure 3.4 and figure 3-5 illustrate how this mechanism works. By class hierarchy analysis, method g() is known monomorphic. Then the JIT compiler directly inlines A.g() and records information about the monomorphic assumption for recovery (figure 3-4). As the time goes by, a new class C is loaded and overrides A.g(). At the moment, the JIT compiler recompiles the inlined caller and because the inlined caller is being executed, on-stack replacement is applied to correct the state on the stack for subsequent execution (figure 3-5).
Class Hierarchy Pseudo Code B f() A f() g() A o = getObject(); o.g(); Before Inlining A o = getObject(); { // inlined A.g(); } After Inlining
Class Hierarchy Analysis g()
monomorphic?
Using class hierarchy analysis to determine if a selected callee is monormophic.
Class Hierarchy Pseudo Code B f() A f() g() A o = getObject(); o.g(); Inlined Caller A o = getObject(); { // inlined A.g(); } C g() Stack Inlined Caller Frame Other Method Frame Stack Other Method Frame Recompiled Caller Frame On Stack Replacement Recompilation
Recompiling the inlined caller to original normal dispatching.
Adjusting the state on stack for subsequent for subsequent execution.
Figure 3-5. Direct Inlining with Recompilation—Recovery
3.2.3 Direct Inlining with Code Patching
This mechanism (code patching mechanism), as well as direct inlining with recompilation, only allows monomorphic methods to be inlined and the difference is that when a monomorphic method is selected to be inlined, the JIT compiler with code patching mechanism generates the inlined callee code together with the back up code for original normal dispatch. At the beginning, only the inlined code is
executed and when the monomorphic assumption is violated by dynamic class loading, the JIT compiler adjusts the first instruction of the inlined callee code and let it jump to the backup code rather than recompilation. As a consequence, the backup code is executed afterward.
See figure 3.6 and figure 3.7 for illustration. By class hierarchy analysis, the method g() is known to be monomorphic. And the compiler generates inlined A.g() together with its backup code o.g() and records information about the monomorphic assumption for recovery (figure 3-6). As the time goes by, a new class C is loaded and overrides A.g(). At the moment, the compiler patches the code of the inlined A.g() and let it jump to the backup code o.g() for original dynamic dispatch subsequently (figure 3.7).
Class Hierarchy Pseudo Code
B f() A f() g() Before Inlining A o = getObject(); { // inlined A.g(); } goto aftercall; o.g(); After Inlining backup: aftercall: A o = getObject(); o.g();
Class Hierarchy Analysis g()
monomorphic?
Inlining with normal dispatch backup code and using a jump instruction to avoid executing it.
Class Hierarchy Pseudo Code
Figure 3-7. Direct Inlining with Code Patching—Recovery
3.3 Summary
We have described the reason why it is difficult to inline virtual methods and introduced three common approaches to virtual inlining. Table 3-1 summarizes the three approaches. From the table, we can see that guard has the least space overhead but entails the run time test overhead every time when entering the inlined code; although direct inlining with recompilation seems to increase the speedup most from inlining, it has the highest space overhead and a high recompilation cost if the monomorphic assumption violated; at least, code patching mechanism has the advantage of fast entering the inlined code and recovery, but still costs space to maintain inlining information.
B f() A f() g() Inlined Caller A o = getObject(); { // inlined A.g(); } goto aftercall; o.g(); backup: aftercall: C g() Code Patching A o = getObject(); { // inlined A.g(); } goto aftercall; o.g(); backup: aftercall: goto backup;
Adjusting the first instruction of the inlined callee code and let it jump to the backup code
The three approaches have their pros and cons and there is no one that always outperforms the others. In reality, the actual speed performance depends on the behavior of the application. If the dynamic class loading happens frequently, the direct inlining with recompilation may become most slow.
Table 3-1.Comparing among the three approaches - Guard Test, Direct Inlining with
Recompilation (Recompilation) and Code Patching mechanism
Guard Test Recompilation Code Patching
Selected callee to be inlined
Polymorphic Monomorphic only Monomorphic only
Before recovery: direct enter Before recovery: through a direct
jump instruction
Entering the inlined callee
Through a test
After recovery: no inlined code After recovery: no inlined code
Recovery No 1. recompile
2. may need on-stack replacement
Adjust inlined code to normal dynamic dispatch Main Time Overhead Runtime guard test
1. Class hierarchy analysis 2. Recompilation cost 3. Dynamic dispatch after
recovery
1. Class hierarchy analysis 2. Dynamic dispatch after
recovery
Main Space Overhead
Little 1. Class hierarchy graph
2. Recovery information maintenance (relative high)
1. Class hierarchy graph 2. Recovery information
Chapter 4 Design and Implementation
In this chapter, we present the overall design and implementation of our method inlining mechanism in KJITC. In section 4.1, we discuss some design and implementation issues. Section 4.2 introduces an overview of our design and then section 4.3 to section 4.4 details the internal components.
4.1 Design and Implementation Issues
The goal of this research is to design a method inlining mechanism that can be implemented in Embedded JIT compiler, and to improve speed performance while keeping code expansion within a reasonable size.
In order to speedup performance, more method calls should be eliminated, which means that mechanisms for virtual inlining should be adopted. And on one hand, we don’t want to entail the test overhead if encountering monomorphic method and the high recompilation overhead; on the other hand, we hope that after recovery, the inlined code still has chances to be executed. Thus, a revised code patching mechanism – guard test code patching mechanism – is employed. The guard test code patching mechanism generates inlined code along with “guard teat backup code” which acts the same as guard test mechanism rather than normal backup code (dynamic dispatch). When the monomorphic assumption is violated, the JITC compiler then made guard test back up code executed subsequently, so the inlined code could be re-entered after recovery. Figure 4-1 and figure 4-2 illustrate how this mechanism works and Table 4-1 make a comparison to the code patching mechanism.
Class Hierarchy Pseudo Code B f() A f() g() A o = getObject(); goto inlinedcode; { // gurad test code } goto aftercall; { // inlined A.g(); } After Inlining aftercall: inlinedcallee: guardtest: A o = getObject(); o.g(); Before Inlining
Class Hierarchy Analysis g()
monomorphic?
Inlining with guard test backup code and using a jump instruction to avoid executing it.
Figure 4-1. Direct Inlining with Guard Test Code Patching—Direct Inlining
Since the property of monomorphic method is exploited, the inlining information (such as class hierarchy graph and recovery information) should be maintained. Because of memory constraint, an embedded JVM can not afford to maintain full class hierarchy information. Instead, we design an inlining table that provides only monomorphic information about a method for class hierarchy analysis and recovery information for patching code to guard test backup code. Thus, an embedded JIT compiler can use inlining information without constructing full class hierarchy.
Pseudo Code Inlined Caller
A o = getObject(); goto inlinedcode; { // gurad test code } goto aftercall;
{ // inlined A.g(); }
Guard Test Code Patching
aftercall: inlinedcallee:
Figure 4-2. Direct Inlining with Guard Test Code Patching—Recovery
Table 4-1.Comparing to Code Patching Mechanism
Code Patching Guard Test Code Patching
Selected callee to be inlined
Monomorphic only Monomorphic only
Before recovery: through a direct jump
instruction
Before recovery: through a direct jump
instruction
Entering the inlined callee
After recovery: no inlined code After recovery: through a test
Recovery Adjust inlined code to normal dynamic
dispatch
Adjust inlined code to guard test backup code
Main Time Overhead
1. Class hierarchy analysis
4. Dynamic dispatch after recovery
1. Class hierarchy analysis
Main Space Overhead
1. Class hierarchy graph
2. Recovery information maintenance
1. Class hierarchy graph
2. Recovery information maintenance
goto guardtest;
A o = getObject();
{ // gurad test code } goto aftercall; { // inlined A.g(); } guardtest: guardtest: inlinedcallee: aftercall: A f() g() Class Hierarchy B f() C g()
Patching the “goto inlinedcallee” instruction and let it jump to guard test backup code.
On another hand, KJITC only compiles simple bytecode such as IADD, ILOAD, and ISTORE. If a selected callee contains complex bytecode, KJIC cannot generate the inlined callee code in IR level. To increase opportunity for inlining, we do method inlining optimization before delivering to KJIC. That is, we implement method inlining at bytecode level. Hence, the embedded JIT compiler is only responsible for adjusting the PC (program counter) and corresponding execution state (Java stack frames) after inlining, so that the inlined code can be executed correctly after compilation.
Last but no least, to solve the code expansion problem, actually the most critical issue, we provide an inline cache and a code expansion control mechanism for our inlining mechanism to limit the code expansion (detailed in section 4.3.1).
4.2 System Overview
In this section, we first introduce our inlining system and then discuss interactions between its components. The inlining system is buildt on our mixed-mode JVM with KJIC described in section 2.3.
4.2.1 Design Overview
Figure 4.3 illustrates our inlining system components and their interactions. In the figure, components are showed as rectangle while data structures (such as bytecode, compiled code and inlining table) are show as ellipse. And the components and data structures in light blue represent the original while the others in light red are imposed for method inlining optimization. The red italic words represent the interactions between components about inlining and we will explain
latter.
There are two main components - method inliner and CHA manager, and a data structure- inlining table imposed on the system. Method inliner selects and inlines suitable callee methods into its caller which is detected by hot spot detector while CHA manager provides an interface for accessing inlining information from inlining table which records monomorphic and recovery information.
bytecode Compiled Code Mixed-Mode Interpreter Hot Spot Detector KITC Class Loader Method Inliner CHA Manager Inlining Table
Guard Test Code Patching Dynamic Class Loading Inlining Table Construction
Monomorphic Violation Detection
Class Hierarchy Analysis Recovery Information Recording
4.2.2 Interactions between Components
Time Mix-Mode Interpreter Hot Spot Detector Method Inliner KJITC Class Loader CHA Manager Hot Spot Detection Inlining Compilation Class Loading Inlining Table Construction Class Hierarchy Analysis Recovery Information Recording Guard Test Code Patching Class Loading Inlining Table Construction Monomorphic Violation DetectionFigure 4-4. Interactions between Components
When the mixed-mode embedded JVM starts execution, it loads system classes, such as Object, Array etc. After loading each method of a class, CHA manager will construct inlining table and record monomorphic information into inlining table. Then mixed-mode interpreter is invoked to execute bytecode. After a period of time, the hot spot detector detects hot spot and delivers the hot spot to method inliner to
do method inlining, and then the hot spot goes through KJITC to be compiled to target machine code. During method inlining process, the method inliner request CHA manager to do class hierarchy analysis to determine monomorphic when encountering virtual callee method to be inlined and if the callee is monomorphic, CHA manager will record recovery information into inlining table. Once dynamic class loading occurs and it results in the monomorphic assumption violated, the CHA manger is responsible for detecting this violation and recovering by our guard code patching mechanism. After recovery, the recovered method can still enter inlined callee through a test (by guard test backup code).
4.3 Method Inliner
Method inliner consists of three parts – callsite selector, inliner and code expansion control. Callsite selector selects the suitable callee methods to be inlined from its caller and marks their corresponding call sites. Then, the caller with marked callsites is delivered to the inliner to replace those call sites with their corresponding method bodies. Figure 4-5 gives a simple illustration. The third part, code expansion control, is a mechanism to avoid inlining too much. Figure 4-6 shows an overview of this mechanism. Next we will detail the mechanism and two components in method inliner.
Figure 4-5. Overview of Callsite Selector and Inliner
Figure 4-6. Code Expansion Control Mechanism
4.3.1 Code Expansion Control Mechanism
inline cache and an
In this mechanism, two parameters are employed to control code expansion, expansion factor- α. Inline cache provides the limit of total code size expansion, while α constrains the code expansion withinα times the original caller per inlining. For example, “ α = 1.5 ” means that after inlining, the
Hot Spot Detector
KJITC Callsite
Selector
Inliner Inline Cache Computation Enough Expansion Space?
Method Inliner callsite 1
callsite 2
callsite 3
Hot Spot Hot Spot with
callsite 2
Inlined Hot Spot Inliner Callsite Selector Hot Spot Detector Method Inliner KJITC callsite 1 callsite 2 callsite 3 Callee Body of callsite 1 Callee Body of callsite 3 Selected Callsite
code expansion cannot exceed the original code size of the caller times 1.5.
When the hot spot detector sends a hot spot to method inliner, inline cache will
if ( (Inline Cache - codesize(hot spot) * α ) > 0 ).3 (Enough Inline Cache Space?)
This formula estimates if the remaining size of inline cache is enough for inlin
Inline Cache := Inline Cache – actual code expansion. (Inline Cache Compution)
This formula subtracts the actual inlining cost from inline cache.
With this mechanism, we can limit the code size overhead resulting from inlin
4.3.2 Callsite Selector
Callsite selector selects the suitable callsites from the hot spot and marks their corre
1. hot spot frequently called by other methods:
Because the hot spot is called frequently by other method, each callsite in
be checked first:
ing. If there is not enough space for inlining, the hot spot is refused to do inlining and be directly sent to KJIT; otherwise, the hot spot will go through callsite selector and inliner, and then inline cache actually used is computed:
4
ing within a size that we can tolerate and prevent the code size from increasing too much through a one-time inlining process.
sponding callsites. There are two kinds of hot spot: one is frequently called by other methods and the other is self-containing loops and iterates many times, mentioned in section 2.3. According to the two kinds, we give different selection ranges to select callsites to be inlined:
the hot spot may execute many times and it means that each callsite may worth being inlined, so entire selection range is given and callsites are selected from the whole method.
2. hot spot containing loop with many iterations:
As the hot spot contains at least one loop and iterates many times, it is
After determining the selection range, it starts to select the suitable callee meth
1. Each callsite is given a benefit value and a cost size:
benefit value := execution_count (callee method) / codesize( callee method )5
cost size := codesize(callee method).
2. A budget is used to limit the expansion: budget := α* codesize( caller method).
3. Selecting as many as possible callsites from which with the highest
inferred that the callsites outside the loop was infrequently executed compared to those within the loop; and the benefits from inlining may be overwhelmed by overhead of inlining effort, if the callsites outside the loop are inlined. Therefore, selection range within the loop is set to avoid inlining methods outside the loop that may hurt performance.
ods. By our code expansion control mechanism, an code expansion budget -
“codesize(hot spot) * α” is given to prevent the callsite selector from selecting too
many callee methods. This is similar to the Knapsack problem. Hence, a selection algorithm based on greedy approximation to Knapsack problem is used to select the callsites to be inlined:
5 ‘execution_count (callee method)’ represents the executing count of the callee method corresponding to its callsite.
ben it value until the budget is not enough. ef
The benefit value is determined on the assumption that the higher execution coun
4.3.3 Inliner
The inliner inlines the corresponding callee methods of the callsites marked by calls
ts the more benefits would be from inlining, and the lower code size the less overhead of inlining effort. Figure 4.7 illustrates the flow chart of our selection algorithm.
Figure 4-7. Flow Chart of our Selection Algorithm
ite selector. In addition to replacing each callsite with its corresponding callee method body, other method information used by interpreter should be revised (such as local variables size, max operand stack, and etc); if encountering virtual call site, extra mechanism like guard test or guard test code patching is applied to ensure correctness. Figure 4.8 gives an overflow of the flow chart of the inliner. Next we will demonstrate our mechanism to inline virtual method and briefly describe how
Initialization involves computing budget and assigning benefit value and cost size to each callsite.
Initialization yes
Get Callsite with the Highest Benefit Value no yes Inliner Budget Computation Mark the Callsite
unmarked callsites?
to inline a callee into its caller with some discussion.
Implementation of Inlining of Virtual Methods
For aggressive inlining and exploiting the monomorphic property, we use guard test a
In order to implement our virtual inlining mechanism, two new bytecode are creat
_TEST: It is used to implement guard test code patching mechanism and
2. EST: It is used to implement guard test mechanism and make use
nd guard test code patching mechanism to present inlining of virtual methods. When the Inliner encounters a callsite, it checks if its corresponding callee is a virtual method. If so, then run time monomorphic is checked through class hierarchy analysis provided by CHA manager. If the method is monomorphic, then guard test code patching mechanism is applied and if the method is virtual method and is not monomorphic, then guard test mechanism is applied; otherwise, the method is static method and delivered to callsite replacement directly. Figure 4.8 illustrates inlining patterns with each mechanism.
ed – NO_TEST and GUARD_TEST, both of which have the same instruction
format and regard “method”, which is a direct reference to a method, as their operand:
1. NO
merely jumps to the start of inlined callee body without referring to its operand.
GUARD_T
of its operand, method pointer, to verify that the receiver has the proper class. If the test success, it jumps to the start of inlined callee body as NO_TEST;
otherwise, it uses method pointer to do normal dispatching. This implementation makes it easy to record recovery information and do recovery. As guard test code patching is applied, we merely record the address of NO_TEST to its corresponding in the inlining table (section 4.4).
replace NO_TEST with GUARD_TEST where we recorded before; then the
patched method is executed in guard test way subsequently.
pc:
goto aftercall no_test method
Callee Body
Guard Test Code Patching Guard Test Static
pc: guard_test method goto aftercall Callee Body Callee Body inlincedcode: aftercall: aftercall: aftercall: inlinedcode: NO_TEST methodpointer goto inlinecode; GUARD_TEST methodpointer
if ( class(method) == class(instance) ) goto inlinecode;
else normal_dispatch(method)
Design Two Pseudo Bytecodes to implement inlining of virtual methods:
inlinedcode:
methodpointer is the operand of bytecode instructions NO_TEST and GUARD_TEST. It is a 4-bytes method pointer referencing to method information in our target environment based on KVM.
Figure 4-8. Inlining Patterns and the Design of Two Pseudo Bytecode
Callsite Replacement
The callsite replacement procedure replaces a marked callsite with its corresponding callee body with the following adjustments.
y Argument passing
Argument passing is originally handled by interpreter and obeys the calling convention of JVM. The interpreter pops the arguments on the operand stack and stores them into their corresponding local variables of callee method. Therefore, the inliner has to insert bytecode instructions which pop the arguments from the stack
and store them into the corresponding local variables (we will discuss latter) in front of the callee body. See Figure 4.10 for example: “ASTORE 1”, line 23 in the inline caller, is inserted which can pop the argument (this pointer) from the operand stack and store it to the corresponding local variable, “local variable 1”.
y Local variable operand renumbering
Because caller and callee have its own local variables, it would lead to confliction if the inlined callee body has the same local variable operand as the caller. The inliner grows the local variables for inlined callee and renumbers the local variable operand in the inlined callee body. A simple illustration is given in Figure 4.9 and 4.10. In Figure 4.10: “ALOAD 1”, line 25 in the inlined caller, is renumbered from 0 (line 0 in the callee) to 1.
caller local variables:
0 1 2 3 4 5
callee local variables:
0 1 2 3
callee-part local variables:
Figure 4-9. Illustration of Appending Local Variables
y Constant pool operand renumbering
Sometimes the caller and callee may belong to different classes and it would lead to constant pool reference confliction. To fix the problem, we have to adjust the caller’s constant pool and renumber the constant pool operand in the inlined callee body. Intuitively, we can append the whole callee’s constant pool to the caller’s and
6 7 8 9
0 1 2 3 4 5 inlined caller local variables:
add an offset to the constant pool operands in the inlined callee as local variables operand renaming. However, this solution wastes the space - average 52 entries (215 bytes) - for each class from Caffeine Benchmark. In fact, only several entries (2~10) are referenced from a method for the most part and it means that a large part of constant pool entries appended to the caller’s are useless and results in space overhead.
Therefore, we use another solution – just appending the necessary constant pool entries to the caller’s constant pool and renumber the constant pool operands in the inlined callee body. That is, only constant pool entries used by the callee are appended to the caller’s constant pool. This approach saves space and reduces constant pool movement compared with the intuitive approach.
See figure 4.10 for illustration: the number of constant pool entries is increased by 1 in the inlined caller because the inliner appended the callee’s second constant entry to the caller’s; and “GETFIELD 39”, line 27 in the inlined caller, is renumbered from 2 (line 1 in the callee) to 39 so the instruction can refer to the right entry and get what it want.
y Return Substitution
Executing “RETURN” bytecode instructions causes the interpreter to pop the stack frame of the callee from the Java Stack and gives execution control back to its caller. The inliner uses the bytecode, “GOTO”, to substitute “RETURN” lest popping the caller, and let “GOTO” jumps to the next instruction of the inlined callee to give execution control to the caller.
Consider the “RETURN” instruction which is the last instruction in the call code, the substituted “GOTO” just jumps to the next instruction of inlined call- the next instruction. It is a redundancy so when “RETURN” appears in the end, empty substitution is applied instead.
Figure 4.10 illustrate that the “RETURN”, line 4 in the callee, was eliminated in the inlined callee (empty substitution).
y Synchronization and Exception Handling
If the callee method is a synchronization method, inliner should insert the instruction to lock object. For callee method with exception handling, the handle range and address for exception routine should be adjusted and a call stack recording the calling list without inlining is maintained to conform the semantic of exception. For example, if we inlined B to A, we need to main a call stack which records A calls B while executing the inlined B so that if the exception happens at inlined B, we can report correctly by using the call stack. Currently, we do not inline these callee methods, and we will implement in the future.
Method Information Revision
After replacing all the callsites through the callsite replacement procedure which replaces the callsite with its corresponding callee body and do local adjustments within the inlined callee described above, the inlined caller should further go through method information revision procedure to do global adjustments (ranged in whole inlined caller). The method information revision procedure does the following global adjustments to revise method information so that the interpreter can work with the inlined version:
y Branch Offset Adjustment
The branch instructions in bytecodes use relative addressing instead of direct addressing and the operands of branch instructions are called branch offset. After replacing all the callsites, the relative addresses between instructions may change in the inlined caller. The inliner should fix those offsets and let the branch instructions jump right.
See Figure 4.10 for illustration: the branch offset of “IFEQ 26”, line 11 in the inlined caller, was adjusted from 21, line 4 in the caller, to 26, and the adjustment makes the “IFEQ” in the inlined caller jump to line 37, “ICONST_0” as the caller does.
y Growth of the size of Local Variables, Operand Stack
These records should be adjusted to let the interpreter push the stack frame with proper size. To decide the size of local variables for inlined caller, the max size local variables among inlined callees is chosen to be added to the caller’s and so as the size of operand stack. It is based on that the live ranges of local variables among callees don’t overlap at one time so different inlined callees share the same appending local variables instead of appending all callee’s local variables. See Figure 4.10 illustrate the growth.
y Stackmap Reconstruction
Stackmap defined is a data structure exploited by garbage collector to speed up marking the object pointer in the Java Stack at runtime. Each method has its own stackmap with entries corresponding to branch targets. Each stackmap entry records branch target address and bitmaps of local variables and operand stack. A bitmap uses ‘1’ and ‘0’ to distinguish that if the corresponding field of local variables or operand stack is an object pointer or not. See Figure 4.10 for illustration, at the bottom of the caller, there are two stackmap entries corresponding two branch target, line 25 and line 26. Thus when executing line 25, the local variable 0 is an object pointer and there is no operand on operand stack. When executing line 26, the same as line 25 but now there is one operand on operand stack which is not an object pointer.
Inlining results in variations of branch target, local variables and operand stack and a new branch target may be created, for example: a new branch target is created, line 30 in the inlined caller in Figure 4.10, resulting from “GOTO 20” at line 20, so
a new stackmap should be reconstructed for the inlined caller lest garbage collector would mark wrong objects. See Figure 4.10 for illustration, the reconstructed stackmap in the inlined caller responds to the changes in branch targets, local variables and operand stack.
The implementation of stackmap reconstruction may use data flow analysis to generate all stackmap entries for branch targets, but it takes times. Alternatively, we reuse the original caller and callee stackmap information to speedup the reconstruction and only when encountering stackmap entry for new create branch target, data flow analysis is applied.
caller: class : A method : f() local vairable: 1 operand stack:1
constant pool : 38 entries 0 ALOAD_0 1 INVOKEVIRTUAL 21 4 IFEQ 21 7 ALOAD_0 8 INVOKEVIRTUAL 22 11 IFEQ 14 14 ALOAD_0 15 INVOKEVIRTUAL 23 18 IFNE 7 21 ICONST_1 22 GOTO 4 25 ICONST_0 26 IRETURN stackmap: lv op 25: 1 // 26: 1 // 0 callee: class : B method : g() local vairable: 1 operand stack:1
constant pool : 40 entries 0 ALOAD_0 1 GETFIELD 2 4 IRETURN stackmap: null inlined caller: class : A method : f() local vairable: 2 local variable: 2
constant pool : 39 entries 0 ALOAD_0 1 INVOKEVIRTUAL 21 4 IFEQ 33 7 ALOAD_0 8 INVOKEVIRTUAL 22 11 IFEQ 26 14 ALOAD_0 15 NOTEST 'B g()' 20 GOTO 10 23 ASTORE 1 25 ALOAD 1 27 GETFIELD 39 30 IFNE 7 33 ICONST_1 34 GOTO 4 37 ICONST_0 38 IRETURN Stackmap: lv op 30: 1 0 // 0 37: 1 0 // 38: 1 0 // 0
4.4 Class Hierarchy Analysis Manager
The CHA Manager provides an interface for other components accessing inlining information in our inlining system, see figure 4.3. The tasks of CHA manager include inlining table construction, monomorphic violation detection, class hierarchy analysis, recovery information recording and guard test code patching, as mention in section 4.2.2.
Inlining table is a data structure used to maintain inlining information and each entry in the table consists of method identification, monomorphic information, and a list of recovery information; and for fast access, the table is implemented in hash way. This kind of design make it possible to provide information without constructing the whole class hierarchy and can be implemented in memory constrained JVM. Figure 4.11 depicts the table.
1 2 3 4 5 Inlining Table 31 32 f () 0 null g () 0 null h () 1 pc 4 Inlining Method ID Monomorphic Info. Recovery List 1 monomorphic 0 polymorphic
pc denotes the address of bytecode “no_test”
used for Code Patching mechanism Entry Count
Figure 4.11. A Snapshot of Inlining Table