國立交通大學
機械工程學系
碩士論文
養豬場環境溫度對30kW沼氣渦輪發電機發電影
響之實驗研究
The Experimental Study for Ambient
Temperature Effect on 30 kW Turbine Generator
Using Biogas in a Swine Farm
研 究 生:羅晨愷
指導教授:陳俊勳 教授
養豬場環境溫度對30kW沼氣渦輪發電機發電影響之
實驗研究
The Experimental Study for Ambient Temperature Effect on 30 kW Turbine Generator Using Biogas in a Swine Farm
研究生 :羅晨愷 Student:Chen-Kai Luo 指導教授:陳俊勳 Advisor:Chiun-Hsun Chen 國 立 交 通 大 學 機 械 工 程 學 系 碩 士 論 文 A Thesis
Submitted to Department of Mechanical Engineering College of Engineering
National Chiao Tung University In Partial Fulfillment of the Requirements
For the Degree of Master of Science In Mechanical Engineering
June 2014
Hsinchu, Taiwan, Republic of China
養豬場環境溫度對 30kW 沼氣渦輪發電機發電
影響之實驗研究
學
生
:羅 晨 愷
指導教授:陳俊勳
國立交通大學機械工程學系
摘要
本論文在台中月眉台糖養豬場測試 30 kW 沼氣微型渦輪發電機,使 用處理後之不同濃度甲烷濃度之沼氣進行實驗,分析不同環境溫度和 功率負載對發電機的性能影響。研究計畫第一部分,使用實驗數據並 且利用 Brayton cycle 與組件之實際效率計算發電機之性能。結果顯示 發電機之發電功率為 31.54 kW、熱效率為 25.62 %。第二部分在不同 環境溫度下,測試不同負載(15~30 kW)之發電機效能變化,利用量測 的數據分析發電功率和熱效率。結果顯示當環境溫度從 21.8 o C 上升 至 31.4o C,發電功率和熱效率分別下降 9.6%和 2.9%,且在發電機未 到達引擎最大轉速額定功率 24 kW 下,甲烷質量流率從 0.1284 增加 至 0.152 kg/min,顯示沼氣濃度不影響發電功率。第三部分,與國外 研究之實驗數據作比較,探討不同燃料對 CR30 之性能影響。結果顯 示發電機使用沼氣之淨輸出功率高於丙烷,但是使用沼氣之熱效率會ii 低於丙烷。淨輸出功率和熱效率之最大差異分別為 1.02kW 和 3.8%。 最後,估計渦輪發電機沼氣發電之經濟效益,在 5,000 頭和 20,000 豬 隻規模豬場使用渦輪發電機每年之發電量分別為 165,200 kWh 和 826,000 kWh、減碳量分別為 725 噸和 3,600 噸。 關鍵字:沼氣發電、渦輪發電機、環境溫度、經濟效益
The Experimental Study for Ambient
Temperature Effect on 30 kW Turbine
Generator Using Biogas in a Swine Farm
Student : Chen-Kai Luo Advisor : Prof. Chiun-Hsun Chen
Department of Mechanical Engineering
National Chiao Tung University
ABSTRACT
This research carried out the 30 kW micro-gas turbine engine (CR30) experiments using biogas in a swine farm in Taichung. The experiment used different concentrations of methane in desulfurized biogas to investigate the ambient temperature and workload effects on MGT. Firstly, the theoretical calculations were analyzed by use of Brayton cycle assumption with actual component efficiencies and experimental data as inputs. The results showed that the calculated generator power output and calculated thermal efficiency are 31.54kW and 25.62%, respectively. Secondly, under various workloads (15~30kW), the ambient temperature
iv
effects on performance of MGT are investigated. When the ambient temperature increases from 21.8 oC to 31.4 oC, the net power output and thermal efficiency decrease 9.6% and 2.9%, respectively. Besides, when MGT does not reach the maximum engine speed (~96,000 rpm), the methane mass flow rate increases from 0.128 to 0.152 kg/min at 24 kW of rated power output, indicating that CH4 concentration in biogas does not affect the net power output. Thirdly, the comparisons with other researches were made for analyzing the effect by different fuels using CR30. By using biogas, it was found that the net power outputs are larger but the thermal efficiencies are lower than those by using propane. The maximum discrepancies of net power output and thermal efficiency are 1.02 kW and 3.8%, respectively. Finally, the economic benefits of MGT are estimated. The 5,000-pig and 20,000-pig swine farms can generate 165,200 kWh and 826,000 kWh of electricity per year and decrease 725 tons and 3,600 tons of CO2 per year, respectively.
Keywords: Biogas Generation, Gas Turbine Engine, Ambient Temperature, Economic Benefits
ACKNOWLEDGEMENTS
首先感謝指導教授 陳俊勳教授,除了論文上的指導以外也教導 我們未來職場上應有的工作態度及做人處事的道理。感謝宗翰學長在 沼氣發電實驗中在旁的協助與指導,使我的實驗能順利進行。感謝昶 安學長與家維學長在研究上給予我的協助。並感謝國科會計畫的經費 支持使實驗能順利完成。 感謝同窗兩年的亞樵及惟翔,一起從碩一打拚到碩二畢業,謝謝 你們的陪伴,使研究生活更加有趣。感謝學弟妹建豪、昭聖、沈為、 宗志及心偉,有你們的幫忙及陪伴,使研究室更加熱鬧。感謝畢業學 長泰全在實驗上給予的建議。 最後感謝栽培我的父母,謝謝您們從小的栽培與養育,成就現在 的我,謹以此文獻給我的雙親。vi
CONTENTS
ABSTRACT(CHINESE)... i ABSTRACT(ENGLISH) ... iii ACKNOWLEDGEMENTS ... v CONTENTS ... viLIST OF TABLES ... viii
LIST OF FIGURES ... x
Nomenclature ... xii
Chapter 1 Introduction ... 1
1.1 Motivation and Background: ... 1
1.2 Literature Review: ... 6
1.3 Scope of Present Study ... 16
Chapter 2 Biogas Generation System ... 17
2.1 Process of Biogas Production ... 17
2.2 Utlization of Biogas ... 18
2.3 Engines ... 19
2.3.1 Micro Gas Turbine ... 19
2.3.2 Gas Turbine ... 20
Chapter 3 Experimental Apparatus and Procedures ... 22
3.1 Experiment Layout... 22
3.1.1 Micro-Gas Turbine Engine ... 23
3.1.2 Biogas Flow Meter (TBT-FT004) ... 25
3.1.3 Dehumidifier (RD-20A) ... 27
3.1.4 Air Compressor (H-50) ... 27
3.1.6 Methane Concentration Analyzer (GuardCH4) ... 29
3.1.7 Humidity Temperature Meter (Center 311) ... 29
3.1.8 Gas Analyzer (IR-208) ... 29
3.2 The Theoretical Calculation ... 30
3.2.1 Excess Air Ratio ... 31
3.2.2 Thermal Efficiency ... 33
3.2.3 Least Square Method ... 34
3.3 Waste Gas Analysis ... 35
3.4 Theoretical Calculation of Performance for Miro-Gas Turbine ... 37
3.5 The Effect of Varying Loads and Ambient Temperature ... 41
3.6 Uncertainty Analysis ... 42
3.6.1 Uncertainty Analysis of mass flow meter………43
3.6.2 The Experimental Repeatability ……….43
3.6.3 CR30 System Stability ………..………….45
Chapter 4 Results and Discussion ... 46
4.1 Theoretical Calculation of Performance for Micro-Gas Turbine Engine ... 47
4.2 Power Generation by Gas Turbine Engine ... 57
4.3 Comparisons with Other Resarchers ... 67
4.4 Economic Analysis... 71
Chapter 5 Conclusions and Recommendations ... 77
5.1 Conclusions ... 77
5.2 Recommendations ... 80
viii
LIST OF TABLES
Table 2.1 Comparison of Different Power Generators……….19
Table 3.1 Engine Technical Data ... 25
Table 3.2 TBT-FT004 Flow Meter Data ... 26
Table 3.3 RD-20A Dehumidifier Data……….……27
Table 3.4 H-50 Air Compressor Data………..….…28
Table 3.5 The Measured Data of Gas Analyzer ECA450 ... 28
Table 3.6 The Calculated Data of Gas Analyzer ECA450 ... 29
Table 3.7 The Specifiation Data of Gas Analyzer IR-208 ... 30
Table 3.8 Experimental Repeatability for Thermal Efficiency at 31.4 oC ... 44
Table 3.9 Error Analysis for Thermal Efficiency at 31.4 oC ... 45
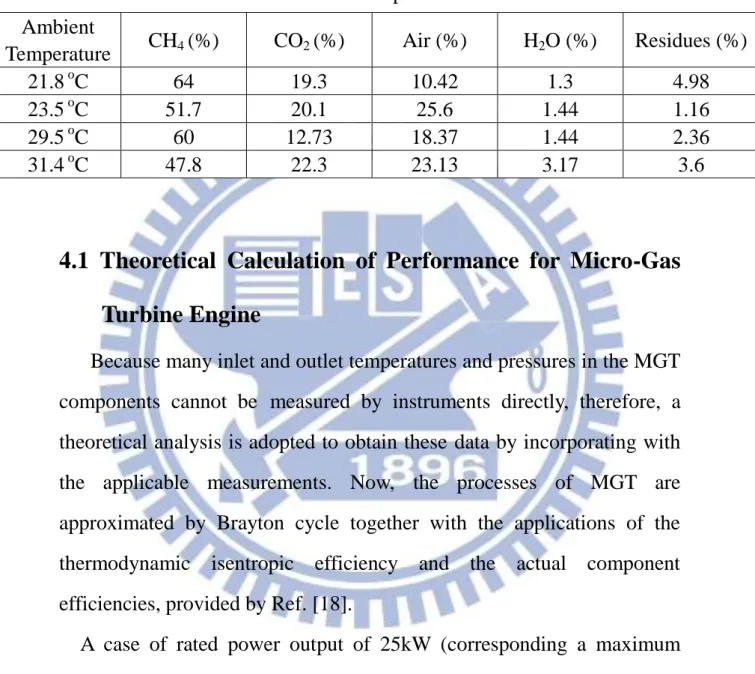
Table 4.1 Compositions of Biogas at Inlet of Turbine Engine at different Ambient Temperature ... 47
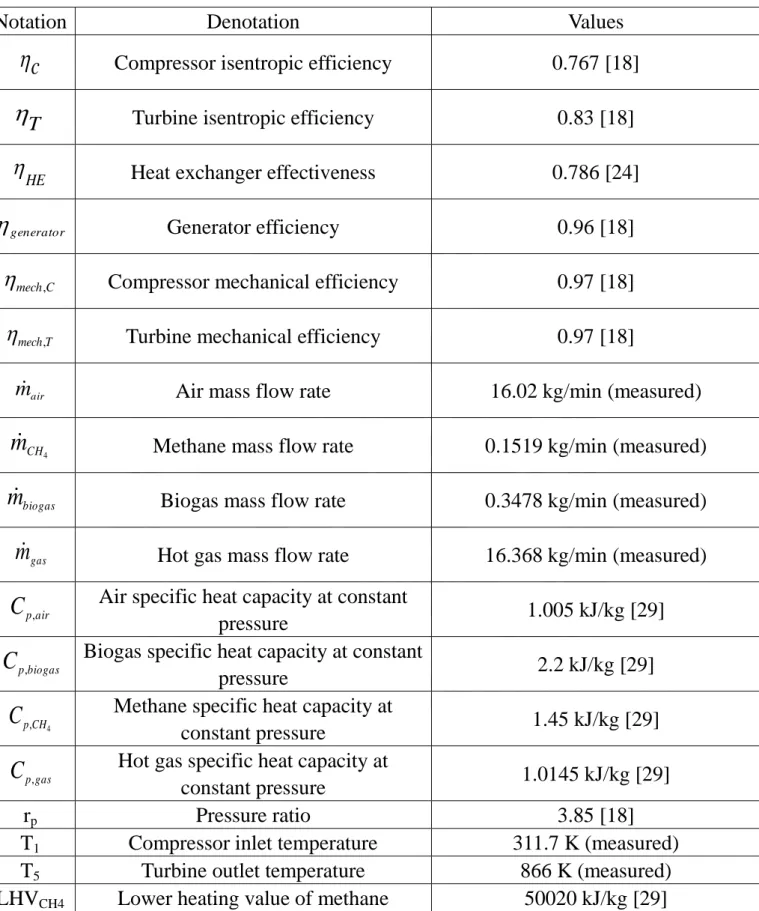
Table 4.2 The Input Data in 25 kW at 31.4oC ... 49
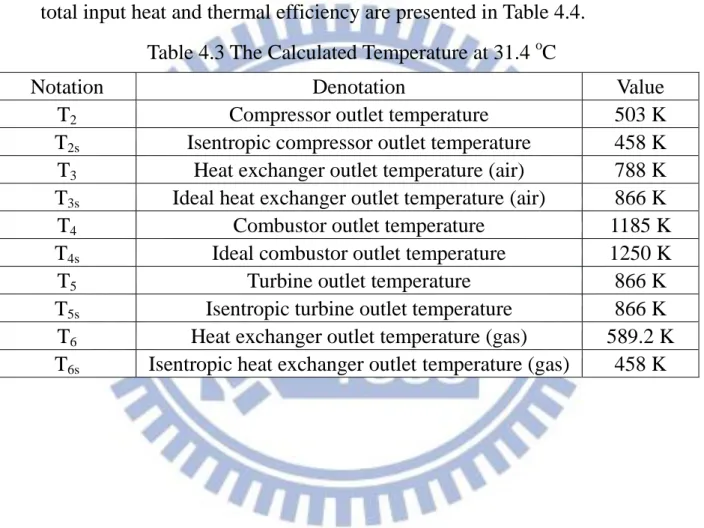
Table 4.3 The Calculated Temperature in 25 kW at 31.4oC ... 50
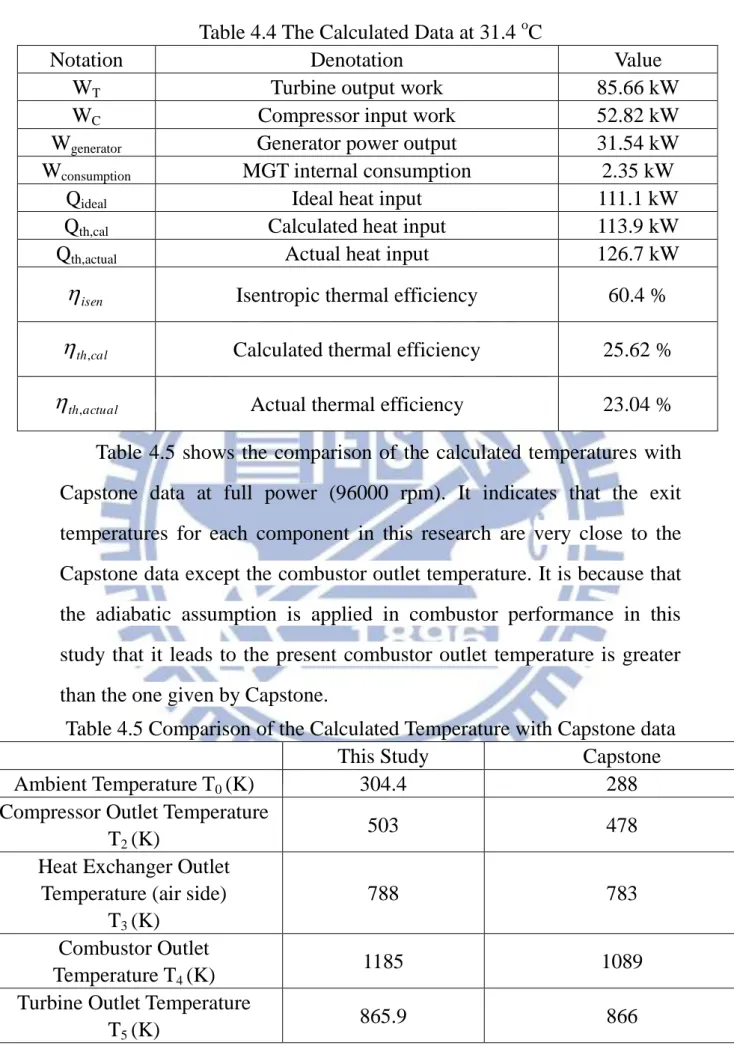
Table 4.4 The Calculated Data in 25 kW at 31.4oC ... 51
Table 4.5 Comparison of the Calculated Temperature with Capstone data ... 51
Table 4.6 Input Data of the Calculation in 15~30 kW at 31.4 oC ... 52
Table 4.7 Results of the Calculation in 15~30 kW at 31.4 oC ... 53
Table 4.8 Input Data at different Ambient Temperature ... 54
Table 4.9 Results of the Calculation at different Ambient Temperature ... 55
Table 4.10a The Measured and Derived Data as a Function of Specific Rated Power Output of CR30 gas turbine at 21.8 oC ... 58
Table 4.10b The Measured and Derived Data as a Function of Specific Rated Power Output of CR30 gas turbine at 23.5 oC ... 59 Table 4.10c The Measured and Derived Data as a Function of Specific
Rated Power Output of CR30 gas turbine at 29.5 oC ... 60 Table 4.10d The Measured and Derived Data as a Function of Specific
Rated Power Output of CR30 gas turbine at 31.4 oC ... 61 Table 4.11 Effect of Ambient Temperature Analysis ... 63 Table 4.12 Methane mass flow Rate at different Ambient Temperature in 15~24 kW of Rated Power Output ... 65 Table 4.13 The Measurements of the Waste Gas Constitutes and
Concentrations at 31.4 oC ... 67 Table 4.14 Comparison of Input Heat with Adrian Vidal et al. [19] in
30kW MGT at different Ambient Temperature ... 69 Table 4.15 Statistics on Swine Farms over 1000 pigs in Taiwan [26] .. 72 Table 4.16 Annual Economic Benefits Using Gas Turbine Engine and
Piston Engine ... 73 Table 4.17 Electricity Incomes for 5,000 Scale of Swine Farm per year
Using Turbine Engine and Piston Engine ... 74 Table 4.18 Electricity Incomes for 20,000 Scale of Swine Farm per year
Using Turbine Engine and Piston Engine ... 74 Table 4.19 Capital Cost for 5,000 Scale of Swine Farm per year Using
Turbine Engine and Piston Engine ... 76 Table 4.20 Capital Cost for 20,000 Scale of Swine Farm per year Using
x
LIST OF FIGURES
Fig. 1.1 Carbon Dioxide Emission [22] ... 85
Fig. 1.2 Energy Supply in Taiwan [23] ... 85
Fig. 1.3 Biogas Potential in Taiwan ... 86
Fig. 1.4 Simple Carbon Cycle for Biogas ... 86
Fig. 1.5 Scope of this Research ... 87
Fig. 2.1 Three-Stage Wastewater Treatment in Taiwan ... 88
Fig. 2.2 Process of Biogas Production ... 88
Fig. 2.3 Range of Capacities for the Power Generators ... 89
Fig. 3.1 Experiment Layout & Biogas Pretreatment System... 89
Fig. 3.2 Schematic Procedure of Micro-Gas Turbine Engine ... 90
Fig. 3.3 CR30 Micro Turbine Engine ... 90
Fig. 3.4 TBT-FT004 Flow Meter ... 91
Fig. 3.5 Dehumidifier (RD-20A) ... 91
Fig. 3.6 Air Compressor (H-50) ... 92
Fig. 3.7 Gas Analyzer (ECA450) ... 92
Fig. 3.8 Guardian Plus Infra-Red Gas Monitor ... 93
Fig. 3.9 Humidity Temperature Meter (Center 311) ... 93
Fig. 3.10 Gas Analyzer (IR-208) ... 94
Fig. 3.11 The Marked Temperature for Theoretical Thermal Efficiency ... 94
Fig. 3.12 Ambient Temperature in Different Months in Taichung ... 95
Fig. 3.13 Experimental Error Bars for Net Power Output at 31.4 oC ... 95
Fig. 3.14 Experimental Error Bars for Biogas Volume Flow Rate at 31.4 oC ... 96
Fig. 3.15 Experimental Error Bars for Thermal Efficiencyat 31.4 oC
... 96
Fig. 3.16 CR30 System Stability in 15 kW... 97
Fig. 3.17 CR30 System Stability in 22 kW... 97
Fig. 4.1 The Calculation of the Theoretical Thermal Efficiency in 25 kW at 31.4 oC ... 98
Fig. 4.2 Generator Power Output V.S. Rated Power Output ... 98
Fig. 4.3 T-S Diagram for Gas Turbine Engine at 31.4 oC ... 99
Fig. 4.4 P-V Diagram for Gas Turbine Engine at 31.4 oC ... 99
Fig. 4.5 Power Consumption of Control System at 31.4 oC ... 100
Fig. 4.6 Net Power Output v.s. Rated Power Output ... 100
Fig. 4.7 Effect of Ambient Temperature in 22 kW ... 101
Fig. 4.8 Thermal efficiency v.s. Rated power output ... 101
Fig. 4.9 Cross-Section of Annular Combustor [27] ... 102
Fig. 4.10 Comparison of Net Power Output ... 102
Fig. 4.11 Comparison of Compressor Inlet Temperature... 103
Fig. 4.12 Comparison of Thermal Efficiency ... 103
Fig. 4.13 Least Square Method for Net Power Output ... 104
xii
Nomenclature
isen
Isentropic thermal efficiency
cal th,
Calculated thermal efficiency
actual th,
Actual thermal efficiency
T
Turbine isentropic efficiency
comb
Combustion efficiencymech
Mechanical efficiencyc
Compressor isentropic efficiency
HE
Heat exchanger effectiveness
generator
Generator efficiencyideal
Q
Ideal heat inputcal th
Q
, Calculated heat inputactual th
Q
, Actual heat inputT
W
Turbine output workC
W Compressor input work
isen T
W
, Isentropic turbine workisen C
W
, Isentropic compressor workpower net
W
, Net power outputgenerator
Nomenclature
n consumptio
W
Micro-gas turbine internal consumptionp
r
Pressure ratioT0 Measured ambient temperature
T1 Measured compressor inlet temperature T2s Isentropic compressor outlet temperature T2 Compressor outlet temperature
T3 Heat exchanger outlet temperature (air side)
T3s Isentropic heat exchanger outlet temperature (air side) T4 Combustor outlet temperature
T4s Isentropic Combustor outlet temperature T5 Isentropic turbine outlet temperature T5s Turbine outlet temperature
T6 Heat exchanger outlet temperature (gas side)
T6s Isentropic heat exchanger outlet temperature (gas side) Tbiogas Temperature of treated biogas
P1 Compressor inlet pressure P2 Compressor outlet pressure P3 Combustor inlet pressure P4 Turbine inlet pressure P5 Turbine outlet pressure
P6 Heat exchanger outlet pressure
r recuperato
P
Pressure drop of recuperator
combustor
P
xiv
Nomenclature
air p
C
, Air specific heat capacity at constant pressure4
,CH
p
C
Methane specific heat capacity at constant pressurebiogas p
C
, Biogas specific heat capacity at constant pressuregas p
C
, Hot gas specific heat capacity at constant pressureair
m
Air mass flow ratebiogas
m Biogas mass flow rate
4
CH
m
Methane mass flow rategas
m
Hot gas mass flow rateChapter 1
Introduction
1.1 Motivation and Background
Nowadays the global warming has become worse and worse due to the increasing concentration of greenhouse gases, which include carbon dioxide, chlorofluorocarbons, nitrous oxide, water vapor, methane etc., in atmosphere. The major contributor is carbon dioxide resultant from the combustion of fossil fuels, which plays the main role of power supply to mankind after industrial revolution. Figure 1.1 [22] shows the global carbon dioxide emission that especially grows so quickly from 1965 to 2013. In addition, with the increase of energy demand, the fossil fuels are expected to deplete in upcoming decades. Therefore, the researches of alternative energy are developed and their scales are expanded to respond to Green House effect and energy crisis.
In Taiwan, the main energy resources are from petroleum and coal that occupy 80% of total energy consumption per year. The percentage for the individual energy resource used in Taiwan’s power supply is shown in Fig. 1.2 [23]. It shows that only a small proportion of power consumption was from renewable energy in 2013, indicating that the development of related fields was insufficient. Furthermore, the imported energy resource reached 88.2% of the entire power supply in 1988, 99.3% in 1998 and 99.3% in 2013, showing that the energy resources depends on other countries significantly and they mainly are fossil fuels. As mentioned previously, these energy resources will produce a large amount of GHG, especially through thermal power generation. It is very crucial
2
to decrease the dependence of imported energy for the reason national security. Hence Taiwan's energy policy devotes to develop other energy sources, such as nuclear power and renewable energies, for the sustainability of industry sector and the low-carbon society.
However, the Lungmen nuclear power plant in Taiwan is a controversial issue, especially as the Fukushima nuclear power plants were almost destructive completely on March 11, 2011 by a severe earthquake occurred in the Western Pacific Ocean of Japan. The tsunami destroyed the cooling system of power plant and led to the meltdown of atomic reactors. The radiation pollution greatly affected the Japanese health and their related industry. For this reason, many Taiwanese show their intense concern on the Lungmen nuclear power plant and hope to stop building it.
In order to resolve the shortages of energy (including the stop running of nuclear power plants) and reduce carbon dioxide emission, the development of renewable energy in recent years has attracted many researchers’ attention. They include wind, solar, water and bio energy. This research is focus on power generation from gas turbine by using biogas, which is a kind of bioenergy. Bioenergy becomes more and more popular due to its advantage of stable supply and the contribution to environmental protection. Figure 1.3 shows the potential of biogas in Taiwan, which comes from different sources, including livestock waste, family waste water, landfill, industrial waste water. It can be found that the livestock waste is a main source of biogases and its quantity about 6
108 m3 per year.
impact on the environment. Thus, this study engages in using manure to produce biogas to generate the electric power and simultaneously alleviate the pressure of manure on environmental protection issue. Figure 1.4 shows a simple carbon cycle for biogas. Plants catch carbon dioxide from the atmosphere by photosynthesis, which uses solar radiation. Then, the livestock eat plants and discharge manure, which pollutes the environment. The pollutions can be treated by wastewater treatment system for alleviating the impact on environment and producing the biogas. The piston or gas turbine engine/generator can utilize biogas via combustion to produce electricity. Finally, the engine discharges the carbon dioxide to atmosphere. Thus, biogas can be regarded as a carbon neutral energy resource since it is produced from waste. This study uses biogas to supply a 30-kW gas turbine to generate electricity in a swine farm that is a continuous effort of Ge’s study [4]. The biogas is flammable because its contents mostly consists of methane (CH4), and the others are carbon dioxide (CO2), ammonia (NH3), hydrogen (H2), nitrogen (N2), hydrogen sulfide (H2S), and a small amount of organic compounds. In Ge’s study [4], the economic benefits of using biogas with 5,000 pigs were estimated. The results showed that it can totally generate 219,000 kW-h of electricity from the biogas and the corresponding CO2 can be decreased by 5000 ton/year. Apparently, CO2 emission and usage of fossil fuel can be reduced by using biogas in turbines.
This laboratory has been awarded a four-year research project by National Science and Technology Program for Energy from 2010 to 2013. The project is named as Development of the technology of agricultural
4
waste bioconversion to biogas for electricity generation and Carbon dioxide elimination by microalgae. Constructing a pilot biogas power
plant is the ultimate goal of this project, which divided into four subprojects. The subproject 1 is to upgrade the utilization efficiency of biogas by removing hydrogen sulfide (H2S) and CO2 to improve the biogas generation rate. The concentration of H2S is 5000 ppm in untreated biogas, stored in anaerobic tank. The high concentration H2S will corrode the turbine engine, so the H2S biological desulfurization system, developed by the subproject 1, was installed such that it could reduce H2S concentration from 5000 to 50 ppm effectively. In the subproject 2 (present research), the desulfurized biogas of subproject 1 is utilized to operate the engine to produce electricity under different monitoring parameters. The subject 3 is to produce biodiesel from high lipid-content algae utilizing waste CO2 either from the engine flue gas or the biogas itself. The purpose of the subject 4 is to investigate the operating conditions that affect biogas production rates and methane concentration emission during the anaerobic processes.
This study is subproject 2 that produces electricity by using turbine engine. In the first year of the project, Lin [1] used a 30 kW piston engine to construct a waste heat recovery system and to analyze the power output and thermal efficiency under different excess air ratios. Furthermore, the effect of oxygen-enriched combustion for engine was also tested. In the second year, Huang [2] applied a waste heat recovery system to analyze the preheating influence on the performance of power generation. Followed by Wu [3], a complete ignition measurement system was installed, consisting of spark plug pressure sensors and rotary encoder, to
record the in-cylinder pressure and crank angle of piston cylinder. He found the optimum spark timing provides the highest power production, thermal efficiency and CH4 utilization.
In 2013, Ge [4] tested the gas turbine engine by using 67% methane content of biogas. The performance of turbine engine under various operating loads was tested, and the energy analysis for micro turbine engine was studied. Besides, the comparison of CH4 consumption, thermal efficiency, air flow rate and biogas supply rate were analyzed by using piston and turbine engines. He found that the turbine engine speed will restrict the maximum power generation (25.23 kW), and the air flow is higher than the one in piston engine. In addition, under low workload, turbine engine can offer more stable power generation than piston engine. This study extends Ge’s experiments with different operating conditions and considers an important parameter, the ambient temperature. Consequently, the detailed theoretical calculations of turbine engine performance are carried out to investigate the exit temperatures for each component by thermodynamic formula and a comprehensive comparison with the work of Vidal et al. [19] is given.
6
1.2 Literature Review
Lin [1] tested different air-fuel ratios for 30 kW generator with 60% methane concentration of biogas in a swine farm in Miaoli, Taiwan. The oxygen-enriched combustion and waste heat recovery were also applied to his research. The results showed that a higher power output and better thermal efficiency can be achieved by a greater conversion of CH4 in the combustion process. The engine performances are not improved by 1% oxygen-enriched air. However, with 3% oxygen-enriched air, the maximum power generation and thermal efficiency increase, also the engine can operate at a lower limiting fuel supply rate. The waste heat recovery system is used to heat up water, which replaces the heating of nature gas and electricity, leading to an improvement of overall efficiency.
Huang [2] conducted experiments with 73% CH4 concentration of biogas to compare with the results of Lin [1] and applied the waste heat recovery system to preheat the inlet biogas under different temperatures. Also, Huang analyzed the preheating influence on the generation performance. The results showed that the power generation with 73% CH4 of biogas are higher than the one with 60% CH4 of biogas, except in the region around λ < 0.85. However, the thermal efficiency increases with the increasing methane concentration in the region of λ > 0.95. In the case of the increasing inlet biogas temperature effect, there is an obvious improvement on thermal efficiency when the temperature increases from 40 to 120 °C with 140 L/min biogas supply rate and λ=1.58.
Wu [3], the same as Lin [1] and Huang [2], used the same type of biogas generator and operated it under similar conditions to study the effects of the water vapor content in biogas and the spark timing on generator. The results showed that within a certain range of biogas supply rate, the biogas with dehumidification provides higher power generation and thermal efficiency than the one without dehumidification. The power outputs increasing rates under the biogas supply rates of 200, 220 and 240L/min at stoichiometric condition are up to 4.7, 5.9 and 2.7%. The dehumidified biogas offers enthalpy increasing rate up to 0.79%, 1.17% and 1.27% better than the biogas without dehumidification. Besides, the optimum spark timing of present engine is located at BTDC13, which can supply larger power output than the other spark timings. At a given biogas supply rate and excess air ratio, the power generation, thermal efficiency and CH4 utilization by operating at the spark timing of BTDC13 are the highest.
Ge [4] tested the 67% methane content of biogas by using gas turbine engine. The performance of turbine engine under various operating loads was tested, and the energy analysis for micro turbine engine was studied. Besides, the comparison of CH4 consumption, thermal efficiency, air flow rate and biogas supply rate were analyzed by using piston and turbine engines. The economic benefits were also estimated by the data obtained with 3000 and 5000 pigs in this research. He found that the engine speed will restrict maximum power generation (25.23 kW), and the air flow rate of turbine engine is higher than piston engine. In low workload, turbine engine can offer more stable power generation than piston engine. The results also showed that the range of
8
biogas flow rate for the turbine engine is from 184.9 to 251.8 L/min under varying loads ranged from 15 to 30 kW, and the maximum power generation, the corresponding thermal efficiency and the CH4 consumption rate is 25.23 kW, 23.12% and 168.7 L/min, respectively. For piston engine, the maximum power generation, the corresponding thermal efficiency and the CH4 consumption rate is 26.48 kW, 26.37% and 155.2 L/min, respectively. The estimated economic benefits showed that the net turbine power generation of 5000 pigs is greater than piston engine.
Cornelissen et al. [5] presented detailed analyses of the supply potential and the use of biomass in the context of a transition to a fully renewable global energy system by 2050. They also investigated bioenergy potential within a framework of technological choices and sustainability criteria, including the criteria on land use and food security, agricultural and processing inputs, complementary fellings, residues and waste. They found the potential for sustainable bioenergy from residues and waste, complementary fellings, energy crops and algae oil in 2050. The maximum of 2,500,000 km2 cropland is needed and a 75%-85% reduction of greenhouse gas can be achieved compared to fossil references.
Tsai and Lin [6] surveyed bioenergy from livestock manure management in Taiwan. With the practical characteristics of the total swine from the farm scale of over 1000 pigs, the quantity of methane generation from livestock was calculated (Gg). The results showed the following benefits (about 4.3 million pigs): emissions of methane is reduced to 21.5 Gg/year, total generated electricity is 7.2 × 10⁷ kWh per year, equivalent to electricity charge saving of US$ 7.2 × 10⁶ and carbon
dioxide mitigation of 500 Gg per year.
Su et al. [7] built a greenhouse gas production database from anaerobic livestock wastewater treatment processes in Taiwan, and made the comparison between the livestock wastewater treatment system presented by the IPCC with that used in Taiwan. Analysis of GHG samples from in situ anaerobic wastewater treatment systems of pig and dairy farms revealed, respectively, average emissions of 0.768 and 4.898/kgCH4, 0.714 and 4.200/kgCO2, and 0.002 and 0.011/kgN2O per pig in one year during three temperature periods, whereas average temperatures is <20, 20–25, and >25◦C. Average emissions rates of CH4 from selected pigs and dairy farms are lower than the limits imposed by the IPCC, because livestock manure is diluted before being treated with a solid/liquid separator and an anaerobic wastewater treatment system.
Basrawi et al. [8] investigated the effect of the inlet air temperature on the performance of micro gas turbine (MGT) with cogeneration system (CGS) arrangement. They used the model of the MGT-CGS to test the system performances by setting up on the basis of experimental results obtained in a previous study and a standard data that defines season interval. It was simulated under different ambient temperature conditions in a cold region. The results showed when temperature increases the electricity of the MGT decreases, but ratio of exhaust heat to mass flow rate and exhaust heat recovery to mass flow rate increases in summer peak. Furthermore, they also compared total energy efficiency, fuel energy saving and CO2 with two conventional systems. Besides, the MGT annually reduces 30,000-80,000 m3 of fuel consumption and 35-94 ton of CO emissions.
10
Kang [9] investigated the effect of firing biogas on the performance and operating characteristics of gas turbine. The simple and recuperative cycle engine was simulated in a similar power output. They tested it with biogas under different methane concentrations and found that gas turbine efficiency increases with decreasing methane concentration in the simple cycle engine, but efficiency decreases in the recuperative cycle engine. The CH4 content decreases with the decrease of net efficiency. Moreover, the heat recovery also increases by firing biogas. However, the reduction of the compress ratio and overheating of the turbine blade led to the increase of turbine flow. The results provide useful information for the operating strategies of biogas-fired gas turbine under the simultaneous limitations by the compressor surge and turbine overheating.
De Sa et al. [10] employed specific turbines SGT 94.2 and SGT94.3 in experiments installed at the DEWA Power Station which is located in Dubai, UAE. The purpose of the study was to obtain empirical relationship between the gas turbine’s ability to generate power when exposed to site ambient conditions, such as the ambient temperature. They tested the gas turbine thermal efficiency and useful power output under various ambient temperatures in different workloads. The results showed that the high ambient temperature leads to low thermal efficiency and useful power output. The gas turbine loses 0.1% thermal efficiency and 1.47MW of its Gross Power Output with every increase by 1 Kelvin. The gas turbine inlet temperature being a limiting factor as dictated by the turbine blade metallurgy and mass flow of air being is reduced at high temperature.
climate regions in Turkey. For both models, by using average monthly temperature data of regions, both the annual electricity production loss and fuel consumption increase compared to those in standard design conditions. The result showed that the electricity production loss about 2.87-0.71% compared to standard production occur in hot regions. When the temperature is above standard ambient temperature by 15 degree Celsius, electricity production loss rates would vary between 1.67% and 7.22%. Therefore, when the inlet temperature decreases to 10 degree, electricity generation increases from 0.27 to 10.28%.
Strub et al. [12] simulated the system by changing inlet air temperature with phase change refrigeration storage. The selected turbine was a land turbo-alternator that burned oil or natural gas and were used for Combined Heat and Power generation. The results showed that the volume of storage tank affects the electric output. The 51.5 m3 volume storage has enough electricity power to meet the New Delhi’s requirement due to the phase change materials can absorb more heat.
Yamada et al. [13] investigated the suitable size (electricity output capacity) for micro gas turbine cogeneration systems (MGT-CGSs) depending on scale of the sewage treatment plant and the effect of ambient temperature on heat demand of the plant performance under three ambient temperature conditions. They used the optimal combination of MGT-CGSs with different sizes, 30kW, 65kW, 200kW, and tested in different scales of the sewage treatment plant. The results showed that ratio of heat demand to energy of biogas produced increases when scale of the sewage treatment plant decreases, and the MGT has approximately the same fuel energy input under full load as the biogas energy produced
12
in the plant has the highest efficiency. Furthermore, MGT-Combination has the highest efficiency but its efficiency will be the same as that of the other MGT-CGSs when only comparatively constant operation is required throughout the year such as operation in a tropical region.
Wu [14] applied a commercial package CFD-ACE+ to simulate the combustion flow field in combustion chamber of a micro gas turbine. The research focused on the applications of CFD simulations on low heating value methane gas fuel for the acceptability of MV54 micro gas turbine. Two parameters were studied. One is the mass fraction of CH4 in the fuel mixture, consisting of CH4 and CO2, and the other is the turbine rotational speed. The simulation results showed that the thrust diminishes again as a result of adding non-fuel substance (CO2) into pure methane fuel. It also indicated that the total air mass flow rate of primary zone decreases with the reduction of turbine rotational speed. In addition, the flow field was analyzed by selecting the cross-sections, locating at symmetric face. The result showed that the CH4 mass fractions and temperature in primary zone increase with rising methane level.
Basrawi et al. [15] simulated two micro engine systems, cogeneration system (CGS) and trigeneration system (TGS). The two systems are used in residential buildings located in the area with tropical climate. The energy, economic and environmental performance of MGT-CGS and MGT-TGS were studied. The MGT-CGS consists of an MGT and an exhaust heat exchanger (EHE), whereas MGT-TGS equipped with other equipments such as an absorption heat pump and a heat storage device. The results showed that the payback period for the MGT-TGS is 13.8 years shorter than MGT-CGS, 14.3 years. The
MGT-TGS also has a higher Fuel Energy Saving Index FESI when compared to a gas turbine, but had a lower FESI when compared to a combined cycle gas turbine.
Lee et al. [16] used microturbines to promise power sources for small scale combined heat and power (CHP) systems. The power output and efficiency of microturbine decrease when ambient temperature increases. They also set up an analysis program for simulating the operation of a microturbines CHP system. The injection of water or steam into a microturbines CHP system was analyzed. The injection of hot water, which is generated at the heat recovery unit, at two different locations inside the microturbine was predicted. The results showed that injection at the recuperator inlet gives a higher efficiency than injection at the combustor in both water and steam injections. Steam injection provides a higher power generation efficiency than water injection on the average. The injection of steam at the recuperator inlet is most promising in terms of power generation efficiency. However, water injection at the recuperator also enhances power generation efficiency while still provides thermal energy to some extent.
Sheng et al. [17] investigated the effect of the ambient temperature on the performance of gas turbine since the electricity production, fuel consumption and plant incomes are affected by temperature. They found that the power decreases due to reduction in air mass flow rate and the efficiency decreases because the compressor requires more power to compress air in high temperature.
Bakalis and Stamatis [18] used the hybrid system, consisting of solid oxide fuel cell and Capstone micro-gas turbine system. The system was
14
simulated in Aspen PlusTM process simulator and analyzed its exergy destruction, the amount of work obtainable when the system is in unbalance state. The results showed that the SOFC stack and burner have the higher destruction rate of exergy. There is a large amount of exergy loss because of exhaust gases. And if the SOFC stack temperature is enhanced, the system exergy efficiency will increase. Besides, the CO2 emissions can be decreased by using this system mentioned above.
Vidal et al. [19] structured a simple model for the Capstone 30kW micro gas turbine and carried out the simulations at high ambient temperatures under the maximum rated power output to analyze the corresponding performance. Moreover, the turbine was working in a high-pressure system and a gas/water heat exchanger was installed to heat the cold water. This study adopted the experimental data, obtained from the CREVER research centre (Tarragona, Spain) by using propane to simulate the performance of MGT, as the initial conditions. The MGT model was simulated by Aspen Plus software (Aspen Plus, 2004), which can proceed the different steady state modeling applications. The results showed that the net output power decreases with increasing ambient temperature. The net power decreases 5.1% as the ambient temperature is raised from 24.4 to 28.9 and the electrical efficiency has 2% reduction. Leszek and Monika [20] analyzed the energy and exergy with sample device for micro turbines. The model applied the Brayton cycle and heuristic part-load performance formulas, and it was validated using the experimental data for a 30 kW micro gas turbine provided by Capstone. The results showed that the exergy destructions of the combustion chamber and recuperator are the main losses. The efficiency
of the recuperator can be increased when the air temperature enhances. A higher air temperature causes a less exergy destruction at the inlet of the combustion chamber.
Homam Nikpey Somehsaraei et al. [21] investigated the fuel flexibility and performance of micro gas turbine (100 kW). In order to achieve this purpose, the thermodynamic model (IPSEpro) was adopted and simulated the results by using experimental data obtained from T100 MGT in Stavanger, Norway. They analyzed the influences of the fuel change by replacing natural gas to biogas in different conditions, such as ambient temperature and power output. The results showed that the electrical efficiency and recuperator effectiveness decrease with an increase of power output, however, these will decrease with ambient temperature. The contents of methane (45, 60, and 70%) in biogas change the properties of fuel, so the power output and electrical efficiency of biogas decrease with the decreasing percentage of methane in biogas. Because of this reason, the biogas fuel mass flow rate is larger than natural gas one.
16
1.3 Scope of Present Study
The scope of this research is presented in Fig. 1.5. First, the treated biogas stored in the tank will be sucked into the combustion chamber when turbine engine is working. The components of biogas are measured by Gas Analyzer (IR-208) before entered into the engine, which is Capstone CR30 Micro Turbine engine, provided by the Aerospace Industrial Development Corporation (AIDC). The workloads vary from 15 to 30 kW and air flow and biogas supply rate change with the load accordingly and automatically. The biogas and air flow rates are recorded for analyzing performance of turbine engine. Since the influences of ambient temperature on the performance of gas turbine engine is very important, hence the performance of gas turbine engine are tested under different ambient temperatures (15~35oC) and loads (15~30 kW). The components of exhaust gases are also recorded. The gas turbine performance is analyzed by using thermodynamic formula to investigate the energy balance and entrance temperatures, which cannot be measured directly. Then, a comprehensive comparison with the work of Vidal et al. [19] is given to justify the effect of ambient temperature. Finally, the economic benefits are estimated by using C30 data, such as the electricity generation, equipment cost, maintenance cost et.al, to obtain the payback period and electricity cost per kWh and to estimate the potential application of biogas in Taiwan by using gas turbine engine.
Chapter 2
Biogas Generation System
2.1 Process of Biogas Production
The manure of swine is pretreated by using the three-step piggery wastewater treatment system to produce biogas, which has a hydrogen sulfide (H2S) will corrupt the engine. Fig. 2.1 and Fig. 2.2 show the process of biogas production including solid/liquid separation, anaerobic treatment and aerobic treatment (activated sludge treatment system). The manure of swine is collected and treated with wastewater treatment system. First, the separation of the solid from the waste water is to reduce the content of solids for subsequent handling and treatment, and to recovered solids can be used as fertilizer, etc. This physical process is accomplished by using various kinds of filters. Secondly, the anaerobic treatment which is conducted after solid/liquid separation, and occurs inside of anaerobic basins enclosed with “red-mud plastic (RMP) cover” (1.2~1.8mm of thickness), made of a kind of PVC material, which is corrosion-resistant and gas-and-water impermeable. Besides, the anaerobic treatment system can salvage a part of chemical energy content of wastewater by producing methane.
The anaerobic tank contains very high content of hydrogen sulfide (H2S), which can corrupt the power generator, so the desulfurization system is needed to remove H2S. The common method for reduction of hydrogen sulfide is biological desulfurization. In the process, the H2S is absorbed in water and then its content is reduced effectively by using
18
biological method. Finally, the biogas will be stored in a red plastic bag after the desulfurization process.
2.2 Utilization of Biogas
From 1990, the animal husbandry has been blooming in Taiwan, so the pollution of manure become more serious. In order to solve this problem, the three-step piggery waste water was built, which can produce biogas. There are some usages of biogas, ex: domestic fuel of gas stove, water heater. Besides, the application of power generator by using biogas had paid attention and expanded the scale gradually. The combined heat and power (CHP) generation plants is popular used in a four-stroke or a Diesel engine. The CHP generation can produce heat and power for higher energy efficiency simultaneously. It is a general way to transform energy of biogas at small or large-scale plants of biogas production.
Fig. 2.3 shows the range of capacities for the power generators, which are available on the market for the pilot-plant or industrial scale. The efficiency is defined as the ratio of the electrical power generated to the total energy content in the biogas. Efficiency figures are also provided by different manufacturers. Small-capacity engines generally can result in the lower efficiencies than that of high-capacity engines.
The generated electricity and heat can supply to the bioreactor itself, associated buildings, and neighboring industrial companies or houses. The power can be fed into the public electricity network, and the heat into the network for long-distance heat supply.
2.3 Engines
Table 2.1 presents some engines that can be operated with biogas. These have been improved during the recent years by developing the works which are inspired by the worldwide boom in biogas plants. Some manufacturers have already had the engine performances better than presented the Table 2.1.
Table 2.1 Comparison of Different Power Generators
Feature Four-stroke engine Gas-Diesel engine Stirling engine
Fuel cell Gas turbine Micro gas turbine Capacity(kW) <100 >150 <150 1-10000 20MW 28-200 Electrical efficiency 30-40% 35-40% 30-40% 40-70% 25-35% 15-25%
Pressure ratio 10:1 20:1 5:1 n.a. 5:1 5:1
Lifetime Medium Medium Long Very short Long Long Alternative fuel in case
of shortage of biogas
Liquid gas (gasoline)
Liquid gas Any Natural gas Natural gas Natural gas, Fuel oil
2.3.1 Micro Gas Turbine
Micro gas turbines are small high-speed gas turbines with low combustion chamber pressures and temperature, which are designed to generate the electrical powers between 28kW to 200kW. They are operated on a Brayton cycle, consisting of a gas compressor, a combustion chamber and an expansion turbine. This study use the CR30, which is micro gas turbine. For normal operation, the compressor sucks
20
in the combustion air. The fuel is normally supplied to meet the combustion air in the combustion chamber. When biogas with a low calorific value is used, it must be adjusted to a flammable mixture of biogas and air before it is supplied into the combustion chamber.
The electrical efficiency of 15~25% for today’s micro gas turbines is still unsatisfactorily low. An attempt to increase the efficiency has been made by preheating the combustion air in heat exchange with the hot turbine exhaust gases. But great improvements are still necessary before micro gas turbines can be introduced into the market of industrial biogas plants. However, the coupling of a micro gas turbine with a micro steam turbine to form a micro gas-steam turbine seems already interesting and economical today because of its high electrical efficiency.
2.3.2 Gas Turbine
Biogas can be converted to current via gas turbines of medium and large capacity (20 MW and more) at a maximum temperature 1200 °C. The tendency is to go to even higher temperatures and pressures, whereby the electrical capacity and thus the efficiency can be increased. The main parts of a gas turbine are the compressor, combustion chamber, and turbine.
Ambient air is sucked and compressed in the compressor and transmitted to the combustion chamber, where biogas is introduced and burnt with the compressed air. The flue gas that is so formed is passed to a turbine, where it expands and transfers its energy to the turbine. The turbine propels the compressor on the one hand and the power generator on the other hand. The exhaust gas leaves the turbine at a temperature of
approximately 400~600 °C. The waste heat can be recovered by driving a steam turbine downstream for heating purposes or for preheating the air that is sucked into the combustor
22
Chapter 3
Experimental Apparatus and Procedures
3.1 Experimental Layout
The Experiment layout and biogas pretreatment system are shown in Figure 3.1. The flow meter measuring the biogas flow rates is installed in front of inlet of combustor. The flow meter is automatically adjusted according to the change of engine load. The biogas and air flow rates are shown in flow meter and sucked into the combustion chamber when the turbine engine starts. In order to prevent turbine blade from heat damage, most of air will be used to cool the hot gas which is from outlet of combustion chamber. The desulfurized biogas is moved to biogas storage for this experiment.
First, the biogas will pass through the cyclone and filter for removing the liquid water and impurities which damage the engine. Then, the front compressor which treats biogas will increase the pressure and temperature of biogas by reducing its volume for corresponding pressure of combustor. The compressor outlet temperature is about 40 oC, and the pressure of biogas is 5 kgf / cm
2
. Secondly, the biogas will pass through Freeze dryer to remove water vapor for enhancing power output [3], the biogas temperature is reduced to 36 oC. Finally, the biogas will be stored in the biogas tank whose capacity is 800 liters for maintaining the pressure (5.6 kgf/cm
2
), and then the biogas is mixed with air and ignited in the combustor. Besides, the compositions of waste gases are measured by gas analyzer (IR-208), which is set at the engine outlet, and the waste gas temperature is measured by K-type thermocouple.
The electricity produced by micro-gas turbine (MGT) will supply to biogas pretreatment system for reducing energy consumption (~ 0.7 kW) from other power sources. Those devices include freeze dryer and compressor. Finally, the electricity is recorded by the power meter and supplied to parallel electric grid.
3.1.1 Micro-Gas Turbine Engine (CR30)
Figure 3.2 shows the schematic procedure of micro-gas turbine engine. The main components include centrifugal compressor, radial turbine, annular combustor and annular recuperator. The compressor, turbine and generator are mounted on the same shaft which is supported by patented air bearings and can spin at up to 96,000 RPM. The turbine provides power to drive compressor and generator.
First, the air passes through the air filter to remove the impurities, and then absorbs the heat from cooling fin of generator to protect generator from heating damage. Afterward, the air will be accelerated and pressured by compressor for attaining the limitations of pressure in combustion chamber, and then the compressed air will pass through the recuperator to enhance its temperature for reducing the consumption of fuel and increasing thermal efficiency. The fluid of heat exchanger is exhaust gases which are exhausted from outlet of turbine engine. Next, the air will be mixed with treated biogas and sucked into combustor for igniting. Finally, the hot gases drive the blades of turbine to generate electricity.
CR30 is controlled by digital power controller (DPC), which mainly controls the fuel valve, engine speed and turbine outlet temperature. In order to control the net power output, the DPC commands the fuel valve
24
(Woodward Valve) to achieve the rated power output by adjusting the engine speed. Moreover, the turbine outlet temperature is fixed at 594°C by turbine exhaust temperature sensor (TET). The limited temperature value is set by Capstone Turbine Corporation for protecting the turbine.
The biogas consists of CH4 and CO2 mainly that leads to a low heating value, so the biogas inlet velocity is higher than those of the natural gas and propane for obtaining the same input heat under the same workload. Thus, the fuel injector is designed as premix type. The single premix solenoid can control fuel flow and increase flame stability when medium or low BTU content fuels are used.
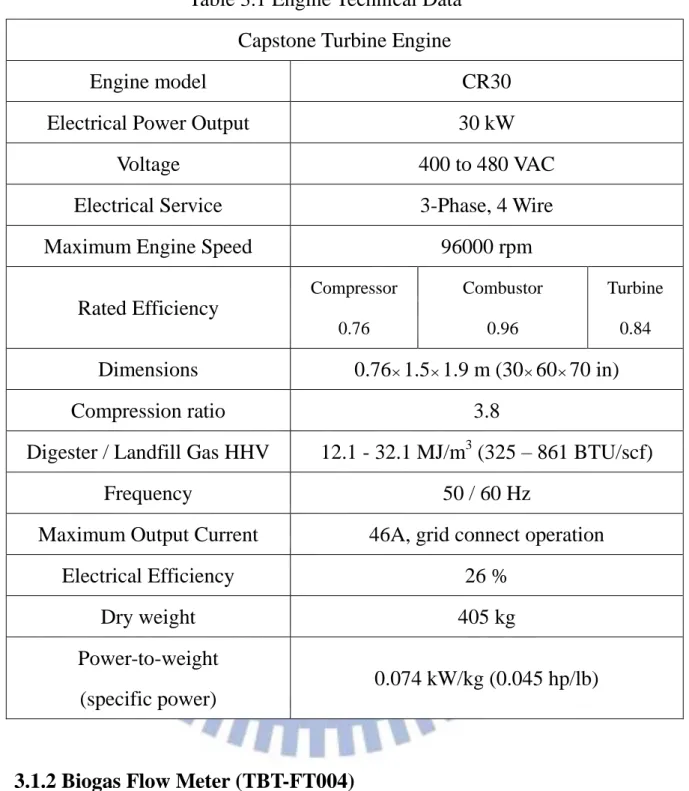
In ideal state, the system of turbine engine is Brayton cycle, which has four steps. They are isentropic compression, isobaric heating, isentropic expansion and isobaric heat rejection. The theoretical thermal efficiency calculation is analyzed by Brayton cycle. Figure 3.3 shows the CR30 equipments and the following Table 3.1 shows the detailed data of engine.
Table 3.1 Engine Technical Data Capstone Turbine Engine
Engine model CR30
Electrical Power Output 30 kW
Voltage 400 to 480 VAC
Electrical Service 3-Phase, 4 Wire
Maximum Engine Speed 96000 rpm
Rated Efficiency Compressor 0.76 Combustor 0.96 Turbine 0.84 Dimensions 0.761.51.9 m (306070 in) Compression ratio 3.8
Digester / Landfill Gas HHV 12.1 - 32.1 MJ/m3 (325 – 861 BTU/scf)
Frequency 50 / 60 Hz
Maximum Output Current 46A, grid connect operation
Electrical Efficiency 26 %
Dry weight 405 kg
Power-to-weight (specific power)
0.074 kW/kg (0.045 hp/lb)
3.1.2 Biogas Flow Meter (TBT-FT004)
Fig 3.4 shows the mass flow transmitter, TBT-FT004, used for measuring the mass flow rate. The mass flow transmitter is used almost entirely for gas flow applications, such as compressive gas, mixed gas and unexplosive gas. The minimum length ahead the sensor along the pipe should be 10 times of pipe diameter and 5 times behind sensor for
26
forming the fully developed flow. The principle of flow meter is thermal-mass flow, which measures fluid mass flow rate by means of the heat convected from a heated surface to the flowing fluid. It uses heat to measure flow, and then it introduces heat into the flow steam and measures how much heat dissipates using one or more temperature sensors, hence, the heated temperature sensor is controlled by power supply and the temperature difference between these two sensors have to keep constant under a fixed mass flow rate. The different mass flow rate will result in different temperature difference. Therefore, it can deduce the mass flow rate of fluid by the quantity of power supply to maintain the temperature difference between two sensors. The TBT-FT004 data are shown in Table 3.2.
Table 3.2 TBT-FT004 Flow Meter Data
Measuring object Gas (40 oC 5.6 kgf / cm2G)
Measured unit min , min , min , 3 3 kg l m h m Power supply 12~30 VDC, 100 mA Range ability 300 : 1 Accuracy 3% Temperature Range -30 oC ~50 oC
Max. Pressure 1.6 MPa
Scale Range 0.2~90 m3/h
3.1.3 Dehumidifier (RD-20A)
Figure 3.5 shows the dehumidifier, GTT RD-20A, used for removing the water vapor of biogas. The maximum inlet biogas flow rate is 44 L/sec. It is pre-cooled as biogas leaves from the evaporator. The coolant in the dehumidifier is R-134a. The detailed data of RD-20A are given in the Table 3.3.
Table 3.3 RD-20A Dehumidifier Data
Dehumidifier Model RD-20A
Inlet Temperature 80°C
Inlet Pressure 7 kg/cm2
Air Volume Rate 2.5 Nm3/Min
Refrigerant R-134a
Power 220V, 1Hz
Horsepower 1/2 HP
3.1.4 Air Compressor (H-50)
Figure 3.6 shows the compressor (H-50). It is used to compress the biogas for complying to the pressure of preheated air, which is compressed by inner compressor. If the biogas cannot attain the need of pressure level, the control system of CR30 will shut compressor down for protecting the machine. The detailed data of H-50 are shown in the Table 3.4.
28
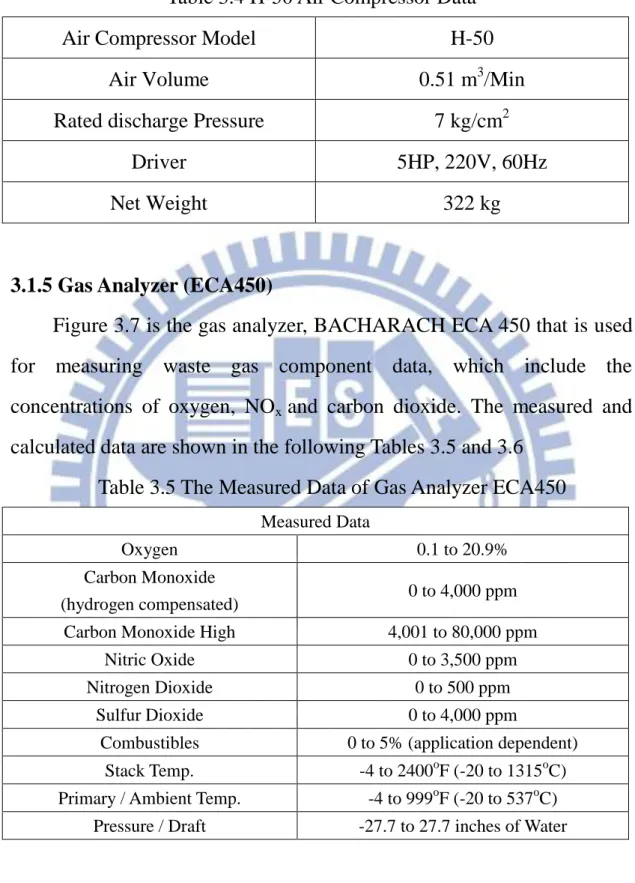
Table 3.4 H-50 Air Compressor Data
Air Compressor Model H-50
Air Volume 0.51 m3/Min
Rated discharge Pressure 7 kg/cm2
Driver 5HP, 220V, 60Hz
Net Weight 322 kg
3.1.5 Gas Analyzer (ECA450)
Figure 3.7 is the gas analyzer, BACHARACH ECA 450 that is used for measuring waste gas component data, which include the concentrations of oxygen, NOx and carbon dioxide. The measured and calculated data are shown in the following Tables 3.5 and 3.6
Table 3.5 The Measured Data of Gas Analyzer ECA450
Measured Data
Oxygen 0.1 to 20.9%
Carbon Monoxide
(hydrogen compensated) 0 to 4,000 ppm
Carbon Monoxide High 4,001 to 80,000 ppm
Nitric Oxide 0 to 3,500 ppm
Nitrogen Dioxide 0 to 500 ppm
Sulfur Dioxide 0 to 4,000 ppm
Combustibles 0 to 5% (application dependent) Stack Temp. -4 to 2400oF (-20 to 1315oC) Primary / Ambient Temp. -4 to 999oF (-20 to 537oC)
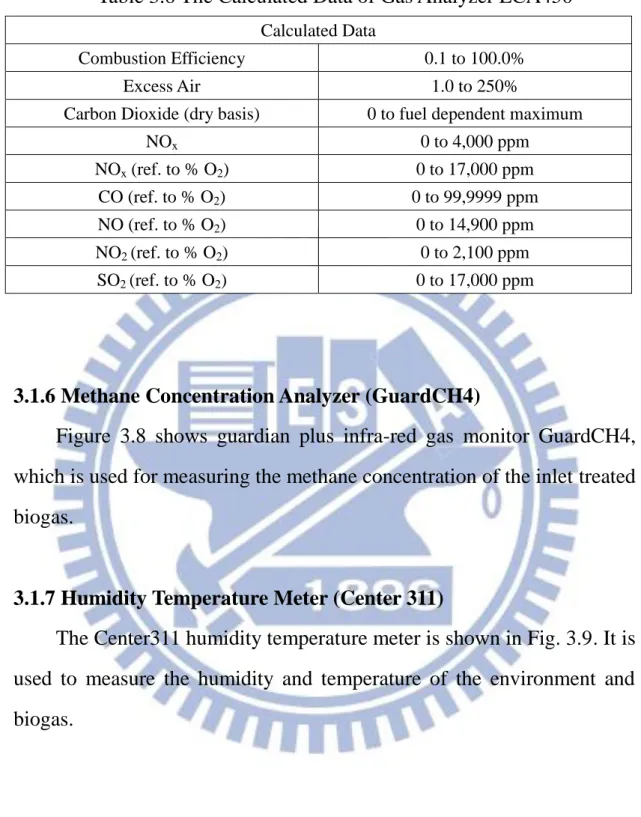
Table 3.6 The Calculated Data of Gas Analyzer ECA450
Calculated Data
Combustion Efficiency 0.1 to 100.0%
Excess Air 1.0 to 250%
Carbon Dioxide (dry basis) 0 to fuel dependent maximum
NOx 0 to 4,000 ppm NOx (ref. to % O2) 0 to 17,000 ppm CO (ref. to % O2) 0 to 99,9999 ppm NO (ref. to % O2) 0 to 14,900 ppm NO2 (ref. to % O2) 0 to 2,100 ppm SO2 (ref. to % O2) 0 to 17,000 ppm
3.1.6 Methane Concentration Analyzer (GuardCH4)
Figure 3.8 shows guardian plus infra-red gas monitor GuardCH4, which is used for measuring the methane concentration of the inlet treated biogas.
3.1.7 Humidity Temperature Meter (Center 311)
The Center311 humidity temperature meter is shown in Fig. 3.9. It is used to measure the humidity and temperature of the environment and biogas.
3.1.8 Gas Analyzer (IR-208)
Figure 3.10 shows the IR-208 Gas Analyzer. It integrates two different types of gas measurement into one instrument. A multiple channel infrared detector array utilizing a single beam infrared optical
30
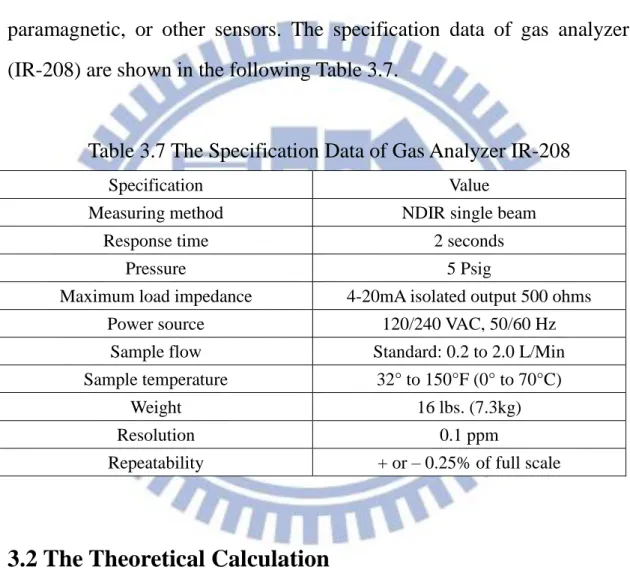
system detects target gases using specially designed narrow band-pass optical filters. Comparing the infrared absorption of the reactive detectors to the nonreactive detector in the array provides the comparative for measuring the gas concentration in the sample stream. With a choice of more than 270 gases, up to 3 gases can be measured under infrared and up to 3 additional gases can be measured utilizing electrochemical cell, paramagnetic, or other sensors. The specification data of gas analyzer (IR-208) are shown in the following Table 3.7.
Table 3.7 The Specification Data of Gas Analyzer IR-208
Specification Value
Measuring method NDIR single beam
Response time 2 seconds
Pressure 5 Psig
Maximum load impedance 4-20mA isolated output 500 ohms
Power source 120/240 VAC, 50/60 Hz
Sample flow Standard: 0.2 to 2.0 L/Min
Sample temperature 32° to 150°F (0° to 70°C)
Weight 16 lbs. (7.3kg)
Resolution 0.1 ppm
Repeatability + or – 0.25% of full scale
3.2 The Theoretical Calculation
The following calculations include the excess air ratio, thermal efficiency, theoretical fraction of mole of CO2 in waste gases, the percentage of water vapor removed from biogas. These data will be used in the analysis of the following experiments.
3.2.1 Excess Air Ratio
The air-fuel ratio (AF) is defined as a ratio of mole of air to the one of
fuel in the combustion process. The treated biogas contains air, which leaks from atmosphere to the storage tank when the pipe of anaerobic fermentation pool is too low. Hence, the stoichiometric reaction for combustion of biogas with standard air is given as:
𝐶𝐻4+ 𝑥𝐶𝑂2+ 𝑦(𝑂2+ 3.76𝑁2) + 𝑧𝐻2𝑂 + (2 − 𝑦)(𝑂2+ 3.76𝑁2) → (1 + 𝑥)𝐶𝑂2+ (𝑧 + 2)𝐻2𝑂 + 7.52𝑁2 (3.1)
where x, y and z are the moles of CO2, air and water vapor in the biogas, respectively. Both x and y can be measured by instruments, and then z can be obtained from the absolute humidity () of biogas. Since the water vapor is considered as an ideal gas, the percentage of vapor from biogas can be calculated as follows:
𝑀𝑜𝑙𝑒 𝐹𝑟𝑎𝑐𝑡𝑖𝑜𝑛 𝑜𝑓 𝐻2𝑂 𝑖𝑛 𝐵𝑖𝑜𝑔𝑎𝑠(%) = 18
16𝛼+44𝛽+28.8𝛾 𝑃𝑣
𝑃𝑏𝑖𝑜𝑔𝑎𝑠−𝑃𝑣 (3.2)
where , and are the percentages of CH4, CO2 in biogas and air in biogas, respectively. Pbiogas is the pressure of biogas and Pv is the vapor pressure in biogas, which is obtained from:
𝑃𝑣 = 𝛷𝑃𝑔 (3.3)
32
saturation pressure of vapor at the same temperature. The stoichiometric air-fuel ratio, AFstoich is :
𝐴𝐹𝑠𝑡𝑜𝑖𝑐ℎ =𝑚𝑜𝑙𝑒 𝑜𝑓 𝐶𝐻 𝑚𝑜𝑙𝑒 𝑜𝑓 𝑎𝑖𝑟
4+𝑚𝑜𝑙𝑒 𝑜𝑓 𝐶𝑂2+𝑚𝑜𝑙𝑒 𝑜𝑓 𝑎𝑖𝑟 𝑖𝑛 𝑏𝑖𝑜𝑔𝑎𝑠+𝑚𝑜𝑙𝑒 𝑜𝑓 𝐻2𝑂
= (1+𝑥+𝑦×4.76+𝑧)𝑚𝑜𝑙𝑒 (2−𝑦)×4.76𝑚𝑜𝑙𝑒 (3.4)
On the other hand, AFact is the air-fuel ratio of the actual mole of the air to the summation of moles of the methane, CO2 and air in biogas into the engine. Because the mole ratio is equal to the volume flow rate ratio, and the summation of the methane, CO2, air and water vapor in biogas flow rate is equal to the biogas flow rate. AFact can be also expressed as:
𝐴𝐹𝑎𝑐𝑡 =(𝑚𝑜𝑙𝑒 𝑜𝑓 𝐶𝐻 (𝑚𝑜𝑙𝑒 𝑜𝑓 𝑎𝑖𝑟 )𝑎𝑐𝑡
4+ 𝑚𝑜𝑙𝑒 𝑜𝑓 𝐶𝑂2+ 𝑚𝑜𝑙𝑒 𝑜𝑓 𝑎𝑖𝑟 𝑖𝑛 𝑏𝑖𝑜𝑔𝑎𝑠 + 𝑚𝑜𝑙𝑒 𝑜𝑓 𝐻2𝑂)𝑎𝑐𝑡
= 𝐴𝑖𝑟 𝑓𝑙𝑜𝑤 𝑟𝑎𝑡𝑒
𝐶𝐻4 𝑓𝑙𝑜𝑤 𝑟𝑎𝑡𝑒 + 𝐶𝑂2𝑓𝑙𝑜𝑤 𝑟𝑎𝑡𝑒 + 𝑎𝑖𝑟 𝑓𝑙𝑜𝑤 𝑟𝑎𝑡𝑒 𝑖𝑛 𝑏𝑖𝑜𝑔𝑎𝑠 + 𝐻2𝑂 𝑓𝑙𝑜𝑤 𝑟𝑎𝑡𝑒 =𝐵𝑖𝑜𝑔𝑎𝑠 𝑓𝑙𝑜𝑤 𝑟𝑎𝑡𝑒𝐴𝑖𝑟 𝑓𝑙𝑜𝑤 𝑟𝑎𝑡𝑒 (3.5)
The air flow rate can be measured by air flow meter directly, whereas the methane flow rate is obtained by the measured biogas flow rate multiplied by the mole fraction of methane.
The Excess Air Ratio () is the ratio of the actual mole of air used to the stoichiometric mole of air, defined as:
𝜆 = (𝑚𝑜𝑙𝑒 𝑜𝑓 𝑎𝑖𝑟)𝑎𝑐𝑡 (𝑚𝑜𝑙𝑒 𝑜𝑓 𝑎𝑖𝑟)𝑠𝑡𝑜𝑖𝑐ℎ = (𝑚𝑜𝑙𝑒 𝑜𝑓 𝑓𝑢𝑒𝑙𝑚𝑜𝑙𝑒 𝑜𝑓 𝑎𝑖𝑟)𝑎𝑐𝑡 (𝑚𝑜𝑙𝑒 𝑜𝑓 𝑓𝑢𝑒𝑙𝑚𝑜𝑙𝑒 𝑜𝑓 𝑎𝑖𝑟)𝑠𝑡𝑜𝑖𝑐ℎ = 𝐴𝐹𝑎𝑐𝑡 𝐴𝐹𝑠𝑡𝑜𝑖𝑐ℎ (3.6)
Note that the actual mole of fuel is equal to stoichiometric mole of fuel because in the engine experiments the fuel supply rate is fixed, whereas the air volume flow rate is changed. As a consequence, the excess air ratio is equal to ratio of AFact to AFstoich. The is reciprocal of equivalence ratio. In this study, the most of air is used to cool the hot gas for protecting the blades of turbine.
3.2.2 Thermal Efficiency
The thermal efficiency is defined as the ratio of the actual power generation to the energy input, and its formula is as following:
𝑇ℎ𝑒𝑟𝑚𝑎𝑙 𝐸𝑓𝑓𝑖𝑐𝑖𝑒𝑛𝑐𝑦 = 𝐴𝑐𝑡𝑢𝑎𝑙 𝑃𝑜𝑤𝑒𝑟 𝐺𝑒𝑛𝑒𝑟𝑎𝑡𝑖𝑜𝑛
𝐸𝑛𝑒𝑟𝑔𝑦 𝐼𝑛𝑝𝑢𝑡 (3.7)
The actual power generation of this study is the net power output of turbine generator. The energy input is calculated from the lower heating value (LHV) of methane, whose value is 50020 kJ / kg. It is expressed as following: 4 4 LHV of CH m Input Energy CH (3.8) where 4 CH
m is the methane mass flow rate in biogas, and is calculated by : atm CH atm biogas biogas CH V mf m @1 ,25C @5 4 4
(3.9)34
where Vbiogas is measured biogas volumetric flow rate, biogas@1atm,25C is
density of biogas in normal condition. mfCH4@5atm is mass fraction of
CH4 in biogas at five atmospheric pressure.
3.2.3 Least Square Method
The least square method is applied to find the curve which represents the relationship between the measured data, and the curve has minimum value that the sum of the square of the distance which is all the data points to the curve. This study uses first-order linear curve to do the least square method for finding the representative curve. The equations are expressed as following:
b ax x f( ) (3.10)
n i i n i i n i n i n i i i i i x n x y x n y x a 1 2 2 1 1 1 1 ) ( (3.11)
n i i n i i n i n i n i n i i i i i i x n x x y x y x b 1 2 2 1 1 1 1 1 2 ) ( (3.12) where a is slope of the line, b intercept and n the number of measured values.In order to ensure whether the curve can represent the measured data, the goodness of fit (R2) is a good indicator for examining the linear regression. The goodness of fit is given as following:
yy xx xy ss ss ss R 2 2 (3.13)
n i i xx x x ss 1 2 ) ( (3.14)
n i i yy y y ss 1 2 ) ( (3.15)
n i i i xy x x y y ss 1 ) )( ( (3.16)where x and y are the average measured data.
If the R2 is higher, the curve can represent the good tendency of measured data. When R2 equals to 1, it is called perfect fit, meaning that the regressive model does not exist the residuals.
3.3 Waste Gas Analysis
The contents of waste gases include O2, CO2, CO and NOx. The gas analyzer (IR-208) can measure the concentrations of waste gases. However, the gas turbine needs most of the air to cool the hot gas to avoid damaging the turbine. Thus, the concentration of NOx is too low to measure by instrument.
The measured O2 data can be applied to estimate CO2, excess air ratio and mole number of waste gas composition. Because the cooling air is mixed with produced CO2, the measured concentration of CO2 is larger than actual one. Moreover, the quantity of air is much higher than CH4 in exhaust gases, hence, the term of methane does not appear in actual reaction formula. Eq. (3.1) is modified by the excess air ratio for obtaining the actual reaction formula. Eq. (3.17) can find the concentration of CO2 and excess air ratio by the O2 mole fraction.