Asia Pacific Management Review 18(1) (2013) xx-xx
233
Controlling Shareholders and Earnings Informativeness: Evidence from Taiwan
Jei-FangLewa,*, Shing-Jen WubaDepartment of Accounting, National Kaohsiung University of Applied Sciences, Taiwan bDepartment of Accounting, Soochow University, Taiwan
Received 10 December 2010; Received in revised form 5 October 2011; Accepted 30 March 2012
Abstract
Taiwanese listed corporations, characterized by a high degree of separation between control rights and cash flow rights, are empirically studied in this research. This study investigates how the separation of cash flow rights from board seat control rights, as distinct from voting rights, affects the informativeness of earnings, as measured by the relationship between returns and earnings. This study extends the extant research by investigating the extent to which the level of disparity between these two rights affects the magnitude of earnings informativeness. Based on an empirical sample of Taiwanese listed corporations, the results indicate that earnings are generally less informative when there is a divergence between board seat control rights and cash flow rights.
Keywords: Earnings informativeness, ownership structure, board seat control rights. 1. Introduction*
Ownership concentration and ineffective corporate governance were two factors that contributed to the Asian financial crisis in 1997 (hereafter referred to as the Crisis) (Prowse, 1998). In particular, areas of concern included concentrated ownership, the dominance of controlling shareholders, separation of control rights and cash flow rights, and the limited protection of minority rights. These problems were particularly acute in countries negatively affected by the Crisis (Claessens et al., 2000). Since the Crisis, there has been increasing investor demand requesting corporate governance reforms in emerging markets (Johnson et al., 2000; Gibson, 2003). Taiwan provides an ideal setting for examining the effectiveness of corporate governance due to the high ownership concentration, weak legal protection for shareholders, deficient law enforcement, and the abundance of family controlled firms (La Porta et al., 1999; Lemmon and Lins, 2003).
However, according to Claessens et al. (2002), regarding their opinion in the Journal of Finance, 2002, the empirical data for Asian countries including Hong Kong, Indonesia, and South Korea all suggested that the divergence of ownership and control rights had a negative correlation with firm value, but this trend was not as evident in the empirical results on Taiwan. Moreover, the level of divergence demonstrated by Taiwanese corporations was generally lower than that shown by corporations in Singapore, Japan, and Indonesia. They stated:
*Corresponding author: [email protected] **DOI: 10.6126/APMR.2013.18.1.06
K.A. Hendartoa, B.M. Purwantob / Asia Pacific Management Review 18(1) (2013)xx-xx
249
(B) – (A) 29.16% - 13.49% = 15.67% Deviation between control seats and control holdings (via proxy contests)
References
Asian Wall Street Journal. (1999) Business transparency in region has worsened. Survey shows, November 24, 5.
Atiase, R.K. (1985) Predisclosure information, firm capitalization, and security price behavior around earnings announcement. Journal of Accounting Research, 23, 21-36.
Chaney, P., Jeter, D. (1992) The effect of size on the magnitude of long-window earnings response coefficients. Contemporary Accounting Research, 8, 540-560.
Claessens, S., Djankov, S., Lang, H.P. (2000) The separation of ownership and control in East Asian corporations. Journal of Financial Economics, 58, 81-112.
Claessens, S., Djankov, S., Fan, J., Lang, H.P. (2002) Disentangling the incentive and entrenchment effects of large shareholders. Journal of Finance, 57(6), 2741-2771.
Collins, D.W., Kothari, S.P. (1989) An analysis of intertemporal and cross-sectional determinants of earnings response coefficient. Journal of Accounting and Economics, 11, 143-181.
Core, J., Guay, W. (1999) The use of equity grants to manage optimal equity incentive levels. Journal of Accounting and Economics, 28, 151-184.
DeAngelo H., DeAngelo, L., Skinner, D. (1992) Dividends and losses. Journal of Finance, 47, 1837-1863.
Demsetz, H., Lehn, K. (1985) The structure of ownership: causes and consequences. Journal of Political Economy, 93, 1155-1177.
Dhaliwal, D., Lee, K., Fargher, N. (1991) The association between unexpected earnings and abnormal security returns in the presence of financial leverage. Contemporary Accounting Research, 8, 20-41.
Easton, P., Harris, T. (1991) Earnings as an explanatory variable for returns. Journal of Accounting Research, 29(1), 19-36.
Faccio, M., Lang, L., Young, L. (2001) Dividends and expropriation. American Economic Review, 91(1), 54-78.
Faccio, M., Lang, L. (2002) The ultimate ownership in Western European corporations. Journal of Financial Economics, 65, 365-395.
Fama, E., MacBeth, J. (1973) Risk, return and equilibrium: Empirical tests. Journal of Political Economy, 81, 607-636.
Fan, P.H., Wong, T.J. (2002) Corporate ownership structure and the informativenss of accounting earnings. Journal of Accounting and Economics, 33, 401-425.
Francks, J., Smith, A. (1995) Agency costs and innovation: Some empirical evidence. Journal of Accounting and Economics, 19, 383-409.
Francis J., Schipper, K., Vincent, L. (2005) Earnings and dividend informativeness when cash flow rights are separated from voting rights. Journal of Accounting and Economics, 39, 329-360.
Freeman, R. (1987) The association between accounting earnings and security returns for large and small firms. Journal of Accounting and Economics, 55, 615-646.
Gibson, M.S. (2003) Is corporate governance ineffective in emerging markets? Journal of Financial and Quantitative Analysis, 38, 231-250.
Hartzell, J., Starks, L. (2003) Institutional investors and executive compensation. Journal of Finance, 58, 2351-2374.
Haw, I.M., Hu, B., Hwang, L.S., Wu, W. (2004) Ultimate ownership, income management, and legal and extra-legal institutions. Journal of Accounting Research, 42, 423-462.
K.A. Hendartoa, B.M. Purwantob / Asia Pacific Management Review 18(1) (2013)xx-xx
250
Hayn, C. (1995) The information content of losses. Journal of Accounting and Economics, 20, 125-153.
Imhoff, E., Lobo, G. (1992) The effect of ex ante earnings uncertainty on earnings response coefficients. The Accounting Review, 67, 427-439.
Jensen, M.C., Meckling, W.H. (1976) Theory of the firm: Managerial behavior, agency costs and ownership structure. Journal of Financial Economics, 3, 305-360.
Jensen, M.C. and Ruback, R.S. (1983) The market for corporate control: Empirical evidence. Journal of Financial Economics, 11(1-4), 5-50.
Johnson, S., Boone, P., Breach, A., Friedman, E. (2000) Corporate governance in the Asian financial crisis. Journal of Financial Economics, 58, 141-186.
La Porta, R., Lopez-de-Silanes, F., Shleifer, A. (1999) Corporate ownership around the world. Journal of Finance, 54, 471-517.
La Porta, R., Lopez-de-Silanes, F., Shleifer, A., Vishny, R. (2000) Agency problems and dividend policies around the world. Journal of Finance, 55, 1-33.
Lemmon, M.L., Lins, K.V. (2003) Ownership structure, corporate governance, and firm value: Evidence from the East Asian financial crisis. Journal of Finance, 58, 1445-1468.
Morck, R., Shleifer, A, Vishny W. (1988) Management ownership and market valuation: An empirical analysis. Journal of Financial Economics, 20(1-2), 293-315.
Prowse, S. (1998) Corporate governance: Emerging issues and lessens from East Asia. Responding to the global financial crisis. World Bank memo.
Shleifer, A., Vishny, R. (1997) A survey of corporate governance. Journal of Finance, 52, 737-783.
Subramanyam, K.R., Wild, J. (1996) Going-concern status, earnings persistence, and informativeness of earnings. Contemporary Accounting Research, 13, 251-273.
Teoh, S., Wong, T.J. (1993) Perceived auditor quality and the earnings response coefficient. The Accounting Review, 68, 346-366.
Warfield, T., Wild, J., Wild, K. (1995) Managerial ownership, accounting choices and informativeness of earnings. Journal of Accounting and Economics, 20, 61-91.
Yeh, Y.H. (2005) Do controlling shareholders enhance corporate value? Corporate Governance: An International Review, 13, 313-325.
Yeh, Y.H., Ko, C.E., Su, Y.H. (2003) Ultimate control and expropriation of minority shareholders: New evidence from Taiwan. Academic Economic Papers, 31(3), 263-299. Yeh, Y.H., Woidtke, T. (2005) Commitment or entrenchment? Controlling shareholders and
board composition. Journal of Banking and Finance, 29(7), 1857-1885.
Yeo, G.., Tan, P., Ho, K., Chen, S. (2002) Corporate ownership structure and the informativeness of earnings. Journal of Business, Finance and Accounting, 29, 1023-1046.
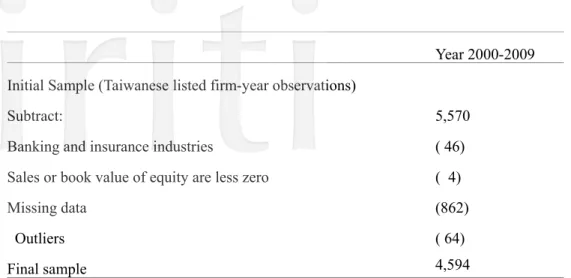
Table 1. Sample selection and distribution Panel A: Sample selection procedure
K.A. Hendartoa, B.M. Purwantob / Asia Pacific Management Review 18(1) (2013)xx-xx
251
Year 2000-2009
Initial Sample (Taiwanese listed firm-year observations)
5,570 ( 46) ( 4) (862) ( 64) 4,594 Subtract:
Banking and insurance industries
Sales or book value of equity are less zero Missing data
Outliers Final sample
Panel B: Sample distribution by year and industry
Industry 2000 2001 2002 2003 2004 2005 2006 2007 2008 2009 Total Number Percent 11 Cement 6 6 6 6 6 7 7 7 7 7 65 1.41 12 Food 9 9 11 14 14 15 20 20 20 19 151 3.29 13 Plastics 14 16 15 16 16 19 20 21 21 21 179 3.90 14 Textiles 18 20 24 25 26 27 39 41 38 36 294 6.40 15 Electric and machinery 11 10 16 17 23 24 32 32 33 31 229 4.98 16 Electrical appliance and cable 7 7 7 7 7 8 12 12 12 12 91 1.98 17 Chemical 12 13 14 19 21 23 27 29 30 33 221 4.81 18 Glass and ceramics 3 3 3 3 4 4 4 4 4 3 35 0.76
19 Paper and pulp 5 5 4 4 5 6 7 7 7 7 57 1.24
20 Steel and iron 10 8 9 11 12 15 22 22 21 20 150 3.27
21 Rubber 6 7 7 8 8 8 9 10 9 10 82 1.78 22 Automobile 2 4 4 4 4 5 5 5 5 4 42 0.91 23 Electronics 98 133 167 192 219 236 285 301 313 304 2248 48.93 25 Construction 12 12 18 11 19 22 30 31 30 30 215 4.68 26 Transportation 10 11 11 12 14 14 16 17 17 17 139 3.03 27 Tourism 2 2 2 2 2 2 3 4 4 4 27 0.59 29 Department stores 6 7 8 9 9 9 9 8 9 9 83 1.81 99 Other 21 24 26 27 27 31 32 32 33 33 286 6.23 Total 252 297 352 387 436 475 579 603 613 600 4594 100%
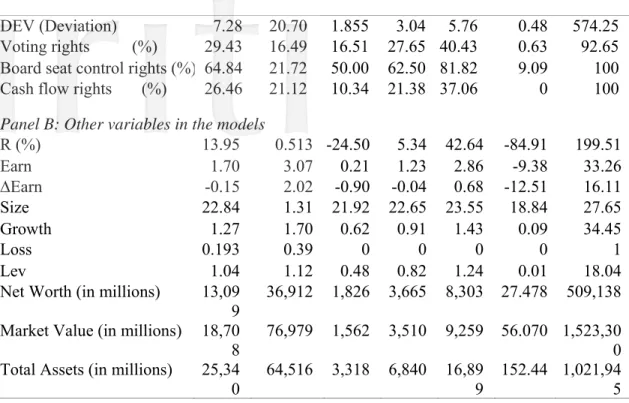
Table 2. Descriptive statistics (640 firms, 4594 firm-year observations)
Variables Mean Std. dev. Q1 Median Q3 Min Max
K.A. Hendartoa, B.M. Purwantob / Asia Pacific Management Review 18(1) (2013)xx-xx
252
DEV (Deviation) 7.28 20.70 1.855 3.04 5.76 0.48 574.25
Voting rights (%) 29.43 16.49 16.51 27.65 40.43 0.63 92.65
Board seat control rights (%) 64.84 21.72 50.00 62.50 81.82 9.09 100
Cash flow rights (%) 26.46 21.12 10.34 21.38 37.06 0 100
Panel B: Other variables in the models
R (%) 13.95 0.513 -24.50 5.34 42.64 -84.91 199.51 Earn 1.70 3.07 0.21 1.23 2.86 -9.38 33.26 ∆Earn -0.15 2.02 -0.90 -0.04 0.68 -12.51 16.11 Size 22.84 1.31 21.92 22.65 23.55 18.84 27.65 Growth 1.27 1.70 0.62 0.91 1.43 0.09 34.45 Loss 0.193 0.39 0 0 0 0 1 Lev 1.04 1.12 0.48 0.82 1.24 0.01 18.04
Net Worth (in millions) 13,09
9 36,912 1,826 3,665 8,303 27.478 509,138
Market Value (in millions) 18,70
8 76,979 1,562 3,510 9,259 56.070 1,523,300 Total Assets (in millions) 25,34
0 64,516 3,318 6,840 16,899 152.44 1,021,945 Variables definition: DEV is the calculated multiple of board seat control rights over cash flow rights. Voting rights is the procedure of identifying ultimate owners used in La Porta et al. (1999). Board seat control rights are the ratio of board members controlled by the ultimate owners to board size. Cash flow rights are the cash flow right held by the controlling shareholder. R is measured by the cumulative 12-month raw stock return until four months after the end of fiscal year t. Earn is earning per share (before extraordinary items) for fiscal year t. ∆Earn is the change in Earn. Size is the size of firm which is measured as natural log of total assets at the end of year t-1. Growth is M/B ratio computed as the market value of equity/book value of equity. Loss is loss incidence which equals 1 if firm’s earnings before extraordinary items are less than 0, and 0 otherwise. Lev is measured as total liability divided by total equity at the end of year t.
Table 3. Relationship between earnings and returns dependent on the level of Divergence between board seat control rights and cash flow rights
Board seat control right/Cash flow
rights (DEV) # of firm-year observations
Correlation between earnings and returns All 4594 0.18242 0.00-0.96 231 0.24369 0.97-1.85 917 0.19894 1.86-3.04 1144 0.15737 3.05-5.78 1152 0.15724 5.79-20.08 920 0.12822 >20.09 230 0.12613 Notes:
1. All correlations (Pearson) between annual accounting earnings per share (EPS) and stock returns, and the earnings coefficients from the regression of stock returns on accounting earnings per share, are significant at the 0.001 level or better.
2. The six divergence groups are categorized according to the percentile of 5%, 25%, 50%, 75% and 95% of DEV distribution.
K.A. Hendartoa, B.M. Purwantob / Asia Pacific Management Review 18(1) (2013)xx-xx
253
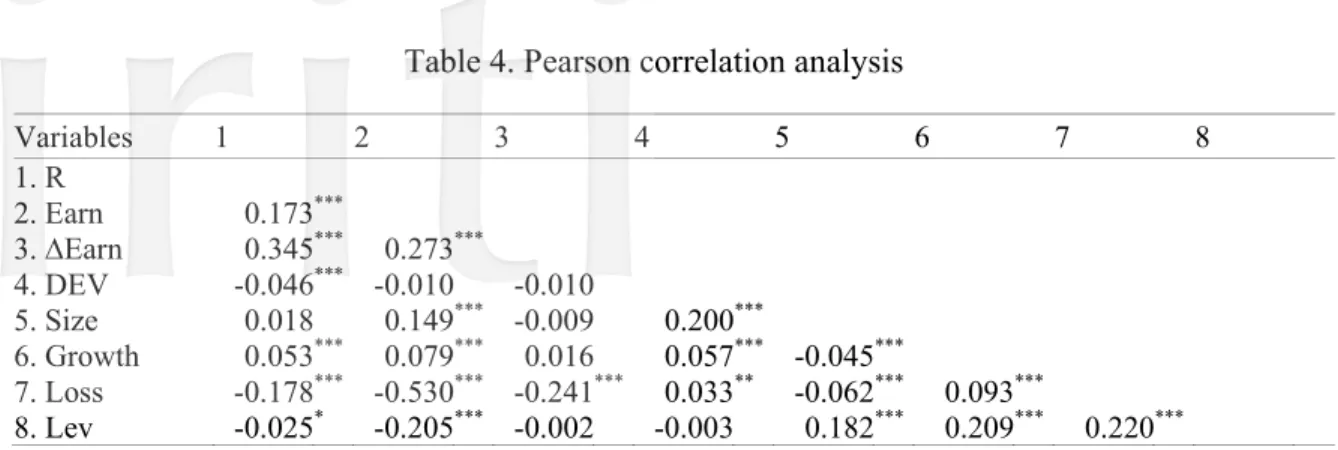
Table 4. Pearson correlation analysis
Variables 1 2 3 4 5 6 7 8 1. R 2. Earn 0.173*** 3. ∆Earn 0.345*** 0.273*** 4. DEV -0.046*** -0.010 -0.010 5. Size 0.018 0.149*** -0.009 0.200*** 6. Growth 0.053*** 0.079*** 0.016 0.057*** -0.045*** 7. Loss -0.178*** -0.530*** -0.241*** 0.033** -0.062*** 0.093*** 8. Lev -0.025* -0.205*** -0.002 -0.003 0.182*** 0.209*** 0.220*** Notes:
1. Variables definition: R is measured by cumulative 12-month raw stock return until four months after the end of fiscal year t. Earn is earning per share (before extraordinary items) for fiscal year t. ∆Earn is the change in Earn. DEV is the calculated multiple of board seat control rights over cash flow rights. Size is the size of firm which is measured as natural log of total assets at the end of year t-1. Growth is M/B ratio computed as the market value of equity/book value of equity. Loss is loss incidence which equals 1 if firm’s earnings before extraordinary items are less than 0, and 0 otherwise. Lev is measured as total liability divided by total equity at the end of year t.
2. ***, **, and * indicate significance at the 1%, 5%, and 10% levels for the two-tailed tests, respectively. Table 5. The Effect of Divergence between Board Seat Control Rights and Cash Flows Right on the Earnings Informativeness (n=4594)
Variables Pred. Sign Model (1) Model (2)
Earn ( + 0.06892.68)*** -0.0024 (-0.08 ) EarnDEV - -0.0214** -0.0171 * (-2.00) (-1.43 ) ΔEarn + 0.4460 *** (17.34 ) ΔEarnDEV - -0.0280 ** (-1.73 ) EarnSize ? -0.0180 -0.0065 (-1.15) (-0.39 ) ΔEarnSize ? -0.0872 (-5.66 )*** EarnGrowth ? -0.0088 0.0912 *** (-0.41) ( 3.29 ) ΔEarnGrowth ? -0.1462 *** (-5.67 ) EarnLoss + 0.0843*** 0.0649 *** ( 4.13) ( 2.50 ) ΔEarnLoss + -0.1080 *** (-4.81 ) EarnLev ? 0.0701*** 0.0611 * ( 3.21) ( 1.86 ) ΔEarnLev ? 0.0128 ( 0.48 )
COEF. Test (F-test)
EarnDEV+ΔEarnDEV F-value=6.08**
Highest VIF 3.14093 4.01885
K.A. Hendartoa, B.M. Purwantob / Asia Pacific Management Review 18(1) (2013)xx-xx
254
Model F 13.54 (p<.001) 43.17 (p<.001)
Notes:1. The Huber-White heteroscedasticity-consistent robust standard errors (Rogers, 1993, generalizing White 1980) adjustment procedure is used to estimate the reported t-statistics (in parentheses).
2. Model specification: Model (1) 4 , 0 1 , 2 , , , , , 1 k i t i t i t i t k i t i t i t k
R Earn Earn DEV Earn X
Model (2) 4 4 , 0 1 , 2 , , 3 , 4 , , , , , , , 1 1 k k i t i t i t i t i t i t i t k i t i t k i t i t i t k k
R Earn Earn DEV Earn Earn DEV Earn X Earn X
3. Variables definition: t i R,
= firm i’s cumulative 12-month raw stock return until four months after the end of fiscal year t
t i
Earn,= firm i’s earning per share (before extraordinary items) for fiscal year t t
i
DEV,
= The ratio of board seat control rights over cash flows rights of the largest ultimate owner of firm i
, k i t
X
= vector of control variables, k=1,2 , 3, and 4
1 , i t
X
: Sizei,t = size of the firm, natural log of firm i’s total assets at the end of year t-1
2 , i t
X
: Growthi,t= M/B ratio computed as the market value of equity/book value of equity
3 , i t
X
: Lossi,t = 1 if firm i’s earnings before extraordinary items are less than 0, and 0 otherwise
4 , i t
X
: Levi,t = firm i’s total liability divided by total equity at the end of year t
4. ***, ** and * respectively indicate significance levels at the 1%, 5%, and 10% (one-tailed for the coefficients with predicted sign, and two-tailed otherwise).
Asia Pacific Management Review 18(1) (2013) xx-xx
Asia Pacific Management Review 18(1) (2013) xx-xx
233
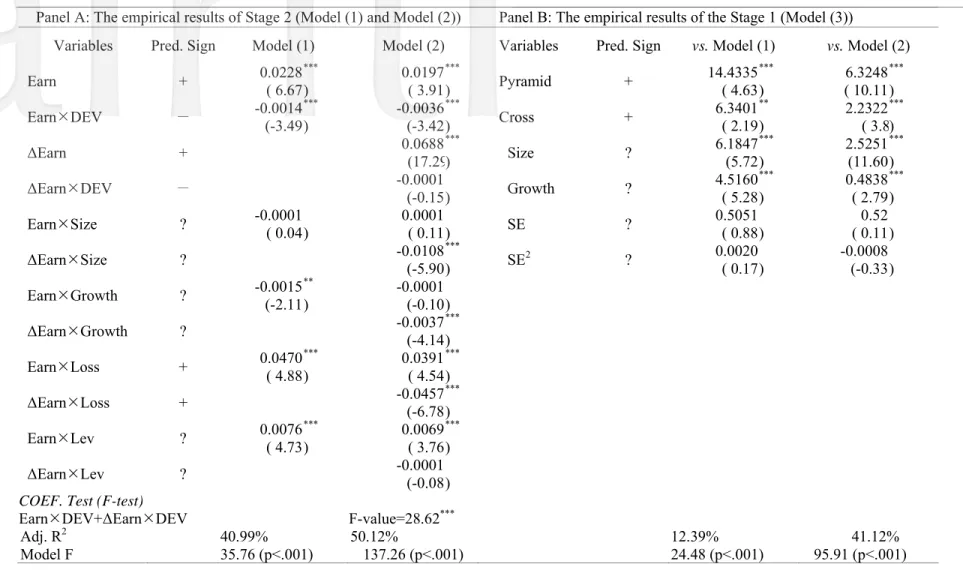
Table 6. Additional Test: Endogeneity Concern when Controlling Shareholders’ Control exceeds Ownership (2SLS)
Panel A: The empirical results of Stage 2 (Model (1) and Model (2)) Panel B: The empirical results of the Stage 1 (Model (3))
Variables Pred. Sign Model (1) Model (2) Variables Pred. Sign vs. Model (1) vs. Model (2)
Earn + 0.0228( 6.67)*** 0.0197( 3.91)*** Pyramid + 14.4335( 4.63)*** 6.3248( 10.11)*** EarnDEV - -0.0014(-3.49)*** -0.0036(-3.42)*** Cross + 6.3401( 2.19)** 2.2322( 3.8)*** ΔEarn + 0.0688(17.29)*** Size ? 6.1847(5.72)*** 2.5251(11.60)*** ΔEarnDEV - -0.0001 (-0.15) Growth ? 4.5160( 5.28)*** 0.4838( 2.79)*** EarnSize ? -0.0001 0.0001 ( 0.04) ( 0.11) SE ? 0.5051 0.52 ( 0.88) ( 0.11) ΔEarnSize ? -0.0108*** SE2 ? 0.0020 -0.0008 (-5.90) ( 0.17) (-0.33) EarnGrowth ? -0.0015(-2.11)** -0.0001 (-0.10) ΔEarnGrowth ? -0.0037(-4.14)*** EarnLoss + 0.0470( 4.88) *** 0.0391( 4.54)*** ΔEarnLoss + -0.0457(-6.78)*** EarnLev ? 0.0076( 4.73)*** 0.0069( 3.76)*** ΔEarnLev ? -0.0001(-0.08)
COEF. Test (F-test)
EarnDEV+ΔEarnDEV F-value=28.62***
Adj. R2 40.99% 50.12% 12.39% 41.12%
K.A. Hendartoa, B.M. Purwantob / Asia Pacific Management Review 18(1) (2013)xx-xx
234
Notes: 1. The variables of Model (1) and Model (2) are the same as for Table 5. The variables definition in Model (6) is as follows: Pyramid is equal to 1 if firm has stock pyramids, and 0 otherwise. Cross is equal to 1 is firm has cross-holding, and 0 otherwise. SE is measured as the standard deviation of monthly stock return of lagged five-years. SE2 is measured as squared term of SE.
2. ***, ** and * respectively indicate significance levels at the 1%, 5%, and 10% (one-tailed for the coefficients with predicted sign, and two-tailed otherwise). Table 7. Additional Test: Tests for Sub-sample Depends on the Ultimate Control Type
Variables Pred. Sign Model Group 1: Family (1) Model (2) Model Group 2: Mutual (1) Model (2) Model Group 3: Manager (1) Model (2) Model Group 4: Government (1) Model (2)
Earn + 0.1248 ( 2.97) *** 0.01354 0.1215( 0.30) ( 1.51) * 0.08327 ( 0.94) -0.0195 (-0.35 ) -0.05045 (-0.80 ) -0.1158 (-0.24) -0.2829 (-0.47 ) EarnDEV - -0.0563 *** -0.03708** 0.7629 0.04585 -0.0440 ** -0.04598** 0.0533 0.06204 (-3.41) (-2.05) ( 0.37) ( 0.88) (-1.97 ) (-1.82 ) ( 0.21) ( 0.22) ΔEarn + 0.52896(12.57) *** 0.46149( 4.94) *** 0.47536( 9.70) *** 0.57739 ( 1.09) ΔEarnDEV - -0.05229(-2.55) *** -0.04872 (-0.74) -0.05436(-1.49 ) * -0.30139 (-1.02 ) EarnSize ? -0.0272 -0.00627(-1.31) (-0.33) 0.3189( 1.08) 0.00639( 0.12) 0.0073 ( 0.22 ) 0.00691( 0.18) 0.2715 0.2453( 0.99) ( 0.67) ΔEarnSize ? -0.06508(-3.74) *** 0.03447 ( 0.68) -0.15333(-4.46 ) *** -0.21658 (-0.50 ) EarnGrowth ? -0.0312 (-0.94) 0.08298( 2.55) *** 0.8685 -0.05663 ( 0.16) (-0.51) 0.0833 ( 1.58 ) * 0.15941( 2.50) *** 0.0839 ( 0.50) 0.36238( 1.82) ** ΔEarnGrowth ? -0.12353(-4.24) *** -0.11963(-1.35) * -0.26447(-5.07 ) *** -0.08448 (-0.30 ) EarnLoss + 0.0887 ( 3.53) *** 0.05633( 1.85) ** 0.1928( 1.33) * 0.0764 0.0629 ( 0.89) ( 1.40 ) * 0.02421 -0.1487 ( 0.35) (-0.69) 0.34544 ( 0.81) ΔEarnLoss + -0.1017(-3.79) *** -0.24973(-3.32) *** -0.04679(-0.82 ) -0.63101(-1.28 ) EarnLev ? 0.0741 ( 2.56) ** 0.06151 0.8706 ( 1.36) (-0.15) 0.14265 0.0169 ( 1.48) ( 0.35 ) 0.03315 0.3581 ( 0.58) ( 1.81) * -0.45681 (-0.67 ) ΔEarnLev ? -0.02207 (-0.61) -0.00158 (-0.02) 0.05461 ( 0.86) 0.94152 ( 1.23)
COEF. Test (F-test)
K.A. Hendartoa, B.M. Purwantob / Asia Pacific Management Review 18(1) (2013)xx-xx 235 # of obs. 3194 3194 468 468 879 879 89 89 Highest VIF 4.99863 5.95657 2.61473 3.96761 2.73026 4.44325 6.95587 7.25475 Adj. R2 4.37% 16.33% 1.80% 12.91% 0.83% 13.94% 4.04% 4.22% Model F 12.21 (p<.001) 32.90 (p<.001) 1.66 (p=0.067) 4.51 (p<.001) 2.23 (p=0.039) 8.99 (p<.001) 1.34 (p=0.221) 1.22 (p=0.2712) Notes:
1. The variables are the same as for Table 5.
2. ***, ** and * respectively indicate significance levels at the 1%, 5%, and 10% (one-tailed for the coefficients with predicted sign, and two-tailed otherwise).
Asia Pacific Management Review 18(1) (2013) xx-xx
233
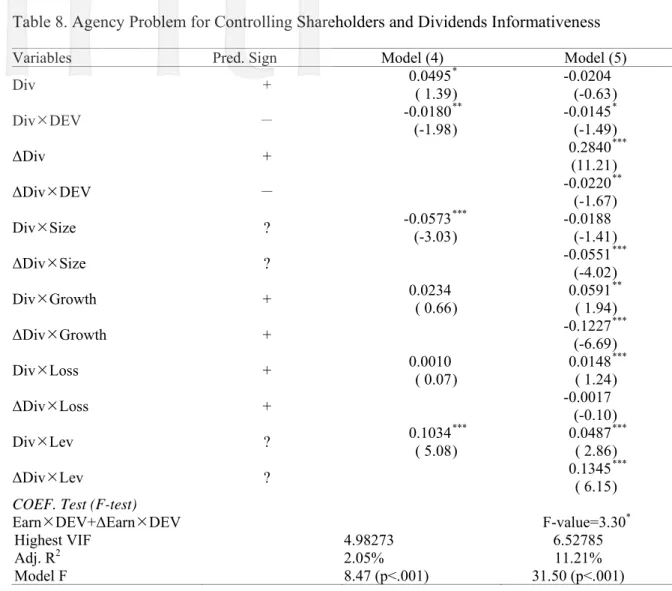
Table 8. Agency Problem for Controlling Shareholders and Dividends Informativeness
Variables Pred. Sign Model (4) Model (5)
Div ( + 0.04951.39)* -0.0204(-0.63) DivDEV - -0.0180** -0.0145* (-1.98) (-1.49) ΔDiv + 0.2840(11.21)*** ΔDivDEV - -0.0220** (-1.67) DivSize (-3.03)? -0.0573*** -0.0188(-1.41) ΔDivSize ? -0.0551(-4.02)*** DivGrowth + 0.0234 ( 0.66) ( 0.05911.94)** ΔDivGrowth (-6.69)+ -0.1227*** DivLoss ( + 0.0010 0.07) 0.0148( 1.24)*** ΔDivLoss + -0.0017(-0.10) DivLev ( ? 0.10345.08) *** 0.0487( 2.86) *** ΔDivLev ? 0.1345( 6.15) ***
COEF. Test (F-test)
EarnDEV+ΔEarnDEV F-value=3.30*
Highest VIF 4.98273 6.52785
Adj. R2 2.05% 11.21%
Model F 8.47 (p<.001) 31.50 (p<.001)
Notes:
1. The Huber-White heteroscedasticity-consistent robust standard errors (Rogers, 1993, generalizing White 1980) adjustment procedure is used to estimate the reported t-statistics (in parentheses).
2. Model specification: Model (1) 4 , 0 1 , 2 , , , , , 1 k i t i t i t i t k i t i t i t k
R Div Div DEV Div X
Model(2) 4 4 , 0 1 , 2 , , 3 , 4 , , , , , , , 1 1 k k i t i t i t i t i t i t i t k i t i t k i t i t i t k k
R Div Div DEV Div Div DEV Div X Div X
3. Variables definition:
t i
R, = firm i’s cumulative 12-month raw stock return until four months after the end of fiscal year t
t i
Div, = firm i’s common stock dividends in year t, scale by market value of equity at the end of year t-1 t
i
DEV,
= The ratio of board seat control rights over cash flows rights of the largest ultimate owner of firm i
, k i t
X
K.A. Hendartoa, B.M. Purwantob / Asia Pacific Management Review 18(1) (2013)xx-xx 234 1 , i t X
: Sizei,t = size of the firm, natural log of firm i’s total assets at the end of year t-1
2 , i t
X
: Growthi,t= M/B ratio computed as the market value of equity/book value of equity
3 , i t
X
: Lossi,t = 1 if firm i’s earnings before extraordinary items are less than 0, and 0 otherwise
4 , i t
X
: Levi,t = firm i’s total liability divided by total equity at the end of year t
4. ***, ** and * respectively indicate significance levels at the 1%, 5%, and 10% (one-tailed for the coefficients with predicted sign, and two-tailed otherwise).
Asia Pacific Management Review 18(1) (2013) xx-xx
233
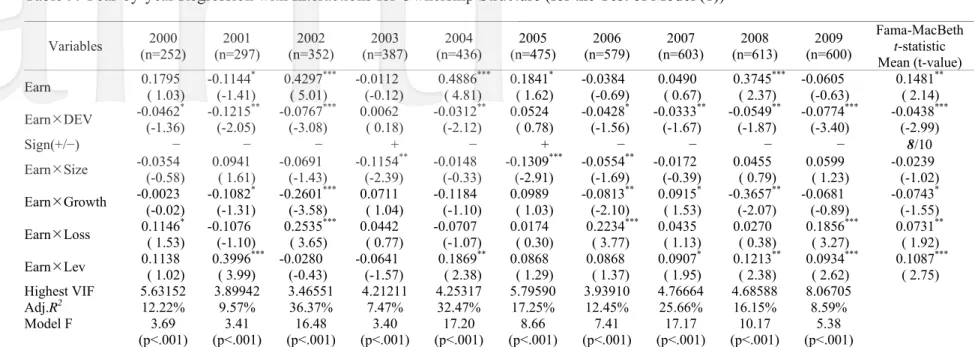
Table 9. Year-by-year Regression with Interactions for Ownership Structure (for the Test of Model (1))
Variables (n=252) 2000 (n=297) 2001 (n=352) 2002 (n=387) 2003 (n=436) 2004 (n=475) 2005 (n=579) 2006 (n=603) 2007 (n=613) 2008 (n=600) 2009 Fama-MacBeth t-statistic
Mean (t-value) Earn 0.1795( 1.03) -0.1144 (-1.41) * 0.4297 ( 5.01) *** -0.0112 (-0.12) 0.4886 ( 4.81) *** 0.1841 ( 1.62) (-0.69) ( * -0.0384 0.0490 0.67) ( 0.3745 2.37) (-0.63) *** -0.0605 0.1481( 2.14) ** EarnDEV -0.0462(-1.36) * -0.1215 (-2.05) ** -0.0767 (-3.08) *** 0.0062 ( 0.18) -0.0312 (-2.12) ** 0.0524 ( 0.78) (-1.56) (-1.67) (-1.87) (-3.40) -0.0428 * -0.0333 ** -0.0549 ** -0.0774 *** -0.0438(-2.99) *** Sign(+/−) − − − + − + − − − − 8/10 EarnSize -0.0354(-0.58) ( 0.0941 1.61) (-1.43) (-2.39) (-0.33) (-2.91) (-1.69) (-0.39) ( -0.0691 -0.1154 ** -0.0148 -0.1309 *** -0.0554 ** -0.0172 0.0455 0.79) ( 0.0599 1.23) -0.0239 (-1.02) EarnGrowth -0.0023(-0.02) -0.1082 (-1.31) * -0.2601 (-3.58) *** 0.0711 ( 1.04) -0.1184 (-1.10) 0.0989 ( 1.03) (-2.10) ( -0.0813 ** 0.0915 1.53) (-2.07) (-0.89) (-1.55) * -0.3657 ** -0.0681 -0.0743* EarnLoss 0.1146( 1.53) * -0.1076 (-1.10) 0.2535 ( 3.65) *** 0.0442 ( 0.77) -0.0707 (-1.07) 0.0174 ( 0.30) 0.2234 ( 3.77) *** 0.0435 ( 1.13) 0.0270 ( 0.38) 0.1856 ( 3.27) *** 0.0731( 1.92) ** EarnLev 0.1138( 1.02) 0.3996 ( 3.99) *** -0.0280 (-0.43) -0.0641 (-1.57) 0.1869 ( 2.38) ** 0.0868 ( 1.29) 0.0868 ( 1.37) 0.0907 ( 1.95) * 0.1213 ( 2.38) ** 0.0934 ( 2.62) *** 0.1087( 2.75) *** Highest VIF 5.63152 3.89942 3.46551 4.21211 4.25317 5.79590 3.93910 4.76664 4.68588 8.06705 Adj.R2 12.22% 9.57% 36.37% 7.47% 32.47% 17.25% 12.45% 25.66% 16.15% 8.59% Model F 3.69 (p<.001) 3.41 (p<.001) 16.48 (p<.001) 3.40 (p<.001) 17.20 (p<.001) 8.66 (p<.001) 7.41 (p<.001) 17.17 (p<.001) 10.17 (p<.001) 5.38 (p<.001) Notes:
1. The Huber-White heteroscedasticity-consistent robust standard errors (Rogers, 1993, generalizing White 1980) adjustment procedure is used to estimate the reported t-statistics (in parentheses).
2. Model specification: Model (1) 4 , 0 1 , 2 , , , , , 1 k i t i t i t i t k i t i t i t k
R Earn Earn DEV Earn X
3. Variables definition:
t i
R, = firm i’s cumulative 12-month raw stock return until four months after the end of fiscal year t
t i
Earn,= firm i’s earning per share (before extraordinary items) for fiscal year t
t i
DEV, = The ratio of board seat control rights over cash flows rights of the largest ultimate owner of firm i
, k i t X
K.A. Hendartoa, B.M. Purwantob / Asia Pacific Management Review 18(1) (2013)xx-xx 234 1 , i t X
: Sizei,t = size of the firm, natural log of firm i’s total assets at the end of year t-1
2 ,
i t X
: Growthi,t= M/B ratio computed as the market value of equity/book value of equity
3 , i t X
: Lossi,t = 1 if firm i’s earnings before extraordinary items are less than 0, and 0 otherwise
4 , i t X
: Levi,t = firm i’s total liability divided by total equity at the end of year t
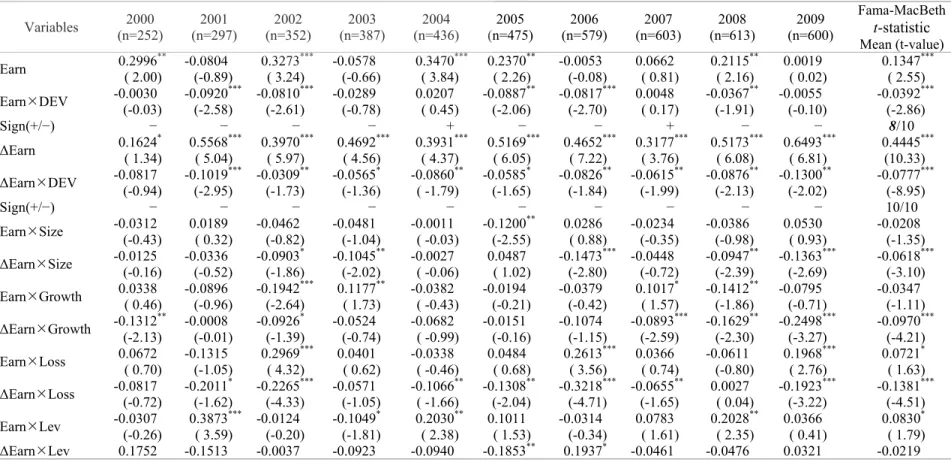
4. ***, ** and * respectively indicate significance levels at the 1%, 5%, and 10% (one-tailed for the coefficients with predicted sign, and two-tailed otherwise). Table 10. Year-by-year Regression with Interactions for Ownership Structure (for the Test of Model (2))
Variables (n=252) 2000 (n=297) 2001 (n=352) 2002 (n=387) 2003 (n=436) 2004 (n=475) 2005 (n=579) 2006 (n=603) 2007 (n=613) 2008 (n=600) 2009 Fama-MacBeth t-statistic Mean (t-value) Earn 0.2996( 2.00) ** -0.0804 (-0.89) 0.3273 ( 3.24) *** -0.0578 (-0.66) 0.3470 ( 3.84) *** 0.2370 ( 2.26) ** -0.0053 (-0.08) 0.0662 ( 0.81) 0.2115 ( 2.16) ** 0.0019 ( 0.02) 0.1347( 2.55) *** EarnDEV -0.0030(-0.03) (-2.58) (-2.61) (-0.78) ( -0.0920 *** -0.0810 *** -0.0289 0.0207 0.45) (-2.06) (-2.70) ( -0.0887 ** -0.0817 *** 0.0048 0.17) (-1.91) (-0.10) -0.0367 ** -0.0055 -0.0392(-2.86) *** Sign(+/−) − − − − + − − + − − 8/10 ΔEarn 0.1624* 0.5568 *** 0.3970 *** 0.4692 *** 0.3931 *** 0.5169 *** 0.4652 *** 0.3177 *** 0.5173 *** 0.6493 *** 0.4445*** ( 1.34) ( 5.04) ( 5.97) ( 4.56) ( 4.37) ( 6.05) ( 7.22) ( 3.76) ( 6.08) ( 6.81) (10.33) ΔEarnDEV -0.0817(-0.94) (-2.95) (-1.73) (-1.36) ( -0.1019 *** -0.0309 ** -0.0565 * -0.0860 -1.79) (-1.65) (-1.84) (-1.99) (-2.13) (-2.02) ** -0.0585 * -0.0826 ** -0.0615 ** -0.0876 ** -0.1300 ** -0.0777(-8.95) *** Sign(+/−) − − − − − − − − − − 10/10 EarnSize -0.0312(-0.43) ( 0.0189 0.32) (-0.82) (-1.04) ( -0.0462 -0.0481 -0.0011 -0.03) (-2.55) ( -0.1200 ** 0.0286 0.88) (-0.35) (-0.98) ( -0.0234 -0.0386 0.0530 0.93) -0.0208(-1.35) ΔEarnSize -0.0125(-0.16) (-0.52) (-1.86) (-2.02) ( -0.0336 -0.0903 * -0.1045 ** -0.0027 -0.06) ( 0.0487 1.02) (-2.80) (-0.72) (-2.39) (-2.69) -0.1473 *** -0.0448 -0.0947 ** -0.1363 *** -0.0618(-3.10) *** EarnGrowth 0.0338 -0.0896 -0.1942 *** 0.1177 ** -0.0382 -0.0194 -0.0379 0.1017 * -0.1412 ** -0.0795 -0.0347 ( 0.46) (-0.96) (-2.64) ( 1.73) ( -0.43) (-0.21) (-0.42) ( 1.57) (-1.86) (-0.71) (-1.11) ΔEarnGrowth -0.1312(-2.13) (-0.01) (-1.39)** -0.0008 -0.0926 * -0.0524 (-0.74) -0.0682 ( -0.99) -0.0151 (-0.16) -0.1074 (-1.15) (-2.59)-0.0893 *** -0.1629 (-2.30)** -0.2498 (-3.27)*** -0.0970(-4.21)*** EarnLoss 0.0672 -0.1315 0.2969 *** 0.0401 -0.0338 0.0484 0.2613 *** 0.0366 -0.0611 0.1968 *** 0.0721* ( 0.70) (-1.05) ( 4.32) ( 0.62) ( -0.46) ( 0.68) ( 3.56) ( 0.74) (-0.80) ( 2.76) ( 1.63) ΔEarnLoss -0.0817(-0.72) (-1.62) (-4.33) (-1.05) ( -0.2011 * -0.2265 *** -0.0571 -0.1066 -1.66) (-2.04) (-4.71) (-1.65) ( ** -0.1308 ** -0.3218 *** -0.0655 ** 0.0027 0.04) (-3.22) -0.1923 *** -0.1381(-4.51) *** EarnLev -0.0307 0.3873 *** -0.0124 -0.1049 * 0.2030 ** 0.1011 -0.0314 0.0783 0.2028 ** 0.0366 0.0830* (-0.26) ( 3.59) (-0.20) (-1.81) ( 2.38) ( 1.53) (-0.34) ( 1.61) ( 2.35) ( 0.41) ( 1.79) ΔEarnLev 0.1752 -0.1513 -0.0037 -0.0923 -0.0940 -0.1853 ** 0.1937 * -0.0461 -0.0476 0.0321 -0.0219
K.A. Hendartoa, B.M. Purwantob / Asia Pacific Management Review 18(1) (2013)xx-xx 235 ( 1.49) (-1.63) (-0.09) (-1.12) ( -1.17) (-2.30) ( 1.83) (-0.89) (-0.64) ( 0.55) (-0.55) F-test:(F-value) EarnDEV+ ΔEarnDEV 0.67 3.06* 4.86** 1.43 2.14 3.83** 4.59** 3.19* 3.31* 5.12** Highest VIF 8.89508 4.49369 4.79312 5.12966 5.21192 7.52931 8.64468 4.15235 6.83133 9.23708 Adj.R2 17.55% 16.39% 43.49% 15.49% 37.21% 25.86% 25.82% 31.41% 24.83% 16.62% Model F 3.76 (p<.001) (p<.001) 3.98 (p<.001) 15.06 (p<.001) 4.48 (p<.001) 14.60 (p<.001) 9.50 (p<.001) 11.22 (p<.001) 15.44 (p<.001) 11.69 (p<.001) 6.90 Notes:
1.ΔEarni,t is the change in Earni,t between year t-1 and t. The remaining variables in Table 8 are the same as Table 7.
Asia Pacific Management Review 18(1) (2013) xx-xx
233
Table 11. Additional Test: Use of Alternative Measure of Cumulative Abnormal Returns (CARs)
Variables Pred. Sign Model (1) Model (2)
Earn ( + 0.08393.22 )*** 0.0314( 1.01 ) EarnDEV - -0.0267** -0.0401*** (-1.76 ) (-2.71 ) ΔEarn + ( 9.37 )0.2374*** ΔEarnDEV - -0.0419(-3.13 )*** EarnSize (-3.20 ? -0.0534***) -0.0204(-1.14 ) ΔEarnSize ? -0.0855(-4.76 )*** EarnGrowth ? -0.0871(-4.08 ) *** -0.0881(-3.02 )*** ΔEarnGrowth ? -0.0149(-0.59 ***) EarnLoss ( + 0.06893.40 )*** 0.0712( 2.86 )*** ΔEarnLoss + -0.0757(-3.48 ***) EarnLev ? ( 4.73 ) 0.0982*** ( 4.02 ) 0.1189*** ΔEarnLev ? -0.0322 (-1.35)
COEF. Test (F-test)
EarnDEV+ΔEarnDEV F-value=21.41***
Highest VIF 3.14924 4.62024
Adj. R2 4.60% 7.71%
Model F 18.07 (p<.001) 21.23 (p<.001)
Notes:
1. The Huber-White heteroscedasticity-consistent robust standard errors (Rogers, 1993, generalizing White 1980) adjustment procedure is used to estimate the reported t-statistics (in parentheses).
2. Model specification: Model (1) 4 , 0 1 , 2 , , , , , 1 k i t i t i t i t k i t i t i t k
CAR Earn Earn DEV Earn X
Model (2) 4 4 , 0 1 , 2 , , 3 , 4 , , 1 , , 1 , , , k k i t i t i t i t i t i t i t k i t i t k i t i t i t k k
CAR Earn Earn DEV Earn Earn DEV Earn X Earn X
3. Variables definition: t i CAR,
=firm i’s cumulative 12-month abnormal stock return until four months after the end of fiscal year t
t i
Earn,
= firm i’s earning per share (before extraordinary items) for fiscal year t
t i
DEV,
= The ratio of board seat control rights over cash flows rights of the largest ultimate owner of firm i
, k i t
X
K.A. Hendartoa, B.M. Purwantob / Asia Pacific Management Review 18(1) (2013)xx-xx 234 1 , i t X
: Sizei,t = size of the firm, natural log of firm i’s total assets at the end of year t-1
2 , i t
X
: Growthi,t= M/B ratio computed as the market value of equity/book value of equity
3 , i t
X
: Lossi,t = 1 if firm i’s earnings before extraordinary items are less than 0, and 0 otherwise
4 , i t
X
: Levi,t = firm i’s total liability divided by total equity at the end of year t
4. ***, ** and * respectively indicate significance levels at 1%, 5%, and 10% (one-tailed for the coefficients with predicted sign, and two-tailed otherwise)
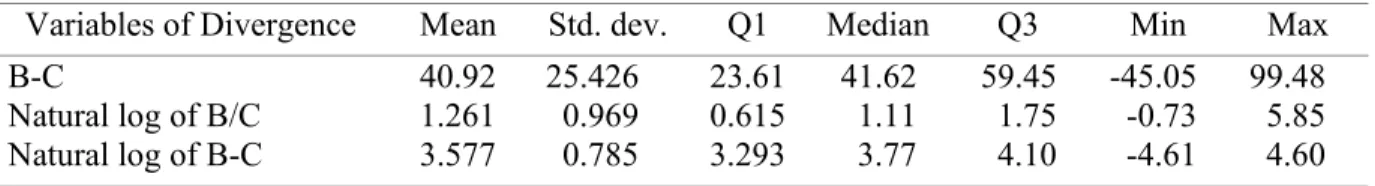
Table 12. The Alternative Measures of Board-Cash Divergence Panel A: Descriptive Statistics
Variables of Divergence Mean Std. dev. Q1 Median Q3 Min Max
B-C 40.92 25.426 23.61 41.62 59.45 -45.05 99.48
Natural log of B/C 1.261 0.969 0.615 1.11 1.75 -0.73 5.85
Natural log of B-C 3.577 0.785 3.293 3.77 4.10 -4.61 4.60
Panel B: The Empirical Results
Variables Pred. Sign
Alternative Measures of Divergence
Natural log of B/C B-C Natural log of B-C Model (1) Model (2) Model (1) Model (2) Model (1) Model (2) Earn + 0.0968( 3.34)*** -0.0290(-0.94) 0.0769( 2.56) *** -0.0233(-0.72) 0.1493 ( 2.30 ) *** -0.0030(-0.05) EarnDivergence - -0.0433** -0.0436** -0.0416** -0.0435** -0.0811 * -0.0540 (-1.93) (-1.97) (-1.68) (-1.79) (-1.29 ) (-0.88) ΔEarn + 0.4141(14.41)*** 0.4283(14.88) *** 0.4560(11.69) *** ΔEarnDivergence - -0.0364(-1.51)* -0.0539(-2.27) ** -0.0780(-2.33) ** EarnSize ? -0.0015 (-0.09) 0.0278( 1.65) ** -0.0019(-0.11) 0.0288( 1.70) * 0.0005 0.0327( 0.03 ) ( 1.83) * ΔEarnSize ? -0.0853(-5.36)*** -0.0882(-5.65)*** -0.0966(-5.94)*** EarnGrowth + 0.0127 ( 0.59) 0.0877( 3.50)*** 0.0089 0.0811( 0.41) ( 3.23)*** -0.0029 (-0.13 ) 0.0749( 2.87) *** ΔEarnGrowth (-5.78)+ -0.1198*** -0.1192(-5.75)*** -0.1255(-5.86) *** EarnLoss + 0.0772( 3.77)*** 0.0787( 3.34)*** 0.0763( 3.72) *** 0.0765( 3.24)*** 0.0869 ( 4.09 ) *** 0.0831( 3.34) *** ΔEarnLoss + -0.0840(-3.93)*** -0.0838(-3.95)*** -0.0839(-3.79) *** EarnLev ? 0.0372 ( 1.74) * 0.0130( 0.52) * 0.0402( 1.89) * 0.0159( 0.64) * 0.0327 ( 1.48 ) 0.0051( 0.20) ΔEarnLev ? 0.0217 ( 0.95) 0.0235 ( 1.04) 0.0273 ( 1.15)
COEF. Test (F-test) F-value=
6.09** F-value= 9.72*** F-value= 6.19** EarnDivergence + ΔEarnDivergence Highest VIF 4.02242 4.99054 4.48862 5.42007 2.21020 7.46181 Adj. R2 2.81% 10.72% 2.78% 10.77% 2.69% 10.41% Model F 11.36 30.43 11.26 30.58 10.34 10.41
K.A. Hendartoa, B.M. Purwantob / Asia Pacific Management Review 18(1) (2013)xx-xx
235
(p<.001) (p<.001) (p<.001) (p<.001) (p<.001) (p<.001) Notes:
1. The Huber-White heteroscedasticity-consistent robust standard errors (Rogers, 1993, generalizing White 1980) adjustment procedure is used to estimate the reported t-statistics (in parentheses).
2. Model specification: Model (1) 4 , 0 1 , 2 , , , , , 1 k i t i t i t i t k i t i t i t k
R Earn Earn DEV Earn X
Model (2) 4 4 , 0 1 , 2 , , 3 , 4 , , , , , , , 1 1 k k i t i t i t i t i t i t i t k i t i t k i t i t i t k k
R Earn Earn DEV Earn Earn DEV Earn X Earn X
3. Variables definition: t i R,
= firm i’s cumulative 12-month raw stock return until four months after the end of fiscal year t
t i
Earn,
= firm i’s earning per share (before extraordinary items) for fiscal year t
t i
DEV,
= The ratio of board seat control rights over cash flows rights of the largest ultimate owner of firm i
, k i t
X
= vector of control variables, k=1, 2 , 3, and 4
1 , i t
X
: Size i, t = size of the firm, natural log of firm i’s total assets at the end of year t-1
2 , i t
X
: Growth i,t= M/B ratio computed as the market value of equity/book value of equity
3 , i t
X
: Loss i,t = 1 if firm i’s earnings before extraordinary items are less than 0, and 0 otherwise
4 , i t
X
: Lev i,t = firm i’s total liability divided by total equity at the end of year t B = firm i’s board seat control rights for fiscal year t
C = firm i’s cash flows rights for fiscal year t
4. ***, ** and * respectively indicate significance levels at 1%, 5%, and 10% (one-tailed for the coefficients with predicted sign, and two-tailed otherwise).