Is cancer diagnosed at an earlier stage in physicians than in the general population? A retrospective cohort study
Yueh-Han Hsu MD MPH, Pei-Tseng Kung ScD, Yueh-Hsin Wang MHA, Yao-Mao Chang LLB PhD, Wen-Chen Tsai DrPH
Affiliations: Department of Public Health and Department of Health Services Administration (Hsu), China Medical University, Taichung, Taiwan; Department of Internal Medicine (Hsu), Ditmanson Medical Foundation Chia-Yi Christian Hospital, Chia-Yi, Taiwan; Department of Healthcare Administration (Kung), Asia University, Taichung, Taiwan; Center for Liberal Arts (Chang), Taipei Medical University, Taipei, Taiwan; Department of Health Services Administration (Wang, Tsai), China Medical University, Taichung, Taiwan.
Correspondence to: Wen-Chen Tsai : wtsai@mail.cmu.edu.tw
Acknowledgements
This study was supported by grants (CYCH R101-30, CMU101-ASIA-14) from Ditmanson Medical Foundation Chia-Yi Christian Hospital, China Medical University, and Asia University. We are grateful for use of the National Health Insurance Research Database and the Cancer Register Files provided by the Statistics
Center of the Ministry of Health and Welfare. Author contributions:
Conception and design: Yueh-Han Hsu, Pei-Tseng Kung, Wen-Chen Tsai; Administrative support: Yueh-Hsin Wang, Pei-Tseng Kung, Wen-Chen Tsai; Collection and assembly of data: Yueh-Hsin Wang, Wen-Chen Tsai; Data analysis and interpretation: Yueh-Han Hsu, Pei-Tseng Kung, Yao-Mao Chang, Wen-Chen Tsai; Manuscript writing: All authors; Final approval of manuscript: All authors.
Running head: Cancer stages in physicians and non-physicians Declaration: The authors have no conflicts of interest to declare. Word count: text, 2133; abstract, 230.
ABSTRACT Background
Physician health plays a key role in healthcare systems. A comparison of the stages of cancer between physicians and general population has not been reported.
Methods
This was a nationwide matched cohort study with 14 years of observation based on two Taiwanese databases. From 1999 to 2012, all patients with the most common six cancers (hepatoma, lung, colorectal, oral, female breast and cervical cancer) were collected. Those under 25 years of age, with a history of organ transplantation, cancer, and AIDS were excluded. Propensity score match with age, gender, urbanization of residence and income was conducted to select controls at a 5:1 ratio. Distribution of the incident cancer stages among physicians and controls was investigated by
chi-square test. The associations of differences in cancer stages were compared by
multinomial logistic regression model. Sensitivity analysis was conducted for subgroups of doctors and cancers.
Results
In total, 274,003 cancer patients were identified; 542 of whom were physicians. After propensity score matches, we got 536 physicians and 2680 controls. There were no significant differences in cancer stage distributions among physicians and controls. Multinomial logistic regression analyses and sensitivity tests reported similar cancer
stages in most scenarios except that physicians had 2.64 folds higher risk to have stage IV cancer than stages 0 to III cancer in female breast cancer and cervical cancer. Interpretation
Introduction
The health of physicians is vital for the healthcare system. Physicians who are unwell mentally or physically are prone to providing suboptimal patient care.[1] Several research had investigated the risks of cancer for doctors, though the findings were inconclusive. [1-4] However, few investigation has addressed if doctors, once they get cancers, will have earlier cancer stages.
Investigations have reported that physicians tend to neglect physical examinations and, once sick, procrastinate seeking medical treatments.[5-8] But doctors may use their own professional knowledge and familiar network to engage in healthy lifestyles or seek prompt health services in ways that reduce their own risk of illness.[9-11] The factors protecting people from advanced cancer stages included attending screening services, [12-14] and good access to doctors [15,16]. Delayed cancer diagnoses will lead to worse outcomes. To fill the evidence gap of cancer stages in doctors, we conducted this nationwide propensity score matched cohort study to compare the incident cancer stages of the 6 major cancers between physicians and non-physicians in Taiwan. Our hypothesis is doctors might not have earlier cancer stages.
Methods
Data sourceThe National Health Insurance in Taiwan is a mandatory program initiated in 1995 and provides comprehensive medical care services. By the end of 2014, over 99.6% of the people in Taiwan were enrolled,[17] and the contract rate was over 93%. [17] Legally defined physicians in Taiwan include Western physicians, Traditional Chinese Medicine practitioners, and dentists. For this study, we retrieved data from two different national databases: the National Health Insurance Research Database, a database maintained by the Taiwan National Health Research Institutes; and the Taiwan Cancer Registry File authorized by Taiwan Health Promotion Administration. [12,18]
The National Health Insurance Research Database includes registry data of beneficiaries, claims files, and the registry of health personnel. The health personnel include Western physicians, Traditional Chinese Medicine practitioners, dentists, pharmacists, nurses, medical laboratory technicians, and physical and occupational therapists. The claims data are periodically reviewed by the authority to ensure accuracy. The Taiwan Cancer Registry File contains accurate cancer information including principles of diagnosis confirmation and staging. The rules for cancer staging followed regulations by American Joint Committee on Cancer.[12,19-21] We
identified the incident cancer stage of each patient from stage 0 to stage IV. All data files were linked through an encrypted but unique identification number to protect personal privacy and to provide patient level information. We retrieved diagnostic information according to the International Classification of Diseases, Ninth Revision, Clinical Modification (ICD-9-CM) codes. This study was approved by the
Institutional Review Board of Ditmanson Medical Foundation Chia-Yi Christian Hospital and China Medical University Hospital (IRB number: CYCH-101042, CMUH 103-REC-003).
Research sample
The Long Form of Taiwan Cancer Registry File contains information of the six most common cancers in Taiwan.[20] Linking the data in National Health Insurance Research Database with the Long Form from January 1 1999 (the index date) to the end of 2012 (the latest available data), we collected all incident patients who had one of the six major cancers and selected the patients who were doctors (including Western physicians, Traditional Chinese Medicine practitioners and dentists) as the physician cohort, and those who did not have any healthcare backgrounds as the control cohort. The six major cancers were lung cancer (ICD-9-CM code 162), hepatoma (ICD-9-CM code 155), colorectal cancer (ICD-9-CM codes 153, 154), oral cancer (ICD-9-CM codes 140-149), female breast cancer (ICD-9-CM code 174), and
cervical cancer (ICD-9-CM codes 180-182). The exclusion criteria were: 1. age under 25 years old (the youngest possible age to be physicians in Taiwan); 2. previous history of organ transplantation (ICD-9-CM code V42), AIDS (ICD-9-CM codes 042, V08), and any cancer before the index date. For each individual in the physician cohort, we selected 5 individuals to form the control cohort under the propensity sore match with age, gender, urbanization of residence and income.
Covariates
The urbanization of residence in Taiwan was categorized into 7 levels, from level 1 to level 7 with level 1 as the highest degree of urbanization.[22] To simplify the
comparisons, level 1 was chosen as the reference, and the other six levels were divided into three groups (level 2+3, level 4+5, and level 6+7). The severity of comorbidity was presented as the Charlson comorbidity index modified by Deyo et al.,[23] and was sub-grouped as scores of 0, 1~3, 4~6, and ≧ 7. A higher score denoted a heavier comorbidity status. The catastrophic injuries/illnesses in Taiwan included 31 categories of major illnesses (for example: cancer, end-stage renal disease, hemophilia, and so on), with which patients are exempt from co-payment and may thus avoid financial hardship.[24] The status of having catastrophic illnesses (yes versus no) was included in the variables.
Statistical analysis
the physicians and the controls before and after matching. Then at different cancer stages, we used the chi-square test to compare the distribution of cancer stages among physicians and controls with respects to sub-classifications of the covariates including age, sex, incomes, urbanization of residence, status of catastrophic illnesses, and severity of comorbidity. Since the study outcome (stage 0 ~ stage IV) was an ordinal outcome, we tested whether the ordinal logistic regression model was suitable. The ordinal logistic regression model has an important assumption that under this model, the odds ratios estimating the effect of an exposure variable (i.e. physicians or non-physicians) for any of comparisons (stage 0 versus stage >=I, stage <II versus stage >=II, stage<III versus stage>=III, stage<IV versus stage IV) needs to be similar regardless of where the cut-off point was made.[25] Therefore, we conducted the necessary statistical test, a Score test, to assess whether the model constrained by the ordinal logistic regression model assumption was significantly different from the multinomial logistic regression model in which the odds ratio parameters were not constrained by the proportional odds assumption. The Score test results showed significant differences between these two models (p<0.05), implying that the proportional odds assumption was violated.
Thus, we performed the multinomial logistic regression model instead of the ordinal logistic regression model in our analyses. We also conducted sensitivity analyses for
the odds in physician subgroups (all physicians versus Western physicians only) and cancer subgroups (compare the odds in all 6 cancers, 4 cancers excluding the 2 female-only cancers, and the 2 female-only cancers). Then we conducted the Hosmer-Lemeshow test to check for goodness-of-fit of multinomial logistic regression model. We put gender, age, urbanization of residence, and premium-based income in these multinomial logistic regression models as control variables. The p-value of Hosmer and Lemeshow test for all of these 24 multinomial logistic regression models were not significant, which meant that these models were acceptable. All statistical analyses were performed using SAS 9.3 software (SAS Institute, Cary, NC, USA) for
Results
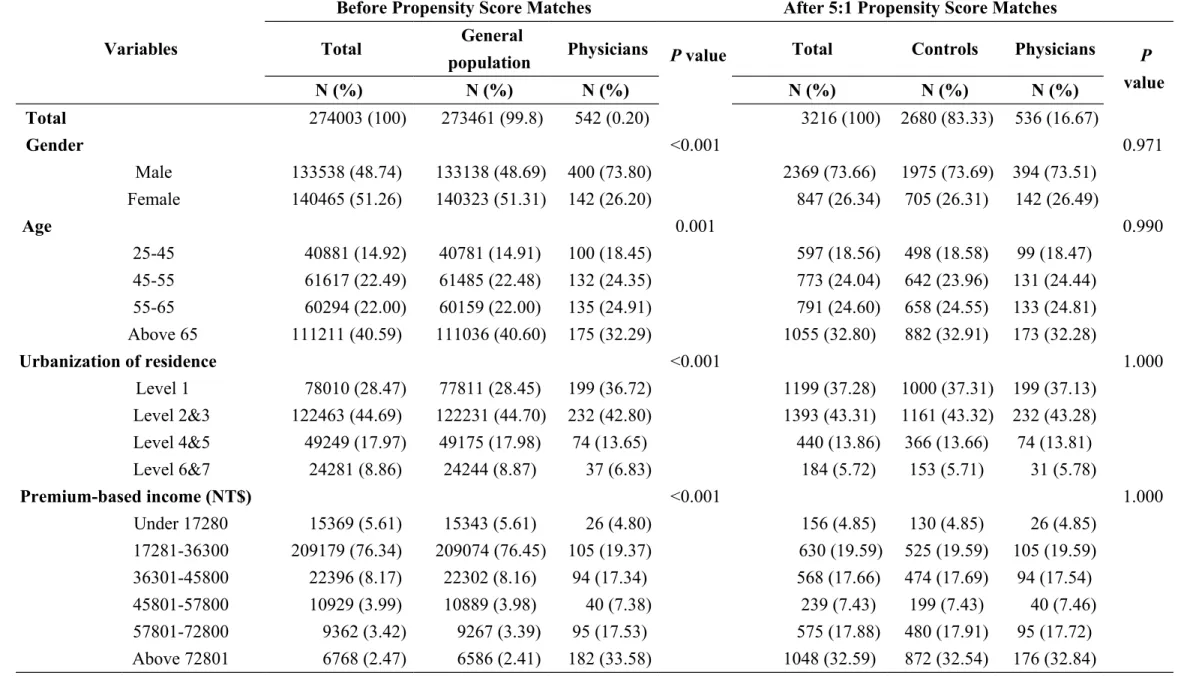
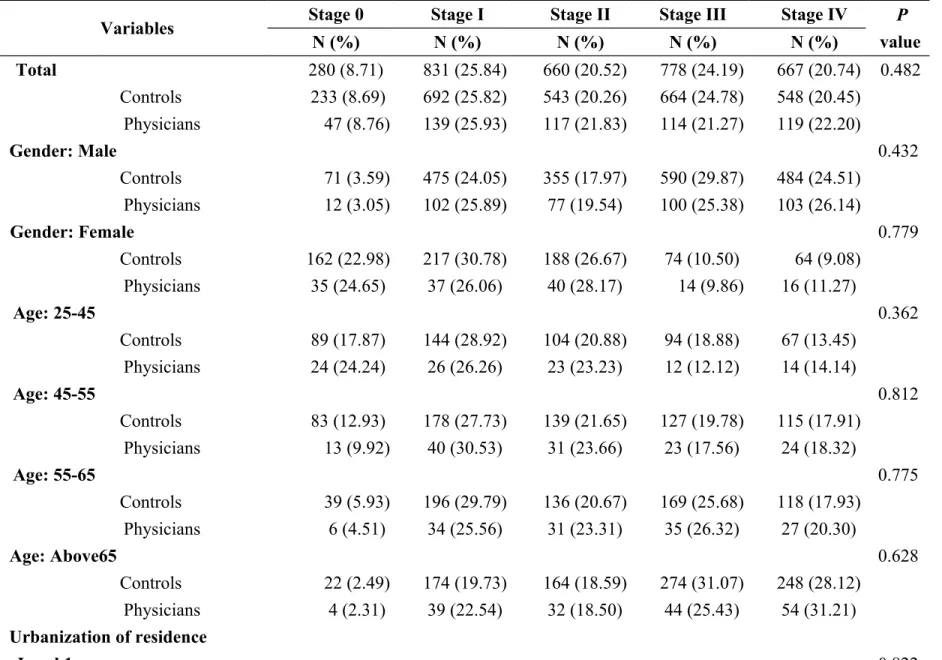
We collected 274,003 patients with the six major cancers, 542 of whom were physicians. After conducting the matches, we got 536 physicians and 2680 controls. The socio-demographic characteristics of physicians and general population under bivariate analysis before and after propensity score matches were shown in Table 1. The distributions of cancer stages among the physicians and the controls under bivariate analysis were similar in terms of the sub-classifications of the following control variables: gender, age, urbanization of residence, income, status of
catastrophic illnesses and comorbidity severity (Table 2).
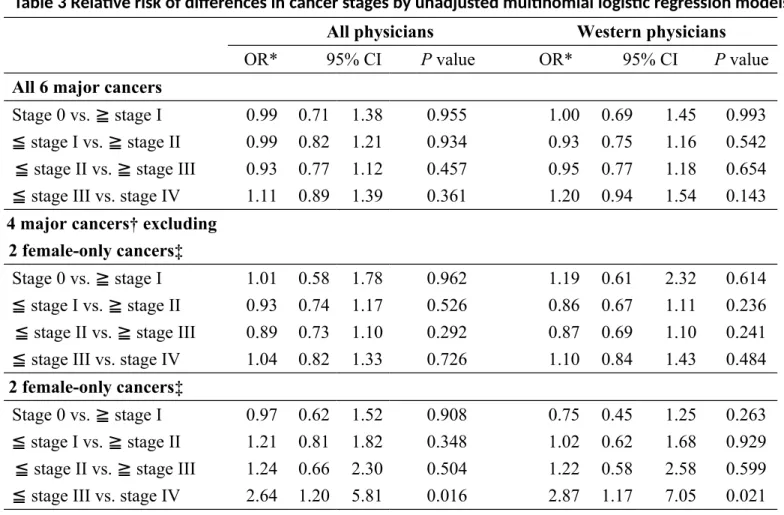
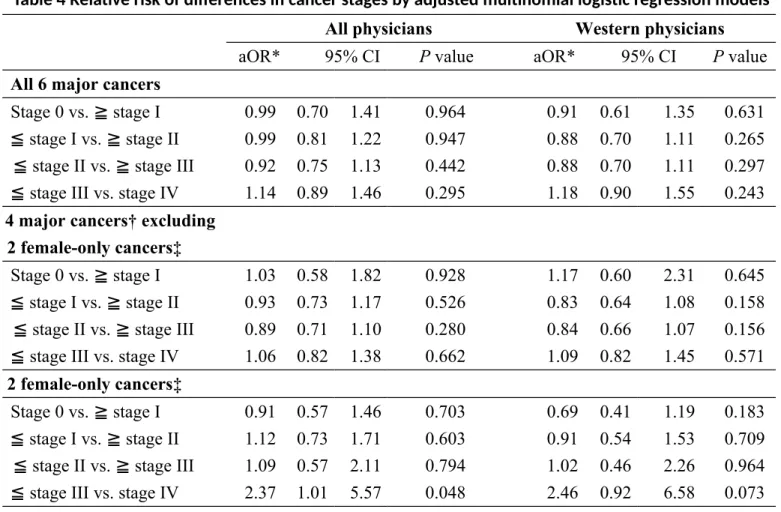
The results of unadjusted multinomial logistic regression analysis revealed no significant differences in most scenarios except that of the 2 female-only cancers, in which physicians had 2.64 folds higher risk to have stage IV cancer than stages 0 to III cancers (Table 3). After adjustment with age, gender (as necessary), income and environments (Table 4), the odds of having significant differences in cancer stages were similar except that in the 2 female-only cancers, physician had 2.37 to 2.46 folds higher risks to have advanced stages, though the result with sensitivity analysis in Western physicians was non-significant.
Interpretation
Main findingsOur findings suggested that physicians are not more likely to be diagnosed at an earlier stage of cancer compared to the non-healthcare general population after matches with age, gender, urbanization of residence and income. The findings were consistent either with extensive sub-group comparisons for cancer stages distribution (Table 2), or under multinomial logistic regression analyses plus sensitivity tests with subgroups in physicians (all physicians versus Western physicians only) or cancer types (6 major cancers versus 4 cancers excluding 2 female-only cancers versus 2 female-only cancers) (Table 4). Besides, of the 2 female-only cancers, physicians had higher risk to have advanced cancer stages.
Being a physician includes lots of factors that influence health: higher socio-economic level, more healthcare related knowledge, heavy workload, and a high-stress working environment.[5,9-11,26-29] After the propensity score matches, the physician cohort and the control cohort are socio-economically similar. The
remaining differences include knowledge, attitude and practice of health care or work load. Failure to have earlier incident cancer stages in physicians suggested certain gaps in practicing healthy life which deserve further attention.
cancer and cervical cancers. This was similar to previous report by Sankila et al. that the cancer risk of female health care personnel was increased when compared with that of all economically active women.[30] Chiang et al. reported that in female medical personnel, 12% had mammography and 10% received physician clinical examination as recommended,[31] indicating certain obstacles for female physicians to receive screening examinations. This might partially explain the causes for female physicians to have higher risks for advanced cancer stages. Currently there was no research reporting the participation status of female physicians in screening examinations for breast or cervical cancers. Further research may be needed to investigate the status of participation in mass screening examinations in doctors. Comparison with other studies
Attending screening services is an important method to detect early cancer. Women who were persistent with mammography screening were more likely to be diagnosed at earlier stages of breast cancer.[13] In Taiwan, the percentage of advanced stages of cervical cancer declined since the implementation of a national screening program in 1995.[12,14] Doctors seemed to have mediocre habits
participating in the screening. Gross et al. reported 35% of the study doctors did not have regular source of health care, implying not being screened for breast, colon, and prostate cancer.[32] In an Israeli research, 59.4% family doctors reported a strong
belief in the importance of screening tests, but only 27.5% actually underwent these tests themselves.[33] In Canada, though 48% doctors received breast or testicular examination by clinicians, 39% of doctors did not receive the examination for over 5 year or never received it.[34] These data support our findings that doctors were not diagnosed to have cancers at an earlier stage.
Good access to doctors may be another factor related with earlier incident cancer stages. Adequate supply of primary care physicians had protective effects on breast cancer stage and survival in Ontario.[15] Higher doctor density is associated with lower incidence of late-stage colorectal cancer in Pennsylvania.[16] Doctors, with their medical networks and better access to proper medical care, were shown to have better health outcomes then non-physicians. Shen et al. reported that physicians are less likely to develop or die of severe sepsis with acute severe infections; better medical knowledge, higher disease awareness, and easier healthcare access were considered as related factors.[10] Ridker et al. attributed a lower risk of death from acute myocardial infarction in male physicians to the shorter time delay from disease onset to hospital admission.[11]
Physicians in both Canada and Taiwan reported that their workload was too heavy.[5,26] However, the workloads of physicians under different health care systems differ substantially. In Canada, the average workload for patient care is 38
hours weekly;[34] 21% of doctors in California self-reported working more than 60 hours per week.[35] In Taiwan, the average workload for attending physicians in teaching hospitals were 89 hours weekly.[36] Heavier workloads might have worse impacts on doctors’ health,[37,38] which might partially explain the reasons for a non-superior result in our research. However, since workload should not be the sole factor influencing doctors’ health, our data might not be generalizable to other health care systems.
Limitations
Neither database provided important information on cancer related personal health behaviors. However, the propensity score adjustment is an important statistical technique to reduce the bias from confounding variables in observational studies and mimic the results of randomized control tests.[39] We used the propensity score method with extensive matches including income and environmental factors to reduce potential confounding factors. The long follow-up years and nationwide design provided adequate power for this novel topic. Besides, thyroid cancer and prostate cancer are both reported to be common cancers in physicians,[1] however since their rankings in general population are not high enough to be included in the Long Form of the Taiwan Cancer Registry File, they were not included in the present analysis. Conclusion
physicians. Rather, female doctors have advanced cancer stages in breast cancer and cervical cancer. We recommend policy makers to integrate the essence of physician wellness into national health care policy.
References
1. Lin SY, Lin CL, Hsu WH, et al. A comparison of cancer incidence among physician specialists and the general population: a Taiwanese cohort study. J
Occup Health 2013;55:158-66.
2. Eriksson M, Hardell L, Malker H, et al. Increased cancer incidence in physicians, dentists, and health care workers. Oncol Rep 1998;5:1413-8. 3. Maitre A, Colonna M, Gressin C, et al. Increased incidence of haematological
cancer among physicians in a University Hospital. Int Arch Occup Environ
Health 2003;76:24-8.
4. Nurminen M, Rimpela A, Pukkala E. Exceptionally low cancer incidence in doctors. Lancet 1988;1:190-1.
5. Guide to physician health and well being: facts, advice and resources for Canadian doctors. In: Canadian Medical Association, editors. Ottawa (ON): Canadian Medical Association; 2003. Available:
http://www.mtpinnacle.com/pdfs/guide-PHWB.pdf (accessed 2014 Oct. 23) 6. Arnetz BB. Psychosocial challenges facing physicians of today. Soc Sci Med
2001;52:203-13.
7. Pullen D, Lonie CE, Lyle DM, et al. Medical care of doctors. Med J Aust 1995;162:481-4.
Med J 2007;100:489-91.
9. Innos K, Rahu K, Baburin A, et al. Cancer incidence and cause-specific mortality in male and female physicians: a cohort study in Estonia. Scand J
Public Health 2002;30:133-40.
10. Shen HN, Lu CL, Li CY. Do physicians have lower risk of severe sepsis and associated mortality? A matched cohort study*. Crit Care Med 2014;42:816-23.
11. Ridker PM, Manson JE, Goldhaber SZ, et al. Comparison of delay times to hospital presentation for physicians and nonphysicians with acute myocardial infarction. Am J Cardiol 1992;70:10-3.
12. Chiang CJ, Chen YC, Chen CJ, et al. Cancer trends in Taiwan. Jpn J Clin
Oncol 2010;40:897-904.
13. Vyas A, Madhavan S, Sambamoorthi U. Association between persistence with mammography screening and stage at diagnosis among elderly women
diagnosed with breast cancer. Breast Cancer Res Treat 2014;148:645-54. 14. Chen YY, You SL, Chen CA, et al. Effectiveness of national cervical cancer
screening programme in Taiwan: 12-year experiences. Br J Cancer 2009;101:174-7.
15. Gorey KM, Luginaah IN, Holowaty EJ, et al. Associations of physician supplies with breast cancer stage at diagnosis and survival in Ontario, 1988 to
2006. Cancer 2009;115:3563-70.
16. Ananthakrishnan AN, Hoffmann RG, Saeian K. Higher physician density is associated with lower incidence of late-stage colorectal cancer. J Gen Intern
Med 2010;25:1164-71.
17. National Health Insurance Administration, Ministry of Health and Welfare, Executive Yuan, Taipei, Taiwan. 2014-2015 National Health Insurance Annual Report; 2014. p. 51. Available:
http://www.nhi.gov.tw/Resource/webdata/13767_1_NHI2014-2015%20Annual%20Report%20(bilingual)_141230.pdf (accessed 2015 Apr. 29).
18. Taiwan Cancer registry introduction. Taipei: Taiwan Health Promotion
Administration; 2012. Available: http://tcr.cph.ntu.edu.tw/main.php?Page=N1 (accessed 2015 Mar. 15).
19. Taiwan Bureau of Health Promotion. [Taiwan Cancer Registry Database]. Taipei: Taiwan Bureau of Health Promotion; 2010. Available:
http:// tcr.cph.ntu.edu.tw/uploadimages/CA10_LF97.pdf (accessed 2015 Mar. 15).
20. Taiwan Health Promotion Administration. Taiwan Cancer Registry Coding
2015. p. 16-35, 113. Available:
http://tcr.cph.ntu.edu.tw/uploadimages/Longform%20Manual_Official %20version_20150105_W.pdf (accessed 2015 Mar. 15).
21. Cancer Staging References. Chicago (IL): American Joint Commitee on Cancer; 2015. Available: https://cancerstaging.org/references-tools/Pages/ What-is-Cancer-Staging.aspx (accessed 2015 Mar. 15).
22. Liu CY, Hung YT, Chuang YL, et al. [Incorporating Development Stratification of Taiwan Townships into Sampling Design of Large Scale Health Interview Survey]. Journal of Health Management 2006;4:1-22. 23. Deyo RA, Cherkin DC, Ciol MA. Adapting a clinical comorbidity index for
use with ICD-9-CM administrative databases. J Clin Epidemiol 1992;45:613-9.
24. Regulations Governing the Exemption of the National Health Insurance Beneficiaries from the Co-Payment. Taipei: Taiwan National Health Insurance Administration; 2011. Available: http://www.nhi.gov.tw/English/webdata/ webdata.aspx?menu=11&menu_id=295&WD_ID=295&webdata_id=2431 (accessed 2015 Mar. 15).
25. Kleinbaum DG, Klein M. Logistic Regression: a self-learning text. 3rd ed. New York: Springer-Verlag; 2010.
unaffordable? Lessons from Taiwan. Health Aff (Millwood) 2003;22:77-88. 27. Spurgeon P, Barwell F, Maxwell R. Types of work stress and implications for
the role of general practitioners. Health Serv Manage Res 1995;8:186-97. 28. Sutherland VJ, Cooper CL. Identifying distress among general practitioners:
predictors of psychological ill-health and job dissatisfaction. Soc Sci Med 1993;37:575-81.
29. Landrigan CP, Rothschild JM, Cronin JW, et al. Effect of reducing interns' work hours on serious medical errors in intensive care units. N Engl J Med 2004;351:1838-48.
30. Sankila R, Karjalainen S, Laara E, et al. Cancer risk among health care personnel in Finland, 1971-1980. Scand J Work Environ Health 1990;16:252-7.
31. Chiang TT, Tai CS, Lin PH. [To survey the implementation of breast cancer screening hehaviors of female medical personnel – based on health belief model]. VGH Nursing 2011;28:130-8.
32. Gross CP, Mead LA, Ford DE, et al. Physician, heal Thyself? Regular source of care and use of preventive health services among physicians. Arch Intern
Med 2000;160:3209-14.
33. Peleg R, Ostermich A, Gienco V, et al. Screening tests among family doctors: do we do as we preach? Public health 2013;127:282-9.
34. Frank E, Segura C. Health practices of Canadian physicians. Can Fam
Physician 2009;55:810-1.e7.
35. Bazargan M, Makar M, Bazargan-Hejazi S, et al. Preventive, lifestyle, and personal health behaviors among physicians. Acad Psychiatry 2009;33:289-95.
36. Yang MC, Li YF, Wei SL. [An Analysis of the Work Hours and Related Factors Associated with Attending Physicians and Residents in Teaching Hospitals]. Journal of Medical Education 2007;11:222-33.
37. Wang LJ, Chen CK, Hsu SC, Lee SY, Wang CS, Yeh WY. Active job, healthy job? Occupational stress and depression among hospital physicians in Taiwan.
Industrial health 2011;49:173-84.
38. Buddeberg-Fischer B, Klaghofer R, Stamm M, Siegrist J, Buddeberg C. Work stress and reduced health in young physicians: prospective evidence from Swiss residents. Int Arch Occup Environ Health 2008;82:31-8.
39. Austin PC. An Introduction to Propensity Score Methods for Reducing the Effects of Confounding in Observational Studies. Multivariate Behav Res 2011;46:399-424
Table 1 Socio-demographic characteristics of physicians and general population under bivariate analysis before and after Propensity Score matches
Variables
Before Propensity Score Matches After 5:1 Propensity Score Matches
Total General
population Physicians P value Total Controls Physicians P
value N (%) N (%) N (%) N (%) N (%) N (%) Total 274003 (100) 273461 (99.8) 542 (0.20) 3216 (100) 2680 (83.33) 536 (16.67) Gender <0.001 0.971 Male 133538 (48.74) 133138 (48.69) 400 (73.80) 2369 (73.66) 1975 (73.69) 394 (73.51) Female 140465 (51.26) 140323 (51.31) 142 (26.20) 847 (26.34) 705 (26.31) 142 (26.49) Age 0.001 0.990 25-45 40881 (14.92) 40781 (14.91) 100 (18.45) 597 (18.56) 498 (18.58) 99 (18.47) 45-55 61617 (22.49) 61485 (22.48) 132 (24.35) 773 (24.04) 642 (23.96) 131 (24.44) 55-65 60294 (22.00) 60159 (22.00) 135 (24.91) 791 (24.60) 658 (24.55) 133 (24.81) Above 65 111211 (40.59) 111036 (40.60) 175 (32.29) 1055 (32.80) 882 (32.91) 173 (32.28) Urbanization of residence <0.001 1.000 Level 1 78010 (28.47) 77811 (28.45) 199 (36.72) 1199 (37.28) 1000 (37.31) 199 (37.13) Level 2&3 122463 (44.69) 122231 (44.70) 232 (42.80) 1393 (43.31) 1161 (43.32) 232 (43.28) Level 4&5 49249 (17.97) 49175 (17.98) 74 (13.65) 440 (13.86) 366 (13.66) 74 (13.81) Level 6&7 24281 (8.86) 24244 (8.87) 37 (6.83) 184 (5.72) 153 (5.71) 31 (5.78) Premium-based income (NT$) <0.001 1.000 Under 17280 15369 (5.61) 15343 (5.61) 26 (4.80) 156 (4.85) 130 (4.85) 26 (4.85) 17281-36300 209179 (76.34) 209074 (76.45) 105 (19.37) 630 (19.59) 525 (19.59) 105 (19.59) 36301-45800 22396 (8.17) 22302 (8.16) 94 (17.34) 568 (17.66) 474 (17.69) 94 (17.54) 45801-57800 10929 (3.99) 10889 (3.98) 40 (7.38) 239 (7.43) 199 (7.43) 40 (7.46) 57801-72800 9362 (3.42) 9267 (3.39) 95 (17.53) 575 (17.88) 480 (17.91) 95 (17.72) Above 72801 6768 (2.47) 6586 (2.41) 182 (33.58) 1048 (32.59) 872 (32.54) 176 (32.84)
Table 2 Distribution and comparisons of cancer stages among physicians and controls at different characteristics
Variables Stage 0 Stage I Stage II Stage III Stage IV P
value N (%) N (%) N (%) N (%) N (%) Total 280 (8.71) 831 (25.84) 660 (20.52) 778 (24.19) 667 (20.74) 0.482 Controls 233 (8.69) 692 (25.82) 543 (20.26) 664 (24.78) 548 (20.45) Physicians 47 (8.76) 139 (25.93) 117 (21.83) 114 (21.27) 119 (22.20) Gender: Male 0.432 Controls 71 (3.59) 475 (24.05) 355 (17.97) 590 (29.87) 484 (24.51) Physicians 12 (3.05) 102 (25.89) 77 (19.54) 100 (25.38) 103 (26.14) Gender: Female 0.779 Controls 162 (22.98) 217 (30.78) 188 (26.67) 74 (10.50) 64 (9.08) Physicians 35 (24.65) 37 (26.06) 40 (28.17) 14 (9.86) 16 (11.27) Age: 25-45 0.362 Controls 89 (17.87) 144 (28.92) 104 (20.88) 94 (18.88) 67 (13.45) Physicians 24 (24.24) 26 (26.26) 23 (23.23) 12 (12.12) 14 (14.14) Age: 45-55 0.812 Controls 83 (12.93) 178 (27.73) 139 (21.65) 127 (19.78) 115 (17.91) Physicians 13 (9.92) 40 (30.53) 31 (23.66) 23 (17.56) 24 (18.32) Age: 55-65 0.775 Controls 39 (5.93) 196 (29.79) 136 (20.67) 169 (25.68) 118 (17.93) Physicians 6 (4.51) 34 (25.56) 31 (23.31) 35 (26.32) 27 (20.30) Age: Above65 0.628 Controls 22 (2.49) 174 (19.73) 164 (18.59) 274 (31.07) 248 (28.12) Physicians 4 (2.31) 39 (22.54) 32 (18.50) 44 (25.43) 54 (31.21) Urbanization of residence Level 1 0.822
Controls 95 (9.50) 264 (26.40) 214 (21.40) 249 (24.90) 178 (17.8) Physicians 18 (9.05) 50 (25.13) 48 (24.12) 44 (22.11) 39 (19.6) Level 2&3 0.946 Controls 104 (8.96) 289 (24.89) 237 (20.41) 280 (24.12) 251 (21.62) Physicians 21 (9.05) 59 (25.43) 50 (21.55) 50 (21.55) 52 (22.41) Level 4&5 0.278 Controls 22 (6.01) 101 (27.6) 65 (17.76) 97 (26.50) 81 (22.13) Physicians 3 (4.05) 24 (32.43) 9 (12.16) 15 (20.27) 23 (31.08) Level 6&7 0.156 Controls 12 (7.84) 38 (24.84) 27 (17.65) 38 (24.84) 38 (24.84) Physicians 5 (16.13) 6 (19.35) 10 (32.26) 5 (16.13) 5 (16.13) Premium-based income (NT$) Under 17280 0.986 Controls 8 (2.83) 36 (27.69) 31 (23.85) 30 (23.08) 25 (19.23) Physicians 2 (7.69) 8 (30.77) 5 (19.23) 6 (23.08) 5 (19.23) 17281-36300 0.667 Controls 48 (9.14) 101 (19.24) 110 (20.95) 137 (26.10) 129 (24.57) Physicians 10 (9.52) 23 (21.90) 24 (22.86) 20 (19.05) 28 (26.67) 36301-45800 0.599 Controls 38 (8.02) 107 (22.57) 86 (18.14) 136 (28.69) 107 (22.57) Physicians 7 (7.45) 19 (20.21) 24 (25.53) 25 (26.60) 19 (20.21) 45801-57800 0.529 Controls 19 (9.55) 51 (25.63) 37 (18.59) 50 (25.13) 42 (21.11) Physicians 4 (10.00) 15 (37.50) 8 (20.00) 7 (17.50) 6 (15.00) 57801-72800 0.291 Controls 35 (7.29) 130 (27.08) 100 (20.83) 114 (23.75) 101 (21.04)
Above 72801 0.577 Controls 85 (9.75) 267 (30.62) 179 (20.53) 197 (22.59) 144 (16.51) Physicians 17 (9.66) 53 (30.11) 42 (23.86) 31 (17.61) 33 (18.75) Catastroph ic illness: No 0.473 Controls 230 (8.89) 664 (25.68) 524 (20.26) 647 (25.02) 521 (20.15) Physicians 44 (8.51) 136 (26.31) 112 (21.66) 111 (21.47) 114 (22.05) Catastroph ic illness: Yes 0.184 Controls 3 (3.19) 28 (29.79) 19 (20.21) 17 (18.09) 27 (28.72) Physicians 3 (15.79) 3 (15.79) 5 (26.32) 3 (15.79) 5 (26.32) CCI score: 0 0.224 Controls 138 (17.23) 218 (27.22) 197 (24.59) 176 (21.97) 72 (8.99) Physicians 29 (16.48) 49 (27.84) 43 (24.43) 30 (17.05) 25 (14.20) CCI score: 1-3 0.554 Controls 83 (7.35) 340 (30.09) 242 (21.42) 306 (27.08) 159 (14.07) Physicians 16 (7.41) 74 (34.26) 49 (22.69) 54 (25.00) 23 (10.65) CCI score: 4-6 0.051 Controls 11 (2.83) 94 (24.16) 63 (16.20) 113 (29.05) 108 (27.76) Physicians 1 (1.48) 10 (14.93) 19 (28.36) 14 (20.90) 23 (34.33)
CCI score: Above7 0.532
Controls 1 (0.27) 40 (11.11) 41 (11.39) 69 (19.17) 209 (58.06)
Physicians 1 (1.30) 6 (7.79) 6 (7.79) 16 (20.78) 48 (62.34)
Table 3 Relative risk of differences in cancer stages by unadjusted multinomial logistic regression models
All physicians Western physicians
OR* 95% CI P value OR* 95% CI P value
All 6 major cancers
Stage 0 vs. ≧ stage I 0.99 0.71 1.38 0.955 1.00 0.69 1.45 0.993 ≦ stage I vs. ≧ stage II 0.99 0.82 1.21 0.934 0.93 0.75 1.16 0.542 ≦ stage II vs. ≧ stage III 0.93 0.77 1.12 0.457 0.95 0.77 1.18 0.654 ≦ stage III vs. stage IV 1.11 0.89 1.39 0.361 1.20 0.94 1.54 0.143 4 major cancers† excluding
2 female-only cancers‡
Stage 0 vs. ≧ stage I 1.01 0.58 1.78 0.962 1.19 0.61 2.32 0.614 ≦ stage I vs. ≧ stage II 0.93 0.74 1.17 0.526 0.86 0.67 1.11 0.236 ≦ stage II vs. ≧ stage III 0.89 0.73 1.10 0.292 0.87 0.69 1.10 0.241 ≦ stage III vs. stage IV 1.04 0.82 1.33 0.726 1.10 0.84 1.43 0.484 2 female-only cancers‡
Stage 0 vs. ≧ stage I 0.97 0.62 1.52 0.908 0.75 0.45 1.25 0.263 ≦ stage I vs. ≧ stage II 1.21 0.81 1.82 0.348 1.02 0.62 1.68 0.929 ≦ stage II vs. ≧ stage III 1.24 0.66 2.30 0.504 1.22 0.58 2.58 0.599 ≦ stage III vs. stage IV 2.64 1.20 5.81 0.016 2.87 1.17 7.05 0.021 *Reference group: controls cohort ; † Lung cancer, colorectal cancer, oral cancer and hepatoma;
Table 4 Relative risk of differences in cancer stages by adjusted multinomial logistic regression models
All physicians Western physicians
aOR* 95% CI P value aOR* 95% CI P value
All 6 major cancers
Stage 0 vs. ≧ stage I 0.99 0.70 1.41 0.964 0.91 0.61 1.35 0.631 ≦ stage I vs. ≧ stage II 0.99 0.81 1.22 0.947 0.88 0.70 1.11 0.265 ≦ stage II vs. ≧ stage III 0.92 0.75 1.13 0.442 0.88 0.70 1.11 0.297 ≦ stage III vs. stage IV 1.14 0.89 1.46 0.295 1.18 0.90 1.55 0.243 4 major cancers† excluding
2 female-only cancers‡
Stage 0 vs. ≧ stage I 1.03 0.58 1.82 0.928 1.17 0.60 2.31 0.645 ≦ stage I vs. ≧ stage II 0.93 0.73 1.17 0.526 0.83 0.64 1.08 0.158 ≦ stage II vs. ≧ stage III 0.89 0.71 1.10 0.280 0.84 0.66 1.07 0.156 ≦ stage III vs. stage IV 1.06 0.82 1.38 0.662 1.09 0.82 1.45 0.571 2 female-only cancers‡
Stage 0 vs. ≧ stage I 0.91 0.57 1.46 0.703 0.69 0.41 1.19 0.183 ≦ stage I vs. ≧ stage II 1.12 0.73 1.71 0.603 0.91 0.54 1.53 0.709 ≦ stage II vs. ≧ stage III 1.09 0.57 2.11 0.794 1.02 0.46 2.26 0.964 ≦ stage III vs. stage IV 2.37 1.01 5.57 0.048 2.46 0.92 6.58 0.073 *Reference group: controls cohort ; † Lung cancer, colorectal cancer, oral cancer and hepatoma;
‡female breast cancer and cervical cancer;
All models were controlled for age, gender (not in the 2 female-only cancers group), incomes, urbanization of residence, status of catastrophic illnesses, and Charlson comorbidity index.