Effect of enantiomeric excess on surface structures and phase sequences in free-standing
liquid-crystal films
A. Cady,1Z. Q. Liu,1 X. F. Han,1S. T. Wang,1M. Veum,2N. Janarthanan,3C. S. Hsu,3 D. A. Olson,1 and C. C. Huang1 1School of Physics and Astronomy, University of Minnesota, Minneapolis, Minnesota 55455
2Department of Physics, University of Wisconsin, Stevens Point, Wisconsin 54481 3Department of Applied Chemistry, National Chiao Tung University, Hsinchu 30050, Taiwan
共Received 5 September 2002; published 19 December 2002兲
We present differential optical reflectivity and null transmission ellipsometry data from several mixtures of MHPBC enantiomers. From this data, we have determined the chiral smectic phase sequence as a function of enantiomeric excess. The data suggest a change in the structure of the smectic-C␣* phase and the surface tilt state as the enantiomeric excess is reduced. The results also show that the intermediate phases, smectic CFI2* ,
smectic CFI1* , and smectic C␣*, disappear sequentially on reducing the net chirality.
DOI: 10.1103/PhysRevE.66.061704 PACS number共s兲: 61.30.Gd, 83.80.Xz, 77.84.Nh
I. INTRODUCTION
The chiral smectic共Sm兲 liquid-crystal phases exhibited by rod-shaped molecules have remained of great interest in con-densed matter physics not only for their technological prom-ise in electro-optic devices, but for their appeal to researchers studying molecular interactions. The basic orientational structures of these phases have been studied extensively in optical experiments 关1–4兴, dielectric measurements 关5,4兴, resonant x-ray diffraction 关6兴, etc. Meanwhile, phenomeno-logical models have been developed and refined to describe the stability of the phases关8,7兴. The models assume several interlayer interactions, which bias the molecules to align with their tilt orientations parallel, antiparallel, or perpen-dicular to each other in adjacent layers. The relative strengths of these interactions drive the complicated chiral smectic phase sequence. Common to all the phases is a helical modu-lation of the tilt direction of the order of optical wavelengths that exists on top of the shorter, e.g., 1-, 2-, 3-, or 4-layer repeat units. The optical pitch results from interactions be-tween layers mainly due to molecular chirality. The molecu-lar chirality sets the handedness of the optical pitch in the Sm-C* phase and most likely determines the handedness of the incommensurate short helical pitch共ISHP兲 in the Sm-C␣*
phase.
In order to provide additional information for the phe-nomenological models and to understand what interactions give rise to particular phases, it is necessary to study sys-tems, for which the phenomenological parameters can be de-termined or systems that can be continually adjusted through the appropriate parameter space. Several studies have been performed, which to some extent yield values for the phe-nomenological parameters. A particular example of this has been experiments on the temperature evolution of the ISHP in the Sm-C␣* phase 关9,10兴. In this phase, the ISHP mainly results from competition between nearest-neighbor 共nn兲 and next-nearest-neighbor 共nnn兲 interactions. The relative strengths of these interactions have been ascertained in ex-periment. Furthermore, the existence of two very different temperature evolutions of the ISHP have been shown for consecutive members of two homologous series. One ISHP
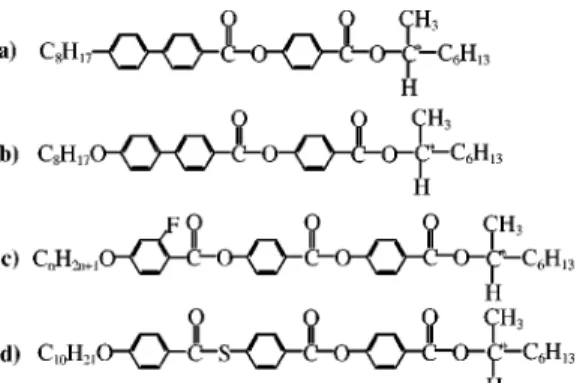
decreases by a rather small amount, e.g., 6.5–5.5 layers in 10OHFBBB1M7, on cooling while the ISHP observed in 11OHFBBB1M7 appears to evolve continuously between the Sm-C␣* phase and the Sm-C* phase 关10兴. Resonant x-ray scattering experiments have shown a similar continuous change in another compound 关11兴. In a continuing effort to understand this behavior, we have studied mixtures of vary-ing enantiomeric excess 共ee兲 of the liquid-crystal compound MHPBC. Here ee⫽(兩MR⫺MS兩/兩MR⫹MS兩)⫻100%, where MR ( MS) is the mass of the R- (S-) enantiomer in the sample. In its optically pure form (ee⫽100%), MHPBC ex-hibits a Sm-C␣*phase with an ISHP that varies with tempera-ture similar to the pitch in 10OHFBBB1M7 or 10OTBBB1M7 关2,6,10兴. The chemical structures of all the compounds discussed are presented in Fig. 1.
Recently Gorecka et al. 关12兴 have studied a similar sys-tem by varying the ee of the compound MHPOBC. Their results address a historical issue regarding the chiral smectic variant phases. When first discovered, the phases exhibited by MHPOBC, were named sequentially on cooling: Sm-C␣*, Sm-C*, and Sm-C␥* 关13兴. Their results show that the
Sm-C*phase is the Sm-CFI2* phase in the optically pure sample, and was possibly misidentified as Sm-C* due to partial ra-cemization of samples. Their results are interpreted in the context of a phenomenological model that includes a term
FIG. 1. Chemical structures of compounds discussed in the text: 共a兲 MHPBC, 共b兲 MHPOBC, 共c兲 10- and 11-OHFBBB1M7 with n ⫽10 and 11, respectively, and 共d兲 10OTBBB1M7.
proportional to ee. Other noteworthy studies on mixtures of MHPOBC have included ac calorimetry 关14兴, differential scanning calorimetry关13兴, and dielectric measurements 关15兴. The phase diagram presented by Gorecka et al. 关12兴 is a much more complete study of the importance of ee as it includes the Sm-CFI* phases and the Sm-CA* phase.
In this paper, we present results from optical experiments on mixtures of varying ee of the compound MHPBC. From the results, we have constructed a phase diagram for MH-PBC as a function of ee. The results presented here serve as an important compliment to previous resulting phase dia-grams based on varying ee. More importantly, our differen-tial optical reflectivity 共DOR兲 technique allows us to probe the details of the ISHP evolution in the Sm-C␣* phase more carefully. The previous studies on mixtures of MHPOBC have shown that the Sm-C␣*phase is remarkably stable as the ee is reduced toward a racemic mixture 关4,12-14兴. Our re-sults suggest an ISHP in the Sm-C␣* phase that changes its temperature evolution as the ee of the mixture is reduced. In addition, we show that the Sm-CFI2* , Sm-CFI1* , and Sm-C␣*
phases disappear sequentially on reducing the ee. Our experi-mental procedure and data are presented in the following section. A discussion of our results is given in Sec. III and is followed by a brief conclusion in Sec. IV.
II. EXPERIMENT
The compound MHPBC, which exhibits several of the chiral smectic variant phases, has been studied extensively 关1,2,4,16兴. The chemical structure of MHPBC is shown in Fig. 1. (R)-(⫺)-2-octanol 99% purity 共98% ee/GLC兲 and (S)-(⫹)-2-octanol 99% 共98% ee/GLC兲 were purchased from Aldrich chemical company, where GLC stands for gas-liquid chromatography. The final compounds were purified by column chromatography on silica gel using hexane as a solvent and repeated recrystallizations using hexane. The pu-rity of compounds was checked by thin layer chromatogra-phy and by normal phase high performance liquid chroma-tography using hexane as a solvent. The purity was found to be greater than 99.5%. The chemical structures of the MH-PBC enantiomers were confirmed by using nuclear magnetic resonance spectroscopy, infrared, and elemental analysis. Fi-nal compounds showed better than 99.5% purity in elemental analysis.
The phase sequence of the pure MHPBC is isotropic (109 °C) Sm-A (75.3 °C) Sm-C␣* (70.7 °C) Sm-CFI2*
(66.1 °C) Sm-CFI1* (62.2 °C) Sm-CA*. We have prepared six mixtures of S and R enantiomers of MHPBC with ee ranging from 8.8% to 96.2% by weight. We have also studied the pure S and R enantiomers. By observing a bulk sample in a hot stage under a polarizing microscope, we determined that the enantiomers have roughly equivalent isotropic-Sm-A transition temperatures and relatively small coexistence re-gions.
The mixtures were prepared by first weighing the enanti-omers in crystal form using a balance accurate to 0.2 mg. Then the mixture was heated into the isotropic phase on a hot plate and stirred with a glass rod. The temperature of the hot
plate was monitored continually with a handheld thermo-couple gauge to prevent sample damage from overheating. The results presented here were obtained from samples with ee of 8.8⫾0.7%, 29.4⫾0.6%, 50⫾1.2%, 71.2⫾1.2% 86.6 ⫾1.5%, and 100%, in which the majority weight is S enan-tiomer. We also studied samples with ee values of 91.6 ⫾0.6%, 96.2⫾0.3%, and 100%, in which the majority is R enantiomer 关17兴. For each sample, we have studied films of several thicknesses using DOR to determine the phase se-quence. For the 91.6% mixture, we used null transmission ellipsometry 共NTE兲 to differentiate conclusively the Sm-CFI2* and Sm-CFI1* phases.
The experimental setup of DOR has been described else-where关18兴. The main advantage of using DOR for this ex-periment is its clear-cut ability to discern the Sm-C␣* phase in free-standing films with a reasonably fast data acquisition rate. Other identifications of this phase have been made by electro-optical response 关19兴, conoscopy 关4,5兴, ellipsometry 关2,9兴, dielectric spectroscopy 关12兴, and resonant x-ray dif-fraction 关6,11兴. The Sm-C␣* phase appears to be nearly im-possible to identify with polarizing microscopy on bulk samples because it is uniaxial in bulk samples and, to the best of our knowledge, is always below the uniaxial Sm-A phase. Despite this difficulty, it should be noted that Laux et al. 关20兴 have been able to identify the Sm-C␣* phase by observations of Friedel fringes on free surfaces of liquid-crystal drops demonstrating that under special circumstances, the phase can be optically resolved in bulk samples. One possible method of identifying this phase in free-standing films has been depolarized reflected light microscopy 共DRLM兲. Here, one can identify the Sm-C␣* phase by the
dynamics of the film texture arising from surface reorienta-tions, which have been previously described关2兴. One draw-back of such a method is that it relies heavily on the presence of defects in the film texture, e.g., 2walls, and temperature gradients in the film. For this reason, the transition tempera-tures determined in this way are not as precise as desired.
Figure 2 shows typical DOR data obtained from the MH-PBC mixtures. Ipand Isare the intensities of reflected beams having the orthogonal p and s polarizations, respectively. In Fig. 2共a兲, the data are from a 100-layer film of the 71.2% mixture. In Fig. 2共b兲, the data are from a 51-layer film of the 91.6% mixtures. The temperature ranges of the phases are labeled in the figure. Typically, the Sm-A phase shows up in DOR data as a relatively flat signal. The data collected under opposite orientations of the field are separated by a discern-ible amount, indicating a synclinic surface structure, in which the molecules at the top and bottom free surfaces are tilted in the same direction. The tilt directions in adjacent layers at the surfaces are also parallel to each other. In both mixtures, the synclinic surface structure occurs throughout most of the Sm-A phase. In the mixtures with ee⬎86.6%, there is a transition from synclinic to anticlinic between the two outermost surface layers. This is shown in Fig. 2共b兲 as the data in gray and black show a step and lie almost on top of each other in the lower temperature of the Sm-A phase. This feature always occurs at the same temperature for each mixture and does not depend on film thickness, thus we
as-cribe it to a surface transition.
The Sm-C␣* phase is present directly below the Sm-A phase in the 71.2% and 91.6% mixtures as characterized by oscillations in the DOR signal. These oscillations have been described previously关2兴 and arise from the rotation of biax-ial surface layers caused by the evolution of the ISHP with temperature. They always occur in free-standing films exhib-iting the Sm-C␣* phase unless the film is too thin. There are two important distinctions between the data from the 71.2% mixture and the 91.6% mixture. In the 71.2% mixture, the oscillations in the Sm-C␣* phase are separated by a small amount on reversal of the applied electric field, which is consistent with synclinic surface ordering. In the 91.6% mix-ture, these oscillations lie roughly on top of each other under opposite orientations of the field indicating anticlinic surface structures. The other difference is in the frequency of oscil-lations in temperature space. In the greater ee mixture, this frequency is roughly constant in temperature for all films studied. In the lower ee 71.2% mixture, the frequency of oscillations increases as the sample is cooled toward the Sm-C* phase. The transition between different Sm-C␣* phase behaviors occurs between the 86.6% mixture and the 71.2% mixtures. This remarkable variation in the temperature evo-lution of the ISHP is most likely due to the change of net polarizations between different chiral mixtures.
In both the 71.2% mixture and the 91.6% mixture, the Sm-C* phase forms directly below the Sm-C␣* phase. This phase is known to be ferroelectric and thus the DOR data are well separated under opposite orientations of the applied electric field. Nonetheless, there is a clear difference in the two sets of data in the Sm-C* phase. In the 71.2% mixture, the evolution of the structure is smooth for all films studied,
whereas in the 91.6% mixture, there is a steplike pattern in the data as the sample is cooled into the lower-temperature phase. This pattern occurs in the 91.6% mixture, which has the Sm-CFI2* phase below the Sm-C* phase. On cooling through the Sm-C* phase, the surface layers transform into antiferroelectriclike arrangements, and the growth of surface layers increases significantly on cooling. This effect has re-cently been noted in NTE studies of another compound关21兴. Such surface-layer growth is consistent with the steplike pattern.
In the 71.2% mixture, the Sm-CFI1* phase exists at the lower-temperature side of the Sm-C* phase. In DOR data, this phase is mainly characterized by a large amplitude noise that does not have a clear dependence on the orientation of the applied electric field. Since noise is not a clear-cut way to identify a specific phase, we have strengthened this argument for the presence of the Sm-CFI1* phase with NTE studies, which are discussed in more detail below. In the 91.6% mix-ture, both the Sm-CFI2* phase and the Sm-CFI1* phase form on cooling below the Sm-C* phase. We conclude that the phase directly below the Sm-C*phase is the Sm-CFI2* phase by the observation of a minute effect on the DOR data with reversal of the applied electric field direction. A defect-free sample in an antiferroelectric phase such as the Sm-CFI2*
should yield ⬇180° symmetry with respect to the applied electric field. This phase is also generally less noisy than the Sm-CFI1* phase关22兴. We use the same argument to identify the Sm-CA* phase at low temperatures in both mixtures. There were no additional detectable phase changes on cool-ing between the Sm-CA* and crystal phases.
The experimental setup of NTE has also been described elsewhere 关1兴. NTE was performed on free-standing films with an applied electric field E of ⬇22 V/cm. With eight electrodes equally spaced around the film, E can be rotated through 360° in the plane of the film. By recording the el-lipsometric parameters⌬ and ⌿, as described below, at each angle ␣, we can determine the optical symmetry of the phase. In this technique, the Sm-CFI1* and Sm-CFI2* phases can be distinguished quite easily as has been previously re-ported 关1兴. NTE runs were performed by holding the free-standing film at a constant temperature, and rotating E through 360° with between 16 and 32 steps.
In general, the ellipsometric parameters⌿ and ⌬ describe the orientation and ellipticity of polarized light. Free-standing liquid-crystal films alter the polarization of light as it is transmitted. If for instance, linearly polarized light is incident on the film, the transmitted light is usually ellipti-cally polarized. In NTE, the opposite scenario is exploited; that is, polarized light with proper ellipticity and orientation is incident on the film so that the transmitted light is linearly polarized. Specifically, then⌿ is the orientation of the output linearly polarized light and⌬ is phase lag between the p and s components of the incident light necessary to produce out-put linearly polarized light. Physically, ⌿ represents the ef-fect of the film on the orientation of polarized light and⌬ is related to the biaxiality of the film.
Figure 3 shows NTE data acquired on a 65-layer film of the 91.6% mixture. The NTE data is plotted as the two ellip-FIG. 2. 共a兲 shows DOR data from a 100-layer film of the 71.2%
mixture. 共b兲 shows DOR data from a 51-layer film of the 91.6% mixture. Both sets of data were acquired on cooling at 80 mK/min under opposite orientations 关␣⫽0° 共gray lines兲 or 180° 共black lines兲兴 of E⬇3 V/cm in the plane of the film and in the incidence plane. See Fig. 3 for the definition of␣.
sometric parameters ⌬ and ⌿, versus␣. With such an ap-proach, the symmetry of different liquid-crystal phases can be easily determined. A discussion of how the symmetry of the data is related to the structure has been given elsewhere 关1兴. Here, we present data to show that the conclusions we reached with DOR data on the identification of the Sm-CFI2*
and Sm-CFI1* are correct. In Figs. 3共a兲 and 3共b兲, the data were acquired in the temperature region identified as Sm-CFI2* by DOR. Both⌿ and ⌬ show a roughly 180° symme-try with respect to the applied electric field. In Figs. 3共c兲 and 3共d兲, the data were obtained in the Sm-CFI1* phase, and there is no definitive symmetry in the data, aside from the required 360° rotational symmetry. Such results are common to these phases in all NTE studies. To further substantiate the ability to distinguish these phases in NTE, we have plotted the data in Fig. 3 as ⌿ versus ⌬ in Fig. 4. The characteristic shapes shown in Figs. 4共a兲 and 4共b兲 correspond to the Sm-CFI2* and
Sm-CFI1* phases, respectively. The data acquired in the Sm-CFI2* phase typically shows two overlapping rings of data corresponding to its 180° rotational symmetry. The data ob-tained in the Sm-CFI1* phase has a clearly different shape due to its different symmetry. This clear-cut method of identify-ing the phase works even though these phases often have significant defects as evidenced in temperature-ramp NTE and DOR studies as well as in DRLM observations.
After studying from 3 to 14 films of each mixture of MH-PBC, we have developed the phase diagram shown in Fig. 5, The phase transition temperatures are plotted versus the ee. For clarity, only the phase sequences for ee⭓71.2% have been included. The error bars in the figure are the calculated standard deviations of the distributions of transition tempera-tures for many different films of each mixture studied. In the cases, where the data point overlaps the error bar, the error is ⭐0.1 K. In the range 50.0%⬍ee⬍71.2%, the Sm-CFI1* phase disappears and in the range 29.4%⬍ee⬍50.0%, the Sm-C␣* phase disappears. Thus, near the racemic mixture (ee⫽0%), the only remaining phases are the A, Sm-C*, and Sm-CA*phases. Between the 71.2% and 86.6% mix-tures, the Sm-CFI2* phase disappears. With 91.6%⬍ee ⬍96.2%, the Sm-C*disappears, and the Sm-C␣*phase has a direct phase transition into the Sm-CFI2* phase for ee ⭓96.2%. In Fig. 5, the gray lines are drawn in places where the exact disappearance of the given phase is not known.
III. DISCUSSION
The phase diagram shown in Fig. 5 for the compound MHPBC clearly demonstrates how dependent the chiral smectic phase sequence is on the optical purity or ee of a sample. The phase diagram shows how the Sm-CFI2* , Sm-CFI1* , and Sm-C␣*phases disappear sequentially on reducing ee. In MHPBC as in MHPOBC, the Sm-C*phase disappears as the ee approaches 100%. The phase diagram is
qualita-FIG. 3. ⌿ and ⌬ versus␣ data acquired from a 65-layer film of the 91.6% mixture. kiis the projection of the direction of incident
laser light onto the film plane and␣ is defined as the angle between kiand the direction of the applied electric field E, as shown in the
inset. The lines are aids to the eye.
FIG. 4. The⌿ versus ⌬ plot to demonstrate the characteristic shapes of the data for the共a兲 Sm-CFI2* and共b兲 Sm-CFI1* phases. The
lines are aids to the eye.
FIG. 5. The phase diagram for MHPBC as a function of enan-tiomeric excess. The solid lines are aids to the eye, and the gray lines indicate possible phase boundaries that terminate at interme-diate values of ee. For clarity, the phase sequences for values of ee⬍71.2% have been omitted.
tively similar to the results of Gorecka et al. However, in MHPOBC, the Sm-CFI1* is absent in the phase sequence for ee⬍82% whereas in MHPBC, the Sm CFI1* is stable even for ee⬍71.2% 关12兴.
Our results indicate that the ee also affects the surface structure in free-standing films. For ee⬎86.6%, there is a synclinic to anticlinic surface transition in the Sm-A phase, whereas for ee⬍86.6%, the surfaces appear to remain syn-clinic into the Sm-C␣* phase. As demonstrated in Fig. 2, the ISHP evolution changes for 71.2%⬍ee⬍86.6%. At lower ee, the data are consistent with the ISHP evolution in com-pounds that exhibit a continous evolution of ISHP into the Sm-C* phase. The crossover in ISHP evolution will require a large amount of additional study. More generally, though, the results show that the Sm-C␣*phase is stable to low values of ee. This is in agreement with other studies 关12,14兴 and supports the model for the Sm-C␣*phase arising from com-petition between nn and nnn interactions.
With respect to the interlayer interactions, further work needs to be done. For example, the reduction in ee has at least two effects on the interlayer interactions reflected in the phenomenological models. First, the models include chiral interactions between nearest neighbors. Second, decreasing the ee of the sample will reduce its polarization关23兴. This, in turn should affect the electrostatic interactions reflected in nn, nnn and other interaction terms in the models.
If the ee affects the achiral interlayer interactions, it is important to understand how or to what extent it influences these interactions. To examine these interactions, we present a summary of the molecular arrangements observed in the chiral smectic phases along with the possible type of inter-actions that correspond to the arrangements in Table I. P refers to molecules having parallel tilt directions, and AP refers to molecules having antiparallel tilt directions. In the Sm-C␣* phase, the structure consists of an ISHP as discussed previously.
In the Sm-C* phase, all molecules are tilted in the same direction, whereas in the Sm-CA* phase, the molecules are tilted in opposite directions in adjacent layers if the optical
pitch is disregarded. In between these phases, the molecular arrangement is complicated. The structure of the Sm-CFI2* phase is distorted such that the nn arrangements are half⬇P and half⬇AP while the nnn arrangement is AP. On cooling into the Sm-CFI1* phase, the nn and nnn arrangements are a mix of P and AP. It should be noted that in order to obtain the three-layer repeat unit in the Sm-CFI1* phase in the phe-nomenological model, one has to include a third nn coupling term.
Overall, the table shows the usually observed phase se-quence upon cooling. It is clear that the nn interaction changes from being F 共ferroelectric兲 to weakly F before be-coming AF 共antiferroelectric兲. On decreasing temperature, there are the following effects: the tilt angle and the polar-ization increase, and the layer fluctuations should decrease. With large layer fluctuations, which one expects at high tem-peratures, parallel tilt orientations should be favored steri-cally. As these fluctuations decrease, antiparallel tilt orienta-tions may occur. The decreasing layer fluctuaorienta-tions coincide with the increased tilt, and the higher polarization favors the AF nn interactions that correspond with AP arrangements.
The nnn interactions evolve less clearly. In the pure enan-tiomers or in the mixtures with a large value of ee (⭓91.6%), the nnn interaction appears to be strongly AF such that the sample displays the following phase sequence: Sm-A –Sm-C␣*–Sm-CFI2* –Sm-CFI1* –Sm-CA* with the Sm-C* phase absent. Upon reducing the ee, the Sm-C* phase appears, and its continually increasing temperature range se-quentially squeezes out the Sm-CFI2* , Sm-CFI1* , and Sm-C␣*
phases. Meanwhile, the transition into the Sm-CA*phase also moves to lower temperatures as the ee decreases. For ee ⭐8.8%, all three intermediate phases disappear, and the phase sequence becomes: Sm-A –Sm-C*–Sm-CA*.
One should note that the Sm-C␣* phase disappears at lower chiralities than the Sm-CFI* phases. This is consistent with other proposals that the ISHP is mainly caused by com-petition between nn-F and nnn-AF interactions. At this lower chirality, it appears that the ISHP may evolve continuously into the Sm-C* phase. Previously, we have noted 关10兴 that this type of ISHP corresponds to a nnn-AF interaction that approaches zero as temperature is reduced. The effect of re-duced polarization on achiral interlayer interactions may cause the change in the ISHP evolution in the Sm-C␣* phase as a function of ee.
IV. CONCLUSION
In this paper, we have presented results from optical in-vestigations on mixtures of varying ee of MHPBC. The re-sults demonstrate the ability of DOR and NTE to identify accurately all of the chiral smectic variant phases in free-standing films. The data shown are consistent with previous experimental results on mixtures of the compound MHPOBC presented by Gorecka et al. 关12兴. One difference is the de-gree of mixing required to eliminate the Sm-CFI1* phase. In addition, we have shown how ee may affect the surface tran-sitions in the Sm-A phase and the ISHP temperature evolu-tion in the Sm-C␣*phase.
TABLE I. This table summarizes the experimentally observed nn and nnn arrangements and the most likely type of interaction associated with each arrangement in the smectic-C*variant phases. Here, we ignore the effect due to the long optical pitch found in most of the phases.
Molecular arrangement Type of interaction
Phase nn nnn nn nnn Sm-C␣* ISHP ISHP F AF Sm-C* P P F Fa Sm-CFI2* 1/2⬇P AP ⬇F AF 1/2⬇AP or⬇AF Sm-CFI1* 1/3⬇P 1/3⬇P AF AF or weak F 2/3⬇AP 2/3⬇AP Sm-CA* AP P AF Fa
aAn AF-nnn interaction that is weak compared to the nn interaction is also possible.
ACKNOWLEDGMENTS
M.V. acknowledges financial support from the University Professional Development Committee at the University of
Wisconsin–Stevens Point. This research was supported in part by the National Science Foundation, Solid State Chem-istry Program under Grant Nos. DMR-0106122 and 9901739.
关1兴 P.M. Johnson, D.A. Olson, S. Pankratz, T. Nguyen, J. Goodby, M. Hird, and C.C. Huang, Phys. Rev. Lett. 84, 4870共2000兲. 关2兴 D.A. Olson, S. Pankratz, P.M. Johnson, A. Cady, H.T. Nguyen,
and C.C. Huang, Phys. Rev. E 63, 061711共2001兲.
关3兴 D. Konovalov, H.T. Nguyen, M. Copic, and S. Sprunt, Phys. Rev. E 64, 010704共2001兲.
关4兴 A. Fukuda, Y. Takanishi, T. Isozaki, K. Ishikawa, and H. Tak-ezoe, J. Mater. Chem. 4, 997共1994兲.
关5兴 J.P.F. Lagerwall, D.D. Parghi, D. Kru¨erke, F. Gouda, and P. Ja¨gemalm, Liq. Cryst. 29, 163共2002兲.
关6兴 P. Mach, R. Pindak, A.-M. Levelut, P. Barois, H.T. Nguyen, H. Baltes, M. Hird, K. Toyne, A. Seed, J.W. Goodby, C.C. Huang, and L. Furenlid, Phys. Rev. E 60, 6793共1999兲.
关7兴 D.A. Olson, X.F. Han, A. Cady, and C.C. Huang, Phys. Rev. E 66, 021702共2002兲.
关8兴 M. Ceˇpicˇ and B. Zeˇksˇ, Phys. Rev. Lett. 87, 085501 共2001兲. 关9兴 D. Schlauf, Ch. Bahr, and H.T. Nguyen, Phys. Rev. E 60, 6816
共1999兲.
关10兴 A. Cady, D.A. Olson, X.F. Han, H.T. Nguyen, and C.C. Huang, Phys. Rev. E 65, 030701共2002兲.
关11兴 L.S. Hirst, S.J. Watson, H.F. Gleeson, P. Cluzeau, P. Barois, R. Pindak, J. Pitney, A. Cady, P.M. Johnson, C.C. Huang, A.-M. Levelut, G. Srajer, J. Pollmann, W. Caliebe, A. Seed, M.R. Herbert, J.W. Goodby, and M. Hird, Phys. Rev. E 65, 041705 共2002兲.
关12兴 E. Gorecka, D. Pociecha, M. Ceˇpicˇ, B. Zeˇksˇ, and R.
Dab-rowski, Phys. Rev. E 65, 061703共2002兲.
关13兴 A.D.L. Chandani, Y. Ouchi, H. Takezoe, A. Fukuda, K. Terashima, K. Furukawa, and A. Kishi, Jpn. J. Appl. Phys. 28, L1261共1989兲.
关14兴 K. Ema, M. Kanai, H. Yao, Y. Takanishi, and H. Takezoe, Phys. Rev. E 61, 1585共2000兲.
关15兴 H. Uehara, Y. Iino, and J. Hatano, Jpn. J. Phys. 36, 6118 共1997兲.
关16兴 T. Akizuki, K. Miyachi, Y. Takanishi, K. Ishikawa, H. Takezoe, and A. Fukuda, Jpn. J. Appl. Phys. 38, 4832共1999兲.
关17兴 The mixtures were prepared in order to preserve the limited amount of sample. Thus, some mixtures were made into other mixtures with lower ee by adding more of the minority enan-tiomer. In addition, to conserve the compounds, we studied mixtures in which either R- or S-enantiomer was the majority. 关18兴 S. Pankratz, P.M. Johnson, and C.C. Huang, Rev. Sci. Instrum.
71, 3184共2000兲.
关19兴 K. Hiraoka, Y. Takanishi, K. Skarp, H. Takezoe, and A. Fukuda, Jpn. J. Appl. Phys. 30, L1819共1991兲.
关20兴 V. Laux, N. Isaert, G. Joly, and H.T. Nguyen, Liq. Cryst. 26, 361共1999兲.
关21兴 X.F. Han, D.A. Olson, A. Cady, J.W. Goodby, and C.C. Huang, Phys. Rev. E 65, 010704共2002兲.
关22兴 K. Miyachi, M. Kabe, K. Ishikawa, H. Takezoe, and A. Fukuda, Ferroelectrics 147, 147共1993兲.