Does the Distribution of Breeding Bird Species Richness in
Taiwan Follow the Mid-Domain Effect?
Chao-Nien Koh
(1,2,3), Pei-Fen Lee
(1)and Shan-Hua Wu
(1)(Manuscript received 15 November, 2005; accepted 12 January, 2006)
ABSTRACT: In this paper, we examined the breeding bird species richness along an elevational
gradient in northern Taiwan. These data obtained from 144 sites were used to test the mid-domain model. We compared the species richness with expectations from the mid-domain models, and identified elevational ranges at which the species richness was excessive or depauperate in species, relative to expectations. In addition, we compared the observed spatial distributions of geographic ranges with those predicted by mid-domain models to explore how species richness deviations were produced. Along the entire elevational gradient, observed species richness in most sites obviously deviated from those predicted by mid-domain models. We hypothesize that asymmetrical hump-shaped curve of the species richness may come from the combination of the favorableness hypothesis, the productivity hypothesis, and the mid-domain effect. Comparisons between observed and predicted spatial distributions of geographic ranges indicated that the nonrandomness of the distributions of endpoints or midpoints was highly congruent with vegetation transitions along the elevational gradient. The time hypothesis may account for the nonrandomness below 500 m.
KEY WORDS: Bird species richness, Elevational gradient, Mid-domain effect, Taiwan.
INTRODUCTION
Describing and explaining spatial patterns of species diversity has been one of the main themes in ecology. The best-known pattern is the latitudinal gradient in species richness which states that species richness peaks within tropical latitudes, decreasing toward the poles (Rosenzweig, 1995). Previously, patterns of species richness along elevational gradients were considered as mirrors of species richness along the latitudinal gradients (Stevens, 1992). However, Rahbek’s review (1995) of elevational diversity patterns from a variety of taxa showed that only 20% of the studies supported a monotonically decreasing curve, 49% exhibited hump-shaped curves with the highest richness at mid-elevations; and 24% had a plateau of high richness across the lower elevations.
As the diversity theory has progressed and more empirical data have been generated, it has become clear that many factors underlie large-scale diversity gradients (Brown, 2001; Lomolino, 2001), among themthemid-domaineffect(ColwellandLees, 2000). ___________________________________________
1. Institute of Ecology and Evolutionary Biology, National Taiwan University, 1, Roosevelt Road, Sec. 4, Taipei 10617, Taiwan. 2.Division of Forest Protection, Taiwan Forestry Research
Institute, Council of Agriculture, 53, Nanhai Road, Taipei 10066, Taiwan.
3. Corresponding author. Tel: 886-2-23039978; Fax: 886-2- 23078755; Email: nien@tfri.gov.tw
A mid-domain effect occurs when landmass boundaries, such as oceans and mountaintops, limit species ranges, and the simple overlap of many, variously sized ranges creates a peak in species richness at mid-elevation (Colwell and Hurtt, 1994; Colwell and Lees, 2000). This prediction is based solely on geographical constraints and offers a null model against which empirical patterns can be compared. Although there are some critics of the mid-domain effect (see Zapata et al., 2003), many empirical studies support the predicted pattern (Colwell et al., 2004). In recent years, comparisons of observed biodiversity patterns with predictions based on randomizations of geographic range have become common (see review of Colwell et al., 2004).
Many local-scale studies in Taiwan found hump-shaped relationship between bird species richness (BSR) and elevation (Kano, 1940; Jai, 1977; Shiu and Lee, 2003; Ding et al., 2005). Using compiled data from all of Taiwan, Lee et al. (2004) examined distributions of BSR on a regional scale and also found a hump-shaped relationship. They hypothesized that urbanization might have decreased the BSR and changed the inverse relationship between BSR and elevation into a hump-shaped relationship. They also proposed a time hypothesis which stated that the biotic communities in the mid-elevation zone of Taiwan
had relatively longer periods of existence during the Pleistocene glacial cycles. The diversity patterns of birds along elevational gradients have not been tested using mid-domain null models.
The objectives of this study were to (1) examine the species richness pattern in breeding birds along an elevational gradient in northern Taiwan, (2) evaluate the support for a mid-domain model by comparing the observed distribution of BSR to mid-domain predictions, and (3) compare observed spatial distributions of elevation ranges with those predicted by a mid-domain model, and identify the BSR deviations using the spatial distribution of geographic ranges.
METHODS
Study area
Taiwan is a continental island off the southeast coast of the Asian mainland. It is separated from the mainland by the Taiwan Strait, which is about 150 km wide. The lofty mountains of Taiwan include more than 200 peaks higher than 3000 m (Wang, 1980). The climate is generally subtropical at lowlands. Temperature decreases as elevation increases at a lapse rate of -5.43°C km-1 (Su, 1984a).
Precipitation is heaviest during the summer, but rain falls year-round in northern region. Due to the high precipitation, forests are the primary type of natural vegetation in Taiwan. Broadleaf forests are dominant at lower elevations (generally under 2500 m), whereas coniferous forests are more prominent at higher elevations.
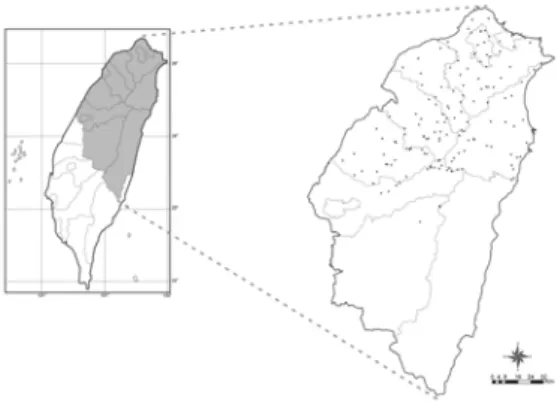
This study was conducted in northern Taiwan over an area of 11388.6 km2 (Fig. 1). The area lies
between latitudes 24°00’N and 25°18’N, and longitudes 120°27’E and 122°00’E. The greatest N-S distance is 144.9 km, and the greatest E-W distance is 150.85 km. In general, the elevation gradient increases from north to south, with mountains higher than 3000 m located primarily in the southern portion. The temperature averages 21.5°C (range: 16.7-23.0°C) and the total precipitation averages 2976.4 mm (range: 1283.0-4892.4 mm) at sea level (Taiwan Central Weather Bureau, http://www. cwb.gov.tw). Vegetation types occurring along the elevational gradient are Ficus-Machilus, Machilus-
Castanopsis, Quercus, Tsuga-picea, Abies, and
alpine (Su, 1992). Bird data
BSR data were sampled from 144 sites during early March to the end of June in 2001-2003. Sites were chosen based on four GIS layers: ecoregion (Su, 1992), elevation, vegetation, and road
Fig. 1. Map of sampling locations in northern Taiwan.
distribution. The number of the sampling sites in each ecoregion was determined by the relative area of each ecoregion. The same criterion was used to determine the number of sites placed in each of the three elevation classes: low (0-1000 m), mid (1000-2000 m), and high (above 2000 m), and in each of vegetation type. All sites were placed in areas within the reach of road systems to make sure easy accessibility.
At each site, we established one transect with 5-10 point counts located at least 150 m apart. At each station, we recorded the bird species that were seen or heard during a six-minute sample period. We applied the variable circular plot method in these point counts (Reynolds et al., 1980). Each site was sampled one time. Sampling was conducted during sunny, windless days from sunrise to no more than 3 hours later. Geographic coordinates and elevations for each station were taken with a handheld Global Positioning System receiver (Garmin, Taipei, Taiwan).
Data analysis
BSR for each site were calculated as the cumulative species number across all the point counts at that site. Exotic species, migrants, and individuals of breeding species that were passing through the area were excluded from analyses. To evaluate potential variations in sampling effort among sites, we adjusted species richness using nonparametric randomization estimators, Chao2 and Jack2, the least biased estimates for small numbers of samples (Colwell and Coddington, 1994). The species richness was logarithmically transformed to stabilize the variances and improve the normality of the residuals. We used the lowest and highest elevations where a species occurred in this study as the lower and higher range endpoints of the species, respectively. The range extent and midpoint for a species were the difference and the mean of its higher and lower endpoints, respectively.
To test the influence of geographic boundaries, observed diversity patterns were compared to null model predictions generated by a Monte Carlo simulation procedure (Mid-Domain Null, McCain, 2004). This procedure generates species richness curves by sampling either empirical range sizes or range midpoints, and then randomizing the other within a bounded domain, based on analytical stochastic models (Colwell and Hurtt, 1994; Colwell and Lees, 2000). We model range locations as uniformly distributed among geometrically feasible values given observed range sizes, that is, we randomized the range locations within a bounded domain, but not the range sizes. Simulation boundaries were the elevations of mountain summit (i.e. 3900 m in our study site) and sea level. Richness data were generated at 100-m increments of elevation, based on 1000 simulations sampled without replacement from empirical ranges (Colwell et al., 2004; McCain, 2004). Regressions of the empirical values on predicted values, provided r2
estimates to the fit of the null model. The Komogorov-Smirnov goodness of fit test was also applied to test the fit to the null model.
From these randomizations, we proceeded systematically from a formal statistical comparison of observed species richness patterns versus a mid-domain prediction, towards a quantitative characterization of what was responsible for the differences between the observed and predicted species richness. That is, we directly analyzed the empirical and simulated distributions of range endpoints and midpoints to understand how deviations between the observed and predicted species richness arose. This comparison indicates regions where there is a paucity or an accumulation of range endpoints or midpoints relative to the patterns expected under a mid-domain effect alone. Additionally, species range locations and sizes were jointly examined for each species.
RESULTS
BSR distribution in the elevatitonal gradient Ninety-two breeding bird species (listed in the Appendix) were recorded over the survey period. The minimum and maximum species richness at 144 sites was 6 and 42, respectively. Species richness estimators adjusted by Chao2 and Jack2 gave similar patterns along the elevational gradient. Therefore, we used the Chao2 estimator to evaluate the support for the mid-domain null model.
Generally, the observed species richness showed a hump-shaped pattern. However, the curve was asymmetrical, and thus differed from mid-domain predictions (Fig. 2). The weak fit to the
null model predictions was demonstrated by a low r2
value (0.242), although the hump-shaped pattern was statistically significant (p < 0.001). In addition, the Komogorov-Smirnov goodness of fit test indicated that the two distribution curves significantly differed (p < 0.001). Differences between observed species richness and that predicted by the mid-domain model revealed that the highest deviation, a positive residual, occurred in low-elevation areas (Fig. 3). Positive residuals declined sharply from sea level to about 300 m. Both positive and negative anomalies appeared between 300 and 800 m, followed by mostly negative values above 800 m.
Fig. 2. Observed breeding bird species richness (black dots) along an elevational gradient in northern Taiwan, plotted with predicted values (white dots) under the mid-domain model (y = -0.00x2 + 0.06x-3.56). Species richness was log-transformed. The observed values were weakly fitted to the null model (r2 = 0.242, p < 0.001).
0 1000 2000 3000 4000 Elevation (m) -1.0 -0.5 0.0 0.5 1.0 1.5 D e v ia ti o n o f n u m b e r o f s p e c ie s
Fig. 3. Deviations of observed breeding bird species richness from that predicted by the mid-domain model. The species richness was log-transformed.
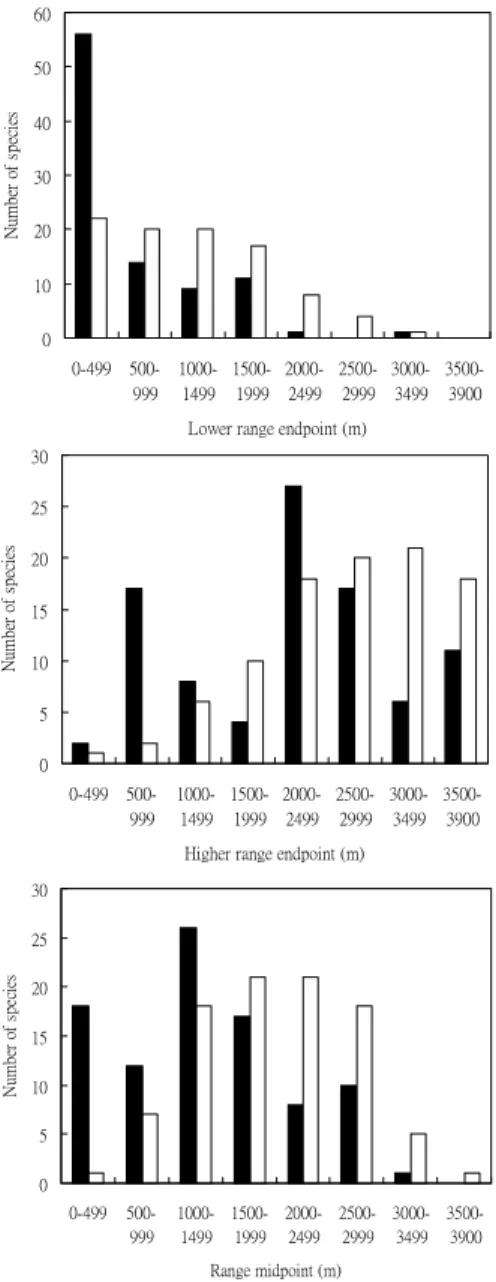
Bird elevational range endpoints and midpoints The largest discrepancy in the lower range endpoint distributions between the observed and the expected occurred at 0-499 m (Fig. 4A). More species than expected appeared in the foothills and low-elevation mountains. A comparison of higher range endpoint
distributions between observed and expected values showed that the largest excess appeared at 500-999 m (Fig. 4B). Another excess peak appeared at 2000-2499 m. In other words, more species than expected reached their upper extents at 500-999 m and 2000-2499 m. The observed midpoint distribution showed that the largest excess occurred at 0-499 m, compared to the expected distribution (Fig. 4C). Another apparent excess occurred at 1000-1499 m. A marked paucity in the observed and expected midpoint distributions existed at 2000-2999 m. Generally, positive and negative anomalies appeared below and above 1500 m, respectively. 0 5 10 15 20 25 30 0-499 500-999 1000-1499 1500-1999 2000-2499 2500-2999 3000-3499 3500-3900 Higher range endpoint (m)
Nu m ber o f sp eci es 0 10 20 30 40 50 60 0-499 500-999 1000-1499 1500-1999 2000-2499 2500-2999 3000-3499 3500-3900 Lower range endpoint (m)
N um ber o f sp eci es 0 5 10 15 20 25 30 0-499 500-999 1000-1499 1500-1999 2000-2499 2500-2999 3000-3499 3500-3900 Range midpoint (m) N umbe r of s pe cie s
Fig. 4. Observed distribution of range locations of 92 breeding bird species (black bars), and expected distribution based on the mid-domain model (white bars). A: lower range endpoints. B: higher range endpoints, and C: range midpoint along an elevational gradient in northern Taiwan.
Bird elevational range extents
Because the total elevational range extent of mountains in northern Taiwan is around 3900 m, we classified the species into 3 groups by their extent sizes: small-ranged (smaller than 1000 m, 22.8%, 21 sp.), medium-ranged (1000-1999 m, 45.7%, 42 sp.), and large-ranged species (≥ 2000 m, 31.5%, 29 sp.) (Fig. 5). A high percentage (90.5%, 19/21) of small-ranged species occurred entirely below 1000 m. In contrast, 62.1% (18/29) of large-ranged species extended from below 100 m to mid or high elevations. Compared to small- or large-ranged species, medium-ranged species occurred rather evenly from sea level to high elevations. The midpoints of most (85.7%, 18/21) of the small-ranged species were below 500 m. The midpoints of 65.5% (19/29) of large-ranged species were at 1000-1499 m, and those of 66.7% (28/42) of medium-ranged species were below 2000 m. 0 10 20 30 40 50 60 70 80 90 100 Rank of species 0 1000 2000 3000 4000 E le v a ti o n ( m )
Fig. 5. Elevational range extents and midpoints of species in northern Taiwan, ranked by the size of the range extent. Dashed lines with black dots, continuous lines with white dots, and continuous lines with black triangles represent range extents of small-ranged, medium-ranged, and large-ranged species, respectively.
DISCUSSION
Deviations of the BSR curve from the mid- domain effect
The BSR demonstrated a hump-shaped curve along an elevational gradient in northern Taiwan. This pattern is consistent with previous studies in Taiwan (Kano, 1940; Jai, 197; Shiu and Lee, 2003; Lee et al., 2004; Ding et al., 2005). Despite the significant correlation between observed species richness and that predicted by the mid-domain model, the correlation is weak and many discrepancies exist. Negative anomalies in species richness appeared in the elevational ranges greater than 300 m, while positive values principally occurred at 0-300 m. The greatest excess of the empirical lower range endpoints relative
To the expected lay in the same range (Fig. 4A). An evaluation of environmental factors may explain this discrepancy.
The temperature on Taiwan’s mountains generally decreases with elevation, with a lapse rate of -5.43 °C km-1 (Su, 1984a). Based on the
favorableness hypothesis (Terborgh, 1973; Brown, 1981), an increase in air temperature should increase the physiological performance and efficiency of a bird’s energy use and thus be more favorable for birds. Additionally, species in areas of higher temperature tend to have a shorter life span, and this may increase rates of speciation (Rohde, 1992). Collectively, BSR in Taiwan may be higher at lower elevations.
Primary productivity plays an important role in distribution of BSR in East Asia (Ding et al., in press). Productivity hypothesis states that species richness increases with productivity (see reviews of Rahbek, 1997). NDVI (normalized difference vegetation index), a surrogate for primary productivity (Box et al., 1989; Ustin et al., 1991), increase from low to mid elevations, followed by a decreasing trend from mid to high elevations in areas of northern Taiwan (Koh et al., in press). Therefore, BSR may have a hump-shaped curve along the elevational gradient in northern Taiwan.
As combining the favorableness hypothesis, the productivity hypothesis, and the mid-domain model, the BSR distribution in northern Taiwan will probably be an asymmetrical hump-shaped curve, which increases slowly from low to mid elevations and decreases more quickly from mid to high elevations. Our data suggest that the prediction of the favorableness hypothesis, the productivity hypothesis, and the mid-domain effect may need to be combined to yield a better fit to the empirical data.
Distributions of bird range endpoints and vegetation transitions
Comparisons of the empirical higher range endpoints to the expected revealed a great excess at 500-999 m (Fig. 4B). More species (17 species) than expected end their ranges at 500-999 m (Fig. 5). The distribution limitation for birds may be related to a transition of vegetation types in northern Taiwan. Koh and Lee (2003) investigated the patterns of breeding birds in northern Taiwan, and proposed that a low-elevational community was restricted to areas under 1000 m. Those authors argued that a bird community’s transition from low- to mid-elevation was consistent with a vegetation transition from the Machilus-Castanopsis zone to the
Quercus zone. The transition zone of Machilus-
Castanopsis to the Quercus in northern Taiwan
generally extends from 500 to 1200 m (Su, 1984b). Birds living in the Machilus-Castanopsis forests may gradually disappear in this range. The vegetation transition may explain why more species than expected end their range at 500-1499 m, especially 500-999 m. Therefore, species richness at 500-999 m is not consistently higher than those at 0-499 m, and contradicts the predictions of the mid-domain model. A secondary excess of higher range endpoints clustered at 2000-2499 m. Species range midpoints and extents revealed that 27 species reached their upper extents at 2000-2499 m (Fig. 5). Again, this may have been due to a vegetation transition from the
Quercus zone to the Tsuga-Picea zone (i.e.,
2000-2200 m, Su, 1984b). Jai (1977) also
demonstrated that a transition from a mid- (1000-2300 m) to a high- (above 2300 m) elevation bird community is consistent with the vegetation transition.
A cluster of the small-ranged species and the time hypothesis
Greatest excess in midpoints exist at 0-499 m, which is in accordance with a cluster of the small-ranged species (85.7%) in this range (Fig. 4C). The time hypothesis in which the biotic communities in the mid-elevation zone of Taiwan had relatively longer periods of existence during the Pleistocene glacial cycles (Lee et al., 2004) may offer a potential explanation for accumulations of small-ranged species below 500 m. Dramatic climatic fluctuations might have caused the biotic communities to shift up and down along the elevational gradient (Tsukada, 1967). Therefore, they might have had more opportunities to adapt to wider elevational ranges. By contrast, the biotic communities that adapted to the lower end of the elevational gradient might have been totally eliminated by the extreme climates during the Pleistocene glacial period. Thus, they might not have had a long history like mid-elevational communities and would have only been able to extend into smaller ranges. In our view, the cluster of midpoints of the small-ranged species below 500 m is congruent with the prediction of the time hypothesis.
For breeding birds in northern Taiwan, large and statistically significant differences exist between the observed species richness and those predicted by the mid-domain models. Therefore, BSR in northern Taiwan does not conform to the mid-model effect. Interestingly, the asymmetrical hump-shaped curve of BSR may come from a synthesis of the favorableness hypothesis, the productivity hypothesis, and the mid-domain effect.
Comparisons between observed and predicted spatial distributions of range endpoints and midpoints indicated a pattern of nonrandomness that was highly congruent with vegetation transitions along the elevational gradient. In addition, the nonrandomness below 500 m may be explained by the time hypothesis.
ACKNOWLEDGEMENTS
We thank M. L. Bai, I. C. Chen, I. J. Cheng, P. L. Huang, F. Y. Lin, and S. S. Shen for conducting the field survey. We also thank two anonymous referees for helpful comments on the manuscript. Funding for the bird survey was supported by the Council of Agriculture, Taiwan. The preparation of this paper was supported by Taiwan Forestry Research Institute, Taiwan.
LITERATURE CITED
Box, E. O., B. N. Holben and V. Kalb. 1989. Accuracy of the AVHRR vegetation index as a predictor of biomass, primary productivity and net CO2 flux. Vegetatio 80: 71-89.
Brown, J. H. 1981. Two decades of homage to Santa Rosalia: toward a general theory of diversity. Am. Zool. 21: 877-88.
Brown, J. H. 2001. Mammals on mountainsides: elevational patterns of diversity. Global Ecology and Biogeography 10: 101-109.
Colwell, R. K. and J. A. Coddington. 1994. Estimating terrestrial biodiversity through extrapolation. Philos. Trans. R. Soc. Lon., Ser. B. 345: 101-118.
Colwell R. K. and G. C. Hurtt. 1994. Nonbiological gradients in species richness and a spurious Rapoport effect. Am. Nat. 144: 570-95.
Colwell, R. K. and D. Lees. 2000. The mid-domain effect: geometric constraints on the geography of species richness. Trends. Ecol. & Evol. 15: 70-76. Colwell, R. K., C. Rahbek and N. J. Gotelli. 2004. The mid-domain effect and species richness patterns: what have we learned so far? Am. Nat. 163: E1-E23.
Ding, T.-S., H.-W. Yuan, S. Geng, Y.-S. Lin and P.-F. Lee. 2005. Energy, body size, and diversity in relation to bird species richness along an elevational in Taiwan. Global Ecology and Biogeography 14: 299-306.
Ding, T.-S., H.-W. Yuan, S. Geng, C.-N. Koh, and P.-F. Lee. 2006. Macro-scale bird species richness patterns of the East Asian mainland and islands: Energy, area and isolation. J. Biogeogr. 33: (in press)
Jai, P. 1977. Study in ecological isolation of birds in Taiwan. Master Thesis, Tunghai University, Taichung, Taiwan. 73pp. (In Chinese)
Kano, T. 1940. Zoological studies of the Tsugitaka Mountains of Formosa. Tokyo: The Shibusawa Institute for Ethnographical Researches. 145pp. Koh, C.-N. and P.-F. Lee. 2003. Elevational gradients
in breeding birds in northern Taiwan. Taiwan J. For. Sci. 18: 349-361. (In Chinese, English summary)
Koh, C.-N., P.-F. Lee and R.-S. Lin. 2006. Bird species richness patterns of northern Taiwan: primary productivity, human population density, and habitat heterogeneity. Diversity & Distributions 12: (in press).
Lee, P.-F., T.-S. Ding, F.-H. Hsu and S. Geng. 2004. Breeding bird species richness in Taiwan: distribution on gradients of elevation, primary productivity and urbanization. J. Biogeogr. 31: 307-314.
Lomolino, M. V. 2001. Elevation gradients of species-density: historical and prospective views. Global Ecology and Biogeography 10: 3-13. McCain, C. M. 2004. The mid-domain effect applied to
elevational gradients: species richness of small mammals in Costa Rica. J. Biogeogr. 31: 19-31. Monroe, B. L. and C. G. Sibley. 1993. A world
checklist of birds. New Haven: Yale University Press, New Haven, USA. 393pp.
Rahbek, C. 1995. The elevational gradient of species richness: a uniform pattern? Ecography 18: 200-205.
Rahbek, C. 1997. The relationship among area, elevation, and regional species richness in neotropical birds. Am. Nat. 149: 875-902.
Reynolds, R. T., J. M. Scott and R. A. Nussbaum. 1980. A variable circular-plot method for estimating bird numbers. Condor 82: 309-313. Rohde, K. 1992. Latitudinal gradients in species
diversity: the search for the primary cause. Oikos 65: 514-527.
Rosenzweig, M. L. 1995. Species diversity in space and time. Cambridge: Cambridge University Press, Cambridge, UK. 436pp.
Shiu, H.-J. and P.-F. Lee. 2003. Seasonal variation of bird species richness along elevational gradients in subtropical Taiwan. Acta Zoologica Taiwanica 14: 1-21.
Stevens, G. C. 1992. The elevational gradient in altitudinal range: an extension of Rapoport's latitudinal rule to altitude. Am. Nat. 140: 893-911. Su, H.-J. 1984a. Studies on the climate and vegetation
types of the natural forests in Taiwan (I): analysis of the variation in climatic factors. Q. J. Chin. For. 17: 1-14.
Su, H.-J. 1984b. Studies on the climate and vegetation types of the natural forests in Taiwan (II): altitudinal vegetation zones in relation to temperature gradient. Q. J. Chin. For. 17: 57-73. Su, H.-J. 1992. Vegetation of Taiwan: mountainous
vegetation zone and geological climatic zone. Taipei, Taiwan: Institute of Botany, Academia Sinica Monograph Series No. 11: 39-53.
Terborgh, J. 1973. On the notion of favourableness in plant ecology. Am. Nat. 107: 481-501.
Tsukada, M. 1967. Vegetation in subtropical Formosa during the Pleistocene and the Holocene. Paleogeography, Paleoclimatology, Paleoecology 3: 49-64.
Ustin, S. L., B. Wessman, B. Curtiss, E. Lasischke, J. Way and V. C. Vanderbilt. 1991. Opportunities for using the EOS imaging spectrometers and synthetic aperture radar in ecological models. Ecology 72: 1934-1945.
Wang, S. 1980. Topographic landscape of Taiwan. Vacation Publications, Taipei, Taiwan. 256pp. (In Chinese)
Zapata, F. A., K. J. Gaston and S. L. Chowns. 2003. Mid-domain models of species richness gradients: assumptions, methods and evidence. J. Anim. Ecol. 72: 677-690.
Appendix 1. Lowest elevations, highest elevations, midpoints, and elevational ranges of species of terrestrial breeding birds surveyed in northern Taiwan from 2001 to 2003. Scientific names of species follow Monroe and Sibley (1993).
Species Lowest elevation (m) Highest elevation (m) Midpoint (m) Elevational range (m)
Family Accipitridae 鷲鷹科 Accipiter virgatus 松雀鷹 0 2100 1050 2100 Accipiter trivirgatus 鳳頭蒼鷹 50 2000 1025 1950 Spilornis cheela 大冠鷲 0 2000 1000 2000 Family Phasianidae 雉科 Arborophila crudigularis 深山竹雞 50 2100 1075 2050 Bambusicola thoracica 竹雞 0 2000 1000 2000 Syrmaticus mikado 帝雉 1700 3000 2350 1300 Family Turnicidae 三趾鶉科 Turnix suscitator 棕三趾鶉 0 500 250 250 Family Columbidae 鳩鴿科 Chalcophaps indica 翠翼鳩 0 620 310 620 Columba pulchricollis 灰林鴿 700 2300 1500 1600 Treron sieboldii 綠鳩 0 2100 1050 2100 Streptopelia chinensis 斑頸鳩 0 900 450 900 Streptopelia orientalis 金背鳩 0 1100 550 1100 Streptopelia tranquebarica 紅鳩 0 500 250 500 Family Cuculidae 杜鵑科 Cuculus saturatus 筒鳥 0 3300 1650 3300 Cuculus sparverioides 鷹鵑 700 2200 1450 1500 Family Centropidae 鴉鵑科 Centropus bengalensis 番鵑 0 800 400 800 Family Strigidae 鴟鴞科 Glaucidium brodiei 鵂鶹 300 2100 1200 1800 Family Megalaimidae 鬚鴷科 Megalaima oorti 五色鳥 0 1700 850 1700 Family Picidae 啄木鳥科 Dendrocopos canicapillus 小啄木 0 2100 1050 2100 Dendrocopos leucotos 大赤啄木 700 2400 1550 1700 Picus canus 綠啄木 900 2800 1850 1900 Family Alaudidae 雲雀科 Alauda gulgula 小雲雀 0 800 400 800 Family Pycnonotidae 鵯科 Hypsipetes leucocephalus 紅嘴黑鵯 0 1600 800 1600 Pycnonotus sinensis 白頭翁 0 1200 600 1200 Spizixos semitorques 白環鸚嘴鵯 50 1300 675 1250 Family Laniidae 伯勞科 Lanius schach 棕背伯勞 0 300 150 300 Family Certhiidae 旋木雀科 Subfamily Troglodytinae 鷦鷯亞科 Troglodytes troglodytes 鷦鷯 2150 3700 2925 1550
Appendix 1. (Continued) Family Muscicapidae 鶲科 Subfamily Turdinae 鶇亞科 Brachypteryx montana 小翼鶇 1100 2900 2000 1800 Cinclidium leucurum 白尾鴝 300 2500 1400 2200 Tarsiger johnstoniae 栗背林鴝 1700 3700 2700 2000 Tarsiger indicus 白眉林鴝 1600 3400 2500 1800 Myiophoneus insularis 紫嘯鶇 50 1950 1000 1900 Turdus Poliocephalus 白頭鶇 1000 2000 1500 1000 Family Sylviidae 鶯科 Subfamily Sylviinae 鶯亞科 Actinodura morrisoniana 紋翼畫眉 1450 2800 2125 1350 Alcippe brunnea 頭烏線 0 2000 1000 2000 Alcippe cinereiceps 灰頭花翼 1600 3300 2450 1700 Alcippe morrisonia 繡眼畫眉 0 2600 1300 2600 Garrulax albogularis 白喉笑鶇 1100 2000 1550 900 Garrulax poecilorhynchus 竹鳥 50 2100 1075 2050 Garrulax canorus 畫眉 0 850 425 850 Garrulax morrisonianus 金翼白眉 1600 3700 2650 2100 Heterophasia auricularis 白耳畫眉 600 2600 1600 2000 Liocichla steerii 藪鳥 700 2700 1700 2000 Pnoepyga pusilla 鱗胸鷦鷯 1400 2800 2100 1400 Pomatorhinus erythrocnemis 大彎嘴畫眉 0 2200 1100 2200 Pomatorhinus ruficollis 小彎嘴畫眉 0 2100 1050 2100 Stachyris ruficeps 山紅頭 0 2800 1400 2800 Yuhina brunneiceps 冠羽畫眉 700 2800 1750 2100 Yuhina zantholeuca 綠畫眉 0 2000 1000 2000 Abroscopus albogularis 棕面鶯 150 2450 1300 2300 Bradypterus alishanensis 褐色叢樹鶯 1300 3500 2400 2200 Cettia acanthizoides 深山鶯 1700 3500 2600 1800 Cettia fortipes 小鶯 300 2500 1400 2200 Cisticola exilis 黃頭扇尾鶯 0 300 150 300 Cisticola juncidis 棕扇尾鶯 0 828 414 828 Prinia flaviventris 灰頭鷦鶯 0 800 400 800 Prinia criniger 斑紋鷦鶯 0 2200 1100 2200 Prinia inornata 褐頭鷦鶯 0 800 400 800 Paradoxornis webbianus 粉紅鸚嘴 0 2400 1200 2400 Subfamily Muscicapinae 鶲亞科 Ficedula hyperythra 黃胸青鶲 700 2500 1600 1800 Muscicapa ferruginea 紅尾鶲 1000 2800 1900 1800 Niltava vivida 黃腹琉璃 300 2150 1225 1850 Family Regulidae 戴菊科 Regulus goodfellowi 火冠戴菊鳥 1900 3500 2700 1600 Family Aegithalidae 長尾山雀科 Aegithalos concinnus 紅頭山雀 700 2700 1700 2000 Family Paridae 山雀科 Parus ater 煤山雀 1400 3700 2550 2300 Parus holsti 黃山雀 950 2100 1525 1150 Parus monticolus 青背山雀 800 2700 1750 1900 Parus varius 赤腹山雀 200 1600 900 1400 Family Sittidae 鳾科 Sitta europaea 茶腹鳾 1400 2900 2150 1500 Family Nectariniidae 吸蜜鳥科 Dicaeum concolor 綠啄花鳥 200 900 550 700 Dicaeum ignipectus 紅胸啄花鳥 700 2500 1600 1800 Family Zosteropidae 繡眼科 Zosterops japonica 綠繡眼 0 1200 600 1200 Family Fringillidae 雀科 Carpodacus vinaceus 朱雀 1900 3700 2800 1800 Pyrrhula erythaca 灰鷽 1950 3500 2725 1550 Pyrrhula nipalensis 褐鷽 950 2150 1550 1200
Appendix 1. (Continued) Family Passeridae 文鳥科 Subfamily Passerinae 文鳥亞科 Lonchura punctulata 斑文鳥 0 500 250 500 Lonchura striata 白腰文鳥 0 1100 550 1100 Passer montanus 麻雀 0 500 250 500 Subfamily Prunellinae 岩鷚亞科 Prunella collaris 岩鷚 3000 3700 3350 700 Subfamily Motacillidae 鶺鴒亞科 Motacilla alba 白鶺鴒 0 1110 555 1110 Family Sturnidae 椋鳥科 Acridotheres cristatellus 八哥 0 500 250 500 Family Corvidae 鴉科 Subfamily Corvinae 鴉亞科 Corvus macrorhynchos 巨嘴鴉 0 3500 1750 3500 Dendrocitta formosae 樹鵲 0 1300 650 1300 Garrulus glandarius 松鴉 500 2100 1300 1600 Nucifraga caryocatactes 星鴉 1600 3300 2450 1700 Oriolus traillii 朱鸝 100 600 350 500 Pericrocotus solaris 紅山椒 50 2200 1125 2150 Urocissa caerulea 台灣藍鵲 0 900 450 900 Subfamily Dicrurinae 卷尾亞科 Dicrurus aeneus 小卷尾 50 2000 1025 1950 Dicrurus macrocercus 大卷尾 0 700 350 700 Hypothymis azurea 黑枕藍鶲 0 1300 650 1300