Low-Voltage Cathodoluminescence Properties of the Y
2O
2S:Eu
Red Light Emitting Phosphor Screen
in Field-Emission Environments
C. L. Lo,aJ. G. Duh,a,zand B. S. Chioub aDepartment of Materials Science and Engineering, National Tsing Hua University, Hsinchu, Taiwan bDepartment of Electronics Engineering, National Chiao Tung University, Hsinchu, Taiwan
Y2O2S:Eu phosphors doped with different concentrations of Eu were fabricated by a high-temperature flux fusion method. For applications in field emission displays, phosphor powders were electrophoretically deposited on an indium-tin oxide coated glass substrate to form a phosphor screen. Cathodoluminescence properties of phosphor screens were examined at a low excitation voltage of 5 kV in a high-vacuum chamber (5⫻ 10⫺8Torr), and characteristics of Y2O2S:Eu phosphors, including brightness and wavelength data, are presented and discussed. The red emission brightness for the Y2O2S:Eu phosphor screens can be significantly improved by adjustment of the Eu additions, which decrease the x coordinate slightly, while having no significant influence on the color performance. Considering the effects of Eu concentrations on red light emission spectra and brightness for Y2O2S:Eu phosphor screens, it is found that brightness for Y2O2S:Eu phosphor screens could be obtained up to 120 cd/m2with chromaticity of x⫽ 0.63 and y ⫽ 0.36, and the Eu dopant concentration is suggested to be in the range 6-7.5 wt %.
© 2002 The Electrochemical Society. 关DOI: 10.1149/1.1482770兴 All rights reserved.
Manuscript submitted October 2, 2001; revised manuscript received January 22, 2002. Available electronically May 16, 2002.
Due to its outstanding features such as wide viewing angle, en-ergy efficiency, large temperature range of operation, and compact size, the field emission display 共FED兲 is believed to have a high potential for flat panel display applications.1-3 The materials and technology utilized in FEDs are close to those of cathode ray tubes
共CRTs兲. The basic structure of FEDs is to put fluorescent phosphors
and microtip field emitters on two separate plates. Emitting electrons are attracted from the microtips through a high electric field on the backplate. Visible light is generated from a phosphor screen on the other end by using high-voltage accelerated electronic impact.
Yttrium oxysulfide doped with europium (Y2O2S:Eu) has sharper emission lines, leading to better colorimetric definition and higher cathodoluminescence 共CL兲 efficiency than the other red phosphors.4,5Therefore, Y2O2S:Eu is a basic phosphor material that could be used in anode screens for FED devices. It is known that the shape and size of phosphor particles are critical in the fabrication of high-quality screens. Reducing the particle size gives a higher resolution.6-9Optimizing the particle size distribution will lead to a higher packing density for phosphor layers, and thus higher resolu-tion can be achieved. Spherical particles also give a high packing density and a small light-scattering coefficient.10,11 Moreover, the final quality of the information display in a view of phosphors can be determined by the brightness of phosphor screens. Consequently, not only the intrinsic properties of phosphor powders but also the optical characteristics of the phosphor screens should be taken into account to obtain a good anode plate for FED applications. In our previous study,12the uniform particle size distribution and sphere-like Y2O2S:Eu phosphor powders were successfully fabricated by the high-temperature flux fusion method. Those results indicated that the as-fabricated Y2O2S:Eu phosphors are suitable for applica-tion of the screening process in FED devices. Moreover, to estimate the validity of as-fabricated Y2O2S:Eu phosphor powders for FED applications, samples of Y2O2S:Eu red powders were prepared by a high-temperature flux fusion method and electrophoretically depos-ited on an indium-tin oxide共ITO兲 coated glass substrate to form a phosphor screen. A series of CL measurements were examined under excitation voltage of 5 kV in a high-vacuum chamber (⬃5
⫻ 10⫺8Torr). In this study, the spectral and optical properties of Y2O2S:Eu phosphor screens were evaluated. Furthermore, the ef-fects of Eu additive contents on the emission color shifting and
brightness for Y2O2S:Eu red phosphor screens were investigated to optimize the performance of red phosphor screens for FED applica-tions.
Experimental
Y2O2S:Eu powders were prepared by the sulfide-fusion method. Appropriate amounts of Y2O3and Eu2O3were mixed with the flux, containing S, Na2CO3, K2CO3, Li2CO3, and Li3PO4, and then fired at high temperature in the range 1000-1200°C to undergo a solid-melt reaction. The atmosphere in the heating tube was con-trolled to be oxygen-free during firing. After the firing process, pow-ders were washed with water to remove the residual flux and flux by-products and then etched with 5% HNO3 solution for a clean, smooth particle surface. The detailed process to fabricate the Y2O2S:Eu phosphor powders was reported elsewhere.12,13The con-centrations of Eu in Y2O2S of as-derived powders were evaluated by inductively coupled plasma 共ICP, GVM-1000P, Shimadzu, Ja-pan兲. In order to determine the optimum Eu additive content in Y2O2S:Eu compositions to optimize the performance of phosphor screens for FED applications, the concentrations of Eu in Y2O2S phosphors were controlled in the range 4-9 wt %. The mean particle size of the as-fabricated phosphor powders used in the screen pro-cess was measured as 3m.
The phase and crystal structure of the synthesized phosphors were analyzed with a X-ray diffractometer共D/MAX-B, Rigaku, Ja-pan兲 with a wavelength of Cu K␣ ( ⫽ 1.5406 Å). The scanning rate was 2/min.
To derive a phosphor screen, Y2O2S:Eu phosphor powders were coated onto the ITO glass substrate by an electrophoretic deposition method. Electrophoretic deposition is a materials processing tech-nique in which particles suspended in liquid are deposited onto a substrate under the influence of an applied electric field.14,15 Phos-phor powders were first suspended in isopropyl alcohol共IPA兲 which contained dissolved magnesium nitride. ITO glass anode and copper plate cathodes were assembled at 10 mm distance apart in the cell. The voltage of the electrode connecting with the dc power supply was 150 kV.
In the CL measurement system, the electron-beam was generated and accelerated by an electron gun, and focused on the phosphor screens with a certain spot size. Y2O2S:Eu phosphor screens were operated in the chamber at a pressure under 5⫻ 10⫺8Torr and excited by an electron-beam with controlled accelerating voltage共5 kV兲 and emission current (0.5 A/cm2). The CL emitting light passed through a lens to focus on an optical fiber and the emission zE-mail: [email protected]
Journal of The Electrochemical Society, 149共7兲 H129-H133 共2002兲
0013-4651/2002/149共7兲/H129/5/$7.00 © The Electrochemical Society, Inc.
spectrum was recorded by Fourier transfer analysis共Nicolet MX-1, Acton Research Corp.兲, with the detecting range 360-830 nm. The measurement temperature was kept at room temperature. Moreover, the CIE共Commission International de l’Eclairage兲 color coordinates and brightness of emitting light for Y2O2S:Eu phosphor screens were determined with a Chroma Meter 共Minolta CS-100, Japan兲. Five measurements were carried out and luminance data were averaged.
Results and Discussion
It is noted that Y2O2S is hexagonal crystal structure and the lattice parameter is defined as a⫽ 0.37 and c ⫽ 0.65 nm. In this study, the Eu activator was doped into yttrium oxysulfide. Figure 1 is the X-ray diffraction共XRD兲 patterns of phosphors with different Eu addition in starting materials derived under the same fabrication process. All the XRD lines observed in Y2O2S:Eu phosphor with different Eu concentration matched the lines given in JCPDS data files. According to XRD patterns the as-fabricated phosphors were well crystallized. It seems that the addition of dopant activator as Eu would not affect the growth and phase transformation of Y2O2S phase, which is the host phosphor.
Moreover, from the plane space dhkldata of the peaks in Fig. 1 and the overall plane index, the lattice parameters of unit cell for Y2O2S:Eu crystalline can be obtained by calculation as follows. The host phase of Y2O2S:Eu is a hexagonal unit cell characterized by
two variable parameters, a and c. The plane-spacing equation for a hexagonal system is 1 dhkl 2 ⫽ 4 3
冉
h2⫹ hk ⫹ k2 a2冊
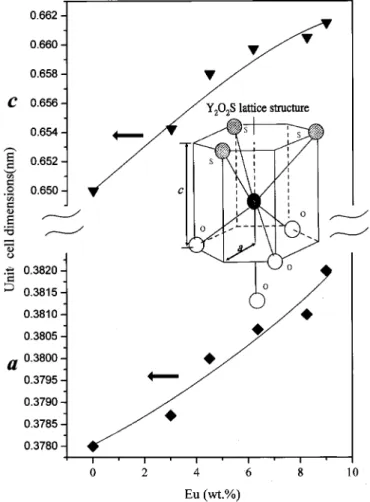
⫹ l2 c2 关1兴The lines in Fig. 1 are designated as line 1 to line 16, in which the four highest intensity lines are designated to be 2, 3, 5, and 6. One can obtain the unit cell parameters a and c for each sample doped different concentration of Eu2O3, as shown in Fig. 2. It ap-pears that unit cell parameters for Y2O2S hexagonal crystalline are slightly enlarged with the increasing amounts of Eu2O3addition in Y2O2S:Eu phosphor. Considering the crystalline structure of Y2O2S, it contains a group of three oxygen ions and a group of three sulfurs. Yttrium is in the central site on the C3axis and the other single oxygen is on the other side of the C3axis, being slightly apart from the base plane. Thus, Y-S and Y-O bond length are approxi-mately 0.29 and 0.223 nm. From crystallographic study,16it is found that the additional Eu ions are expected to occupy the yttrium ion sites. Because the radius of Eu ion共0.113 nm兲 is slightly larger than that of yttrium ion 共0.106 nm兲, the lattice parameters would be somewhat enlarged when the Eu ions occupy the site of yttrium ions. Thus, the more Eu dopant into the Y2O2S:Eu phosphor, the larger the unit cell parameters.
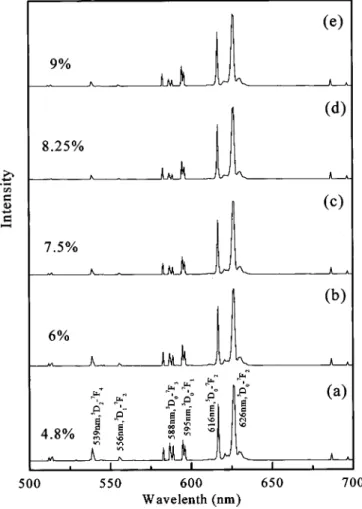
The basic CL properties of a Y2O2S:Eu phosphor screen were analyzed in a high vacuum chamber (5⫻ 10⫺8Torr) with an elec-tron gun to obtain the information. The CL spectra in the wavelength range between 500 and 630 nm for phosphor screens with different Eu activator concentrations are given in Fig. 3. Obviously, the emis-sion spectra of Eu3⫹activated Y2O2S:Eu phosphor screens shows
Figure 1. The XRD patterns of Y2O2S:Eu phosphors with different concen-trations of Eu.
Figure 2. The relationship of lattice parameters with respect to Eu
concen-trations in Y2O2S:Eu phosphors. Journal of The Electrochemical Society, 149共7兲 H129-H133 共2002兲
three different regions peaking at 539, 556, and 626, indicating ex-cited states5D2共bluish-green light emitting兲,
5
D1共greenish-orange light emitting兲, and 5D
0 共red light emitting兲, respectively. All the emission lines for Y2O2S:Eu phosphors are very well addressed in literature.17,18Typically, the red color emitting of Y2O2S:Eu is due to the transition from5D
0→7Fjof Eu3⫹, in which the wavelength of 626 nm shows the strongest intensity. On the other hand, the short wavelength lines共i.e., 5D0→ 7F2and 5D1→7F4 transition兲 were disadvantages in view of the location of the CIE color coordinates for red color phosphor application. Figure 4 shows the intensity ratio of the5D0→ 7F2共626 nm兲 line to5D1→ 7F2共556 nm兲 line. Figure 5 indicates the intensity ratio of the 5D0→ 7F2 共626 nm兲 line to 5
D2→ 7F4 共539 nm兲 line with 5 kV accelerating voltage and 0.5A/cm2 emission current applied. Results indicate that the in-tensity of the short wavelengths such as 539 nm (5D2→
7 F4) and 556 nm (5D
1→7F2) are relatively degraded with the Eu concen-trations. Accordingly, as the Eu dopant concentration is raised, the relative intensity for 626-556 or 539 nm is also increased. This indicates that the luminescence light emitted from Y2O2S:Eu phos-phors containing enriched Eu tends to become red. With the increase of Eu concentration, the emission in the short-wavelength region
共blue and green region兲 disappears completely. Moreover, the color
shifting of the emission light could be identified more definitely with the aid of CIE color coordinates. Figure 6 shows a curve represent-ing both the x and y value of CIE coordinates vs. the Eu dopant concentrations in Y2O2S:Eu phosphor. By addition of various con-centrations of Eu activators in the Y2O2S:Eu red phosphor, the x values in CIE coordinates show a linear dependence with respect to the Eu concentration. Generally speaking, for x⬎ 0.625, the color
is red in viewing, while for x⬍ 0.625, it is reddish orange. The color of emitting light shifts from reddish orange to red with the increase of Eu activator concentration, as presented in Fig. 6. This is another evidence that the relative intensity of the main transition from5D0to7F2provides the red-emitting light. Besides, the inten-sity of other spectra peaks becomes smaller as the Eu dopant centration increases. This results in the red color for high Eu con-centration phosphor.
Not only emission color but also brightness is one of the impor-tant CL properties for phosphor screens. Brightness also depends on the activator concentration. Figure 7 shows the dependence of CL brightness of Y2O2S:Eu phosphor screens on the Eu dopant concen-trations. It is apparent that the relative brightness degrades substan-tially with increasing Eu dopant concentrations. The Y2O2S:Eu phosphors containing 7.5 wt % Eu exhibit more than twice the brightness (90 cd/m2) of those with 9 wt % (35 cd/m2). Similarly, Y2O2S:Eu phosphors with 6 wt % Eu activator show nearly four times brightness (120 cd/m2) than those with 9 wt % Eu activator. According to the spectra analysis, the brightness of Y2O2S:Eu phos-phor is mainly contributed by the intensity of wavelength at 626 nm, corresponding to the electron transition from the state5D
0to 7F2. Figure 8 illustrates the relationship between the intensity of the 626 nm (5D
0→7F2) line in the CL spectra diagram and the Eu dopant concentration of Y2O2S:Eu red phosphor. The relative intensity of wavelength of 626 nm also depends on the Eu concentration in Y2O2S:Eu phosphor. By combining the color coordinates shift with Eu addition and brightness dependence on Eu concentration, a
rela-Figure 3. CL spectra of Y2O2S:Eu phosphors with various Eu activator concentrations:共a兲 4.8, 共b兲 6, 共c兲 7.5, 共d兲 8.25, and 共e兲 9%.
Figure 4. Intensity ratio of5D
0→ 7F 2 共626 nm兲 to 5D 1→ 7F 4 共556 nm兲 line as a function of Eu concentration.
Figure 5. Intensity ratio of5D
0→7F2共626 nm兲 to5D2→7F4共539 nm兲 as a function of Eu concentration.
Figure 6. 共a兲 x and 共b兲 y coordinate of Y2O2S:Eu as a function of Eu concentration.
Figure 7. The relative brightness as a function of Eu concentration in the
Y2O2S:Eu phosphor.
Journal of The Electrochemical Society, 149共7兲 H129-H133 共2002兲
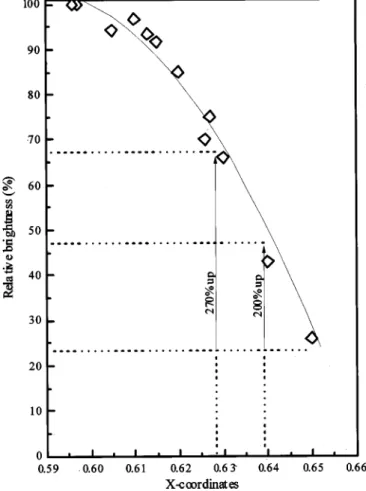
tionship curve between brightness and color coordinates is attained in Fig. 9. It shows a similar tendency as those in Fig. 7 and 8, in which brightness degrades as the, x value increases共increasing Eu concentration兲. The CL emitting light of a larger x coordinate shows the lower brightness.
It can be noted that the greater tendency for the emission light to turn red, the lower the relative brightness that is observed, i.e., the brightness of 0.63 in CIE coordinate is 270% up from that of x
⫽ 0.65 in CIE coordinates, and the brightness of x ⫽ 0.64 in CIE
coordinate is 200% up from that of x⫽ 0.65 CIE coordinate. For application of Y2O2S:Eu red phosphor in FEDs, the availability of color shift is, in fact, an advantage. According to the current mea-surement, the emission brightness for the Y2O2S:Eu phosphor screen can be significantly enhanced by reducing the addition con-centration of Eu activator, which decreases the x coordinate slightly and would not affect the color shift. In fact, the color shift from x
⫽ 0.655 to x ⫽ 0.63 is not easily resolved by the naked eye.
There-fore, to achieve sufficient brightness (⬃120 cd/m2) in Y2O2S:Eu phosphor screens, Eu dopant concentration is suggested to be in the range 6-7.5 wt %.
Conclusions
Through CL measurement in a high-vacuum chamber with a ac-celeration voltages of 5 kV, the feasibility of Y2O2S:Eu phosphors for FED applications was presented. The brightness of red light emission for Y2O2S:Eu phosphor screens was significantly im-proved by reducing the doping concentrations of Eu activator in Y2O2S:Eu phosphor. The performance of phosphor screens was op-timized based on the brightness and the CIE color coordinate of the emitting light. With the red light emitting in CIE color coordinates
共x ⫽ 0.63 and y ⫽ 0.36兲, the brightness of the phosphor screen for
Y2O2S:Eu doped with 6 wt % Eu activator exhibited four times higher than those doped with 9 wt % Eu activator. The CL bright-ness of the electrophoretically deposited Y2O2S:Eu phosphor screens at low voltage in a high vacuum of 5⫻ 10⫺8 was up to 120 cd/m2.
National Tsing Hua University assisted in meeting the publication costs of this article.
References
1. H. Kominami, T. Nakamura, Y. Nakanishi, and Y. Hatanaka, Jpn. J. Appl. Phys., Part 2, 35, L1600共1996兲.
2. H. S. Uh, S. J. Kwon, and J. D. Lee, J. Vac. Sci. Technol. B, 15, 472共1997兲. 3. Y. Sohda, D. M. Tanenbaum, S. W. Turner, and H. G. Craighead, J. Vac. Sci.
Technol. B, 15, 343共1997兲.
4. M. R. Royce, U.S. Pat. 3,418,245共1968兲. 5. P. N. Yocom, U.S. Pat. 3,418,247共1968兲. 6. L. H. Brixner, Mater. Chem. Phys., 16, 253共1987兲. 7. K. Ohno and T. Abe, J. Electrochem. Soc., 141, 1252共1994兲. 8. K. Urabe, Jpn. J. Appl. Phys., 19, 885共1980兲.
9. K. Urabe, Jpn. J. Appl. Phys., 20, 28共1981兲.
10. Y. Uehara, K. Nakayama, T. Asano, and H. Matsukiyo, Abstract 556, p. 875, The Electrochemical Society Extended Abstracts, Vol. 94-2, Miami Beach, FL, Oct 9-14, 1994.
11. Japanese Patent Disclosure: 4-45192共1992兲.
12. C. L. Lo, J. G. Duh, B. S. Chiou, C. C. Pang, and L. Ozawa, Mater. Chem. Phys.,
71, 179共2001兲.
13. L. Ozawa, Application of Cathodoluminescence to Display Devices, p. 280, Kodan-sha, Ltd., Tokyo共1994兲.
14. M. J. Shane, J. B. Talbot, B. G. Kinney, E. Slugky, and K. R. Hesse, J. Colloid Interface Sci., 165, 334共1994兲.
15. B. S. Jeon, J. S. Yoo, and J. D. Lee, J. Electrochem. Soc., 143, 12共1996兲. 16. O. J. Sovers and T. Yoshioka, J. Mater. Sci., 27, 2887共1992兲.
17. O. J. Sovers and T. Yoshioka, J. Chem. Phys., 49, 4945共1968兲.
18. R. G. Pappalardo and R. B. Huguenin, J. Electrochem. Soc., 132, 721共1985兲. Figure 8. Relative intensity of 626 nm line in CL spectra as a function of Eu
concentration.
Figure 9. The relationship between the relative brightness and x coordinates
of CIE for the Y2O2S:Eu phosphor.