行政院國家科學委員會專題研究計畫 成果報告
法人董監事制度與財務績效
研究成果報告(精簡版)
計 畫 類 別 : 個別型 計 畫 編 號 : NSC 99-2410-H-004-071- 執 行 期 間 : 99 年 08 月 01 日至 100 年 10 月 31 日 執 行 單 位 : 國立政治大學會計學系 計 畫 主 持 人 : 林宛瑩 共 同 主 持 人 : 林美花 計畫參與人員: 碩士班研究生-兼任助理人員:詹佳霖 碩士班研究生-兼任助理人員:葉添得 報 告 附 件 : 出席國際會議研究心得報告及發表論文 處 理 方 式 : 本計畫可公開查詢中 華 民 國 100 年 10 月 31 日
法人董監與公司績效
Board Representatives of Juristic Persons and Firm Performance
(國科會期末結案簡式報告)
林宛瑩 國立政治大學會計學系 林美花 國立政治大學會計學系 本版:2011年7月31日法人董監與公司績效 摘 要 不同於一般從法律學理探討法人董監制度之研究,本文實證分析法人董監組成特 性對公司績效(TobinQ)的影響。法人董監制度僅見於少數國家,制度之原意在方 便政府對公股的管理、鼓勵法人投資及維護法人股東的合法權利。但我國公司法 准許法人股東可以有數名代表出任董事,與自然人股東僅能擔任一席董事,有所 不同,有違公平原則,易造成董事會被同一集團所控制,而法人背後之實質經營 者可隨時更換其代表人,亦破壞公司內部監控之設計。因此,准許法人董事之設 置對公司績效之利弊得失,實為一值得探討之實證議題。本研究之主要實證結果 顯示,是否設置法人董監或法人董監席次與以市場基礎衡量之公司績效(TobinQ) 並無顯著關係存在,但一旦將法人董監組成按其所代表之機構加以分類後,研究 結果即顯示,集團企業法人董監與公司績效成顯著負向關係,但官股法人董事則 與 TobinQ 呈正向關係。另以會計基礎衡量之公司經營績效(ROA)進行分析之結 果發現,有無設置法人董監、法人董監、集團企業法人董監、官股監察人席次比
率均與ROA 呈顯著負相關。ROA 與 TobinQ 分析結果不同之處在於,官股法人董
事雖與 ROA 呈正相關,惟未達顯著水準。本文之實證分析結果說明,投資人在
認知上較為肯定董事會有官股代表之公司,因而有較佳之 TobinQ;但官股代表
對於實質之經營績效未必有所助益。本研究對集團企業法人董監之分析結果與代 理理論一致,但與資源依賴理論之預期相反。
Board Representatives of Juristic Persons and Financial Performance
Abstract
Most extant studies in Taiwan discussed issues of board representatives of juristic persons from a legal viewpoint. Limited research has yet provided empirical evidence. This study empirically investigates the association of board representatives of juristic persons acting as shareholders and Tobin’s q (TobinQ) of a company. Taiwan is one of the very few countries in the world which allow representatives of a juristic person to be a director or supervisor of the board. The origin of such system was due to the concern for a company’s shares held by the government. Only by allowing a government agency to sit on the board, can it monitor operations of companies. This system, however, is then applied to shares held by juristic persons. Proponents suggest that such system protects the right of a juristic person investor and will thus accordingly encourage its investments. Opponents pinpoint that not only the system is not fair to individual shareholders, it may also result in the company can be easily controlled by a business group and weaken the internal control and monitoring system. Thus, whether it is advantageous to allow a juristic person acting as shareholder to designate representatives to sit on the corporate board is an empirical issue.
The primary empirical findings of this study indicate that a significantly negative (positive) association exits between board representatives from business group (government agency) and TobinQ, which is consistent with the expectation of the agency theory. Our primary findings are enhanced by various empirical specifications and sensitivity tests. The analysis of additional tests indicates that the primary findings hold when using ROA as an alternative performance measure with an exception that the positive effect of government agency board representatives on performance becomes insignificant. This research also documents a linear relationship between board-composition variables of interest and TobinQ, and a firm-complexity effect on the board composition-TobinQ association. The difference in role of board representatives by government agency found between TobinQ and ROA suggests that having government agency board representatives is appreciated by the investors although it does not have impact on the operating performance.
Keywords: board representative of juristic persons, ownership structure, board
1 壹、前言 本研究探討論法人董監對公司財務績效之影響。對投資法人而言,法人董事 制度有利於鼓勵法人投資,維護法人股東的合法權利。對小股東而言,自然人董 事之言行由個人負責,如為法人董事,若代表人及其背後法人之責任關係未定, 容易導致責任無法清楚釐清。對董事會之主事者而言,法人董事制度具有穩定或 控制經營權之作用。但在實務上,法人董監制度之可能缺點包括董事會財團化、 董事會無以發揮監督管理功能等治理問題。法人董事制度之優缺點對公司經營績 效之影響,有待實證研究加以探討。我國公司法第 27 條有公司董事可為法人之 規定,此與世界上其他多數國家規定公司董事必須為自然人有很大的差異,學術 及實務對此一作法探討不乏,但多從法律層面討論,本研究則以董監事為研究主 體,討論法人董監對公司財務績效之影響。 若法律上對法人董監制度無適當之配套,未詳實規範法人董事及其代表人間 之權利義務關係,容易產生諸多問題,例如我國現行制度最為人詬病,且與其他 國家不同之處,在於我國公司法第 27 條准許同一法人機構可以有數位代表同時 當選為董事及監察人,有失公平原則,董事會的功能難以發揮;尤其當董事及監 察人屬於同一企業集團時,更可能輕易掏空公司資產。此外,財團或企業往往將 法人董監職位作為酬庸,這些人可能是公司的職員,沒有足夠的經營決策能力, 而實質上仍由財團控制,可藉以規避集團責任,且法人董監之代表人得依其職務 關係,隨時改派代表人補足原任期。此一規定給予法人董監幕後的實際控制者極 大的權力,只要派任的代表不執行其意志,就可以隨時撤換代表。企業也可能因 主事者的決策不當更換其法人董監代表,影響公司經營權的穩定性。1 國內實務及學術界咸認為,公司法第 27 條在實務上產生董事會財團化、妨 礙獨立董事的聘任、董事會無以發揮監督管理功能等治理問題,容易成為不良企 業遂行私利的工具。公司治理相關研究較少探討法人董監之經濟影響,但隨著企 業弊案的發生,尤其是 2006 年爆發的力霸弊案,更彰顯出法人董監可能隱含的 1 2007 年,展茂發生資金週轉困難,原董事長余宗澤為解決資金缺口問題,引進新的經營團隊 簡宏志等人。但余宗澤在移轉其名下所持有展茂法人股東的股份給簡宏志後,簡宏志卻未依約 引進資金,反以法人股東身份進入董事會,以五張展茂股票奪下董事會主導權,改派全部董監 事,導致展茂經營權發生異動。由此例可知,法人股東及董事的角色對企業經營的穩定性,有 其影響力。
2 公司治理問題,而再度引起公眾的重視。本研究之主要目的即在探討法人董監在 公司治理上之角色,以及其對公司績效之影響。 法人董監制度各有其優、缺點,實決定於董事會之功能與效能。代理理論認 為,董事會之功能旨在監督,董事會獨立性及與股東利益之連結強度決定監督誘 因,進而影響經營績效。資源依賴理論則主張,董事會之主要功能在資源提供而 不在監督,董事會資本決定董事會效能,直接影響經營績效。本研究從代理理論 與資源依賴理論觀點分析,實證探討法人董監之選任對公司經營績效之影響,究 竟會因法人董監擁有較佳的資源提供功能而對經營績效有所提升,抑或因財團化、 獨立性差與內部控制不佳等因素,導致法人董監缺乏監督誘因而對經營績效不利。 具體而言,本文從財務及會計層面而非法律層面,探討法人董監制度之經濟後 果。 本論文在法人董監制度(尤其是由集團企業出任法人董事)對公司經營績效 有負面影響的實證發現,是國內首篇提供法人董監制度之經濟影響的學術論文。 本文有二點實證分析結果顯示,值得說明。其一,我們發現,是否設置法人董監 或法人董監席次與以市場基礎衡量之公司績效(TobinQ)並無顯著關係存在,但一 旦將法人董監組成按其所代表之機構加以分類後,研究結果即顯示,集團企業法 人董監與公司績效成顯著負向關係,但官股法人董事則與 TobinQ 呈正向關係。 此結果或可說明,法人董監制度之立法原意本在方便監督政府轉投資之事業,官 股法人董事應有助於公司績效。但是,此制度為民間企業援用,反而成為董事會 集團化之工具,可能因此弱化了董事會的監督與管理功能,對公司績效有不利之 影響。此項結果說明,探討董事會效能之相關研究,需要考慮法人董監組成因素, 以便有更深入的了解。 其二,我們另以會計基礎衡量之公司經營績效(ROA)進行分析,結果發現, 有無設置法人董監、法人董監及集團企業法人董監之席次比率均與 ROA 呈顯著 負相關。ROA 與 TobinQ 分析結果不同之處在於,官股法人董事雖與 ROA 呈負 相關,惟未達顯著水準;而官股監察人則與 ROA 有顯著負向關聯性。這個分析 結果說明,投資人在認知上較為肯定董事會有官股代表之公司,因而有較佳之市 場經營績效 TobinQ;但官股代表對於會計經營績效未必有所助益。預期本研究 分析法人董監制度對經營績效影響之結果,除可對法人董監制度之利弊得失提出
3 較明確的實證證據,並供學術研究參考外,亦可提供主管機關作為未來公司法條 文修正之參考。 貳、相關文獻探討與研究假說發展 實施允許法人可以和自然人一樣擔任董事制度的已發展國家屬於少數,故在 國外學術文獻上對法人董監制度之探討相對較少;國內則因資料蒐集與整理耗時 費力,相關研究亦不多見。董事會為公司運作之核心,董事會效能是健全公司治 理的四大基石之一(Hermanson and Rittenberg 2003; Prawitt, Smith and Wood
2009),攸關公司的表現(Zahra and Pearce, 1989)。由於法人董監制度本質上屬
於董事會組成與效能議題,因此,本研究從公司治理董事會功能之角度提供文獻 之討論,並作為發展假說之基礎。 國內探討公司治理機制與公司績效之文獻,多從股權結構與董事會結構分析, 部分研究發現,經理人持股比率與生產力無關(Wang 2003),但與資產報酬率呈 顯著正向關係(劉韻僖 2006);家族或關係企業持股比率與現金增資之股票報酬 率無關(邱垂昌等 2007),但最終控制者持股比率與生產力有顯著正向關聯性 (Wang 2003)。此外,獨立董監席次比率與資產報酬率有正向關係(劉韻僖 2006)。 國外針對公司治理中董事會運作效能之相關研究,主要從代理理論與資源依 賴理論提出不同的觀點。代理理論認為,董事會的主要職責在代替股東監督經營 管理者,透過有效監督來降低代理成本,進而提昇公司價值。代理理論主張,監 督的效能來自監督誘因,當監督誘因與股東利益連結一致時,會有較佳的監督效 能與績效表現(Jensen and Meckling 1976; Fama 1980)。從代理理論觀點探討的 研究,大多以董事會的獨立性與權益性酬勞作為監督誘因的代理變數,並預期獨 立性較高的董事會,監督誘因較強,監督效能較佳,公司績效較好(Daily and Dalton 2001; Daily 1995)。
代理理論觀點具體表現在 90 年代探討董事會組成之文獻,多集中探討董事 會組成之獨立性議題(如 Yermack 1996; Bhagat and Black 2002),並形成外部獨
立董事愈多,董事會獨立性愈高,公司治理模式較佳之一般認知。2 但代理理論 2 董事會獨立性對董事會效能的可能影響,則包括獨立性高的董事會經營績效較佳、較會解聘不 適任之經理人、會制訂較為合理的高階經理人獎酬政策、較不會與出具保留意見或繼續經營疑
4
對監督誘因與經營績效間存在正向關聯性的研究預期,並未獲得實證研究一致的 支持(Dalton, Daily, Certo, and Roengpitya 2003; Dalton, Daily, Ellstrand, and
Johnson 1998),部分研究發現,董事會獨立性愈高(獨立董事席次比率愈高),
公司績效愈佳(Cotter, Shivdasani, and Zenner 1997; Byard, Li, and Weintrop 2006), 或兩者間並不存在顯著的關聯性(Yermack 1996; Bhagat and Black 2002)。
國內文獻指出,國內特有之法人董監制度易產生董事會集團化、董事會無以 發揮監督管理功能等治理問題(林國全 1996,2002;黃虹霞 2000;黃銘傑 2007)。 因為准許法人董監的設立,造成台灣公司常以設置子公司來回頭持有母公司股權 或以人頭公司名義出任法人董監或法人代表人董監事(本文合稱法人董監),取 得公司控制權,有礙內部監控功能的發揮。研究發現,內部控制較差之公司,其 績效較差(Tang and Xu, 2007)。而在目前法人代表董事制度下,由於法人有隨 時改換其代表人之改派權,故法人董監代表勢必執行法人之意志,無法以自己之 意志迅速回應各項問題與提出因應策略,其決策制訂或執行效率較低。此外,亦 造成董事依賴(board dependence),即董事的酬勞依賴於法人背後的主事者,以致 於無法真正監督公司的經營。若法人董監制度之弊端多於其優點,則由法人代表 出任董事會席次愈多之公司,因監督及經營誘因的不足,以及內部監控功能與決 策效率的減弱,將使其財務績效較差(侍台誠 1994)。在公司出事,依公司法追 究法人董監責任時,反而讓背後的法人卸除應負的責任。 由於法人董監制度之原意在協助政府監督投資之事業,後為民間企業所援用, 但卻可能導致集團化及不具獨立性等弊端。在代理理論架構中,其他條件不變下, 法人董監制度之優劣,決定於董監之監督誘因強弱及內部控制的良窳,並進而決 定公司經營績效之好壞。從代理理論觀點分析,集團企業法人董監有礙董事會之 獨立性,且存在董事依賴,監督誘因不佳,將對企業經營績效不利。基於前述文 獻,代理理論預期集團企業法人董監對經營績效有負向的影響,形成對立假說: H1:公司由其集團企業法人出任董監之席次比率與其公司績效間存在負向 關聯性。 但從董事會功能在提供資源,其效能決定於董事會資本之資源依賴理論觀點 慮意見的會計師解除委任關係等。
5
來看,則因法人股東可同時有數位代表出任董監,具有較大的董事會資本,具備 較豐沛的人力資本與關係資本條件,由其支持之法人代表出任董監會較具不同能 力,協助公司自外部取得關鍵資源與外部網絡關係(Lee, Rosenstein and Wyatt 1999; Hillman and Dalziel 2003),亦應有助於經營績效的提升(Daily and Dalton 1994; Hillman, Keim, and Luce 2001 )。投資人認為公司董事與官方關係良好,可 以經由政府的力量敦促較公開的資訊提供與溝通,也對政府有潛在的影響力,有 助於降低企業外部不確定因素對公司的影響。 参、實證模式與與實證結果 一、實證模式 本文以 OLS 實證迴歸模型(1)探討法人董監制度與財務績效的關聯性: t i, l9 8 k it, k 7 1 j i,t j 0 t i, α α Jpdir CV ε TobinQ (1) 其中,TobinQ 為市場基礎衡量之公司績效、 Jpdir 代表法人董監組成特性變數, 以及CV 代表公司治理與公司特性相關之控制變數。 本研究主要解釋變數為法人董監特性變數(Jpdir ),包含法人董監之組成結 構及股權結構變數。本研究參考 TEJ 將法人定義為:政府機構、金融機構、信 託基金、公司法人,以及其他法人,但不包括機構投資人。法人董監相關變數之 定義及衡量方式說明如下。 1. 法人董監組成特性變數( Jpdir ) 本研究將法人董監席次、身份等有關變數稱為法人董監組成變數(Jpdir): (1) 是否有法人董事(JB_dmy):若董事由法人代表出任則為 1,否則為 0; (2) 法人董、監席次比率(JB_seat、JS_seat):法人董事(監察人)席次佔 董事(監察人)總席次之百分比; (3) 官股法人董、監席次比率(GB_seat、GS_seat):官股法人代表董事(監 察人)席次佔董事(監察人)總席次之百分比;3及 3 法人董監制度之原意在協助政府監督投資之事業,且投資人認為公司董事與官方關係良好,可
6 (4) 集團企業法人代表董、監席次比率(JBgp_seat、JSgp_seat):集團企業法 人代表董事(監察人)席次佔董事(監察人)總席次之百分比。 2. 控制變數 (CV) 本研究納入公司治理及公司特性二類控制變數。公司治理相關變數參考相關 文獻(例如 Boyd 1995;Wang 2003;劉韻僖 2006),納入控制股東盈餘分配權 (Cfright)、董事長是否同時出任總經理同一人(Dual)、董事會規模(Bsize)、 董事會獨立性(Indbseat)4等變數(Boyd 1995);公司特性變數則參考相關研究 (例
如 Coles, Daniel and Naveen 2008;許崇源、陳昭蓉 2008;Bhattacharya and Graham
2009),納入公司規模(Size)、負債比率( Lev )、營收成長率(Salesgw)、資本密度
(Cap_intn)、研發密度(Rdsales)、員工紅利(Bonus)等公司財務特性作為變數。 二、實證結果 本研究蒐集 1997 至 2008 年所有上市(櫃)公司,經剔除金融相關產業、非 曆年制公司、公司財務特性變數遺漏與公司治理變數遺漏的資料後,總觀察值為 9,204 筆。本研究之主要財務變數資料來源取自 TEJ 資料庫,法人董監相關資料 則整理自公開資訊觀測站及 TEJ 董監事資料庫。 主要實證結果顯示,設置法人董事及法人董事席次比率均與公司績效無顯著 負向關係,但進一步區分法人董監身份之分析發現,集團企業法人董事與監察人 對公司績效有負向的影響,但官股法人董事與公司績效則呈正向關係。集團法人 董事與監察人之結果與代理理論的觀點一致,即我國法人董監制度的存在削弱公 司內部監控機制,且可能存在董事依賴,不能獨立運作,對公司績效產生負向影 響。換言之,我國集團企業法人董事的存在並不如資源依賴理論所預期:法人董 事較具較豐沛的人力資本及關係資本,而使公司產生較佳的績效。但官股法人董 事之分析結果則與 Hillman, Zardkoohi, and Bierman (1999)之研究結果相符。 Hillman et al. (1999)發現,當公司董事與官方有關係之人士出任時,投資人會對 出任公司給予較佳的市場評價。 以經由政府的力量敦促較公開的資訊提供與溝通,也對政府有潛在的影響力,有助於降低企業 外部不確定因素對公司的影響。因此,本研究將法人董監分為集團企業及官股之法人董監。 4 國內企業尚未普遍設置審計委員會,故本研究未將審計委員會之設置納入考量。但公司董事會 之功能能否發揮,與董事會之獨立性與高階經理人之影響力(power)有關,故除考量董事長是 否兼任總經理,亦納入董事會獨立性變數。
7 本研究另進行三項額外測試:(1)以會計基礎衡量之資產報酬率(ROA)作 為公司績效,針對法人董監組成特性進行額外的測試;(2)分析主要解釋變數與 TobinQ 是否存在線性關係;以及(3)企業複雜度對法人董監席次與 TobinQ 關 聯性之調節效果。 額外測試結果顯示,官股法人董監之角色在公司績效係以ROA 或 TobinQ 衡 量時,有所不同。官股董事與TobinQ 有顯著正向關係,但與 ROA 不存在關聯性, 官股監察人與TobinQ 無關聯性,但與 ROA 呈顯著負向關係。此項結果可能表示, 市場參與者認知上對有官股出任董事之公司較為肯定,因而給予較佳之評價,但 官股法人董事對ROA 之影響,則不存在統計上之顯著關聯性。線性關係之測試 結果顯示本研究所採變數與TobinQ 為線性關係。 至於企業複雜度對法人董監席次與TobinQ 關聯性之影響,測試結果顯示, 法人董監之席次比率與公司TobinQ 為負向關係,但此一關係受到公司複雜度的 影響,即公司複雜度高,法人董事席次比率較高,公司績效較好。複雜度對集團 企業法人董監與TobinQ 的負向關聯性或官股法人董監與績效的正向關聯性,均 有減緩的效果,惟其調節效果並不顯著。複雜度對集團企業法人董事與TobinQ 間負向關係的調節效果,與 Coles et al. (2008)報導公司複雜度可以減緩董事會規 模對績效之負向影響有類似的研究發現。 肆、結論與建議 觀察國內上市公司之董事會,有些以法人代表為董事,有些則以自然人為董 事,法人代表較多的公司與法人代表較少的公司,在經營績效上是否存在差異, 是個值得探討的議題。本文針對官股法人董監、集團企業法人董監等受到公眾關 心之議題,探討法人董監特性對公司績效(以 TobinQ 為代理變數)之影響。 本研究之主要實證結果顯示,在未區分法人董監組成前,相對於未以法人代 表為董事之公司,以法人代表出任董事或法人董監席次比率較高,其公司績效未 顯著較差。此外,官股法人董事席次比率與 TobinQ 呈現正向關係,此似乎不違 當初之立法原旨;而集團企業法人董監席次比率與 TobinQ 呈負向的關係,隱喻 法人董監制度對企業經營之弊端可能多於優點。額外測試結果顯示,法人董監特 性變數與公司績效存在線性關係。而改採資產報酬率(ROA)衡量績效並不影 響集團企業法人董監之主要實證結果,但設置法人董監、法人董監席次比率均轉
8 為顯著負相關。此外,集團法人董事與 TobinQ 之關聯性並未受到公司複雜度的 調節效果所影響。 本研究針對集團企業法人董監之分析結果與代理理論一致,但與資源依賴理 論之預期相反,即集團企業法人董監的存在削弱公司內部監控機制,且可能因較 不具獨立性,而與公司績效呈負向關係。官股法人董事雖與TobinQ 呈正向關係, 但與ROA 呈負向關係,此說明,官股股東對於財務績效並無實質的助益,但投 資大眾可能認為有官股投資會對股東權益提供較大的保障。換言之,若從會計基 礎衡量之公司績效觀點探討,我國法人董事的存在,並不能使公司產生較佳的經 營績效。 在 2006 年證交法修正通過,在董事、監察人責任日益加重之下,我國現行 法人董監制度是否仍合時宜,值得檢討。因此,未來修正公司法第 27 條之 1 時, 或可考慮兩種作法,一是強化與落實對法人董監與其代表人責任之規範;二是廢 除法人董監制度,學者建議董事、監察人皆由自然人以個人名義出任;而且在可 領董監酬勞之下,負起對股東之注意與忠實義務。改由自然人直接擔任董監,應 可提升公司的治理功能。未來研究可針對由法人董事改由自然人擔任之公司,探 討董事組成變動對公司績效的影響。此外,本研究發現官股董事之角色符合資源 依賴理論之預期,未來研究可針對官股角色作進一步之探討。
1
出席國際學術會議心得報告
計畫編號 NSC99-2410-H-004-071 計畫名稱 法人董監與經營績效 出國人員姓名 服務機關及職稱 林宛瑩 國立政治大學會計學系 副教授 會議時間地點 2011/8/6-2011/8/10 DENVER, CO, USA會議名稱 2011 AMERICAN ACCOUNTING ASSOCIATION ANNUAL MEETING
發表論文題目 The Exogenous Issue of Feature Extraction
一、參加會議經過
我於08/07/2011 週日晚上到達 Denver,於 08/08/2011-10/08/2011 會議期間至會 場聆聽Opening Plenary Session 及每日之 Plenary Session 與當日多篇論文之發表, 包括IFRS Implementations & adoptions issues、Internal control issues、Voluntary disclosure、Performance、Corporate social responsibilities、Real Earnings management、 Audit quality、Forensic accounting、Forensic cases 等場次之討論與多篇論文發表; 並於08/10/2011 上午之 Strategic and Emerging Technologies Concurrent Sessions
發表論文。於08/12/2011 凌晨離開 Denver,於 08/13/2011 抵達桃園機場。本人
所發表之論文參見後附之附件。
二、與會心得
Plenary Session 邀請了不少會計學各領域之知名學者參與座談及演講,各場次論
文發表亦使本人受益良多。本人所發表之論文,蒙與會學者Professor Nehmer
(Oakland University)、Professor Jonas (Case Western Reserve University)及實務專
家(包括KPMG 會計師事務所管理顧問公司之顧問)提供多項建議,修正後論
2
The Exogenous Issue of Feature Extraction
Abstract:
This study sets up an experiment of applying Growing Hierarchical Self-Organizing Map (GHSOM) to fraudulent financial reporting (FFR) samples of Taiwan to explore the exogenous issue of feature extraction. Specifically, based upon certain significant input variables derived from the FFR literature and some statistical tool, FFR samples are classified into several small-sized leaf nodes of GHSOM. Then, for each leaf node of GHSOM, this study uncovers common fraudulent techniques from corresponding FFR indictments and sentences (exogenous information) of clustered samples without referring to the attributes of input variables. With acknowledging that different leaf nodes have distinctive common fraudulent techniques, the study confirms that GHSOM can provide implicitly a relationship between common fraud techniques (an exogenous variable) and input variables. The study also demonstrates the abilities of GHSOM to (1) extract features from exogenous information that are more abundant and more informative than input variables and (2) classify exogenous variables in terms of input variables.
Keywords: Growing Hierarchical Self-Organizing Map; Feature Extraction; Artificial
3
THE EXOGENOUS ISSUE OF FEATURE EXTRACTION
Fraudulent Financial Reporting (FFR), or financial statement fraud, involves the intentional misstatement or omission of material information from an organization’s financial reports (Beasley et al. 1999). Although with the lowest frequency, FFR casts a severe financial impact with median losses of $2 million per scheme (ACFE 2008). These are cases that often have severe consequences in terms of not only significant risks for stockholders and creditors but also financial crises for the capital market.However, the following extant literature review reveals that prior FFR-related research focused on the nature or the prediction of FFR and that there is no in-depth study that explores FFR features – the delicate but hidden truths regarding FFR – extracted from very large quantities of FFR data through tools of artificial intelligence (AI). The nature-related FFR research often uses the case study approach and
provides a descriptive analysis of the characteristics of FFR and techniques
commonly used. For instance, the Committee of Sponsoring Organizations (COSO) and the Association of Certified Fraud Examiners (ACFE) regularly publish their own analysis on fraudulent financial reporting of U.S. companies. Based on the FFR samples, COSO examines and summarizes certain key company and management characteristics. ACFE analyzes the nature of occupational fraud schemes and provides suggestions to create adequate internal control mechanisms. Table 1 summarizes the research methodology and findings in nature-related FFR studies.
<Insert Table 1 here>
Other FFR researches often apply the empirical approach to archival data and identify significant variables that help predict the occurrence of fraudulent reporting. Such research emphasizes the predictability of the model used. For example, logistic regression and neural networks techniques are used in this line of research (Bell and Carcello 2000; Fanning and Cogger 1998; Kirkos et al. 2007; Persons 1995;
Virdhagriswaran and Dakin 2006). Table 2 summarizes the research methodology and findings of prediction-related FFR studies.
4
On the other hand, AI techniques play an important role in accomplishing the task of financial fraud detection (FFD) that involves distinguishing fraudulent financial data from authentic data, disclosing fraudulent behavior or activities, and enabling decision makers to develop appropriate strategies to decrease the impact of fraud (Ngai et al. 2010). One of popular AI techniques is Self-Organizing Map (SOM) proposed by Kohonen (1982), a Neural Networks tool that conducts an unsupervised learning to produce a low-dimensional view of high-dimensional data. SOM has been applied to FFD scenarios such as credit card, automobile insurance and corporate fraud (Séverin 2010; Ngai et al. 2010). There are several weaknesses of SOM, however. For instance, its size (and thus topology) needs to be predefined and fixed and it is unable to provide hierarchical relations amongst samples.
Growing Hierarchical Self-Organizing Map (GHSOM) proposed in (Dittenbach et al. 2000; Rauber et al. 2002) addresses the issue of fixed network architecture of SOM through developing the multilayer hierarchical network structure, in which, as shown in Figure 1, each layer contains a number of SOMs. The training process of GHSOM can be summarized in the following four phases (Dittenbach et al. 2000):
(1) Initialize the layer 0 and the layer 1: SOM of layer 0 consists of only a single node (group) whose weight vector is initialized as the expected value of all imported samples. Then the mean quantization error (MQE) of layer 0 (MQE0) is
calculated. Hereafter, MQE of a node denotes the mean quantization error that averages the deviation between the node’s weight vector and every imported sample clustered into the node. SOM of layer 1 initially has four nodes each of whose weight vectors is initialized randomly. Then apply the following three phases to the SOM of layer 1 and SOMs of its subsequent layers.
(2) Train every individual SOM: Within the training process of an individual SOM, the sample is imported one by one. The distances between the imported sample and the weight vectors of all nodes are calculated. The node with the shortest distance is selected as the winner. Under the competitive learning principle, only the winner and its neighboring nodes are qualified to adjust their weight vectors. Repeat the competition and the training until the learning rate decreases to a certain value.
5
(3) Grow horizontally each individual SOM: Each individual SOM will grow until the mean value of MQEs of all nodes on the SOM (MQEm) is smaller than the
MQE of the parent node (MQEp) multiplied by τ1. That is, the criterion for the
stoppage of growth is MQEm < τ1 × MQEp. If the stopping criterion is not
satisfied, identify the error node that owns the largest MQE and then, as shown in Figure 2, insert one row or one column of new nodes between the error node and its dissimilar neighbor.
(4) Expand or terminate the hierarchical structure: After the horizontal growth phase of individual SOM, MQE of each node (MQEi) is compared with the value of
MQE0 multiplied by τ2. The node with an MQEi less than τ2 × MQE0 will
become a leaf node that does not own a subsequent layer of SOM. The node with an MQEi greater than τ2 × MQE0 will develop a subsequent layer of SOM that
initially has four nodes each of whose weight vectors is initialized randomly. In this way, the hierarchy grows until all leaf nodes satisfy the stopping criterion MQEi < τ2 × MQE0.
<Insert Figure 1 here> <Insert Figure 2 here>
There are several GHSOM applications in information extraction and text mining (Schweighofer et al. 2001; Shih et al. 2008; Soriano-Asensi et al. 2008). These applications show that GHSOM is a useful tool to extract relevant features from the vast amount of information or data.
Theoretically, there are several benefits when applying GHSOM to extracting features. First, with the unsupervised learning nature, there are no predefined categories into which samples are to be classified; rather, the GHSOM system will develop its own feature representation of the sample with a competitive learning algorithm. Second, GHSOM classifies the sample into tons of small-sized leaf nodes (subgroups) with hierarchical relationship such that further and more delicate analyses are feasible. Third, due to a competitive learning nature GHSOM works as a
regularity detector that is supposed to discover statistically salient features of the sample population (Rumelhart and Zipser 1985). That is, extracted features in different leaf nodes are distinctive.
6
To investigate the exogenous feature extraction, which is promising but
unexplored, the study sets up an experiment of applying GHSOM to FFR samples of Taiwan. Specifically, there are three objectives of the study: First, based upon certain significant input variables derived from the FFR literature and some statistical tool, FFR samples are classified into several small-sized leaf nodes of GHSOM.Second, unlike the traditional approaches that interpret the outcome of a model via its input variables, this study uncovers FFR features from the fraud samples clustered in each leaf node without referring to the attributes of input variables. Suppose the FFR feature that we are interested in is the common fraudulent techniques used by the fraud samples. Therefore, for each leaf node, the regularity of fraudulent techniques is uncovered from indictments and sentences issued by the Department of Justice
without referring to the attributes of input variables. Such way of uncovering common fraudulent techniques can avoid the predicament of financial-number manipulations in financial statement frauds. Third, and the most important one, we want to examine whether different leaf nodes have distinctive common fraudulent techniques of FFR. Since common fraudulent techniques are extracted from corresponding FFR
indictments and sentences that are concluded from more information than the values of derived variables, it is arguable whether GHSOM can obtain the corresponding relation between common fraud techniques and derived variables. With
acknowledging that different leaf nodes have distinctive common fraudulent techniques, the study confirms that GHSOM can provide implicitly a relationship between common fraud techniques and input variables.
The remainder of this paper is organized as follows. Section two reports the data preprocessing with the discriminant analysis. Section three presents the sample and the outcomes of GHSOM. Section four provides the extracted common fraud
techniques of three leaf nodes. The last section concludes with a summary of findings, implications, and suggestions for future works.
Data preprocessing Sample for data preprocessing
7
The following sources were used to identify the fraud sample: indictments and sentences for major securities crimes issued by the Securities and Futures Bureau of the Financial Supervisory Commission, class action litigation cases initiated by Securities and Futures Investors Protection Center, and the law and regulations retrieving system of the Judicial Yuan in Taiwan. If a company’s financial statement for a specific year is confirmed to be fraudulent by indictments and sentences for major securities crimes issued by the Department of Justice, it is classified into our fraud observations, as to that company’s financial statements free from fraud allegations they are classified into our non-fraud observations.
The matched-sample design is used to form a sample composite of 116 publicly traded companies, including 58 fraud and 58 non-fraud ones between the years of 1992 to 2006. For each fraud firm, we match a non-fraud firm based on industry, total assets, and year. For each fraud company, we first identified the earliest year in which financial statement fraud was committed. The sample periods cover two years before and two years after the year of the event. That is, five consecutive annual financial statements were used in our study. The final observations used in the study consisted of 580 firm-year observations, i.e., 580 annual financial statements were examined in the research.
For the 58 fraud firms, 113 annual financial statements were confirmed to have committed financial report fraud (henceforth fraud samples) and 177 annual financial statements were free of allegations of such fraud (henceforth non-fraud samples). As to the 58 non-fraud firms, 290 non-fraud samples were included. In brief, our final research samples were comprised of 113 fraud samples and 467 non-fraud samples. The composite ratio of fraud samples to non-fraud samples was 113:467. On average, approximately two fraudulent financial statements (1.95 = 113/58) were included for each fraud firm. It is worth noting that of the 113 fraud samples, there are 78
fraudulent financial statements and 35 restated financial statements. The firms that provided the 35 restated statements were the ones that survived financial scandals and whose restated statements were in compliance with government regulations. The restated financial statements can be perceived as reflecting the firms’ true financial positions that lead to the occurrences of the fraudulent financial reporting behavior.
8
Such mixture of data mimics the environment of information in the real world which prevails with both true and false data.
Variable measurement and discriminant analysis
Based upon FFR literature, 25 explanatory variables are selected and
incorporated into the discriminant analysis. Table 3 summarizes the definition and measurement of these variables. These are measurement proxies for attributes of profitability, liquidity, operating ability, financial structure, cash flow ability,
financial difficulty, and corporate governance of a firm. These explanatory variables are collected from the Taiwan Economic Journal (TEJ) database.
<Insert Table 3 here>
We first test the multi-collinearity issue between explanatory variables. The unreported results indicate that GRITGS should be excluded. As a result, 24 independent variables are incorporated in the Canonical Discriminant Analysis as shown in model (1). DBCBSCFR DBCRCFR SMLSR SPR Score -Z CFRR CFAR CFR LFTFA DR ITTA ARTTA GRARTGS GROI GROAR TAT ART QR CR GRONI GRONS ROA OPR GPM RAUD F 24 23 22 21 20 19 18 17 16 15 14 13 12 11 10 9 8 7 6 5 4 3 2 1 (1)
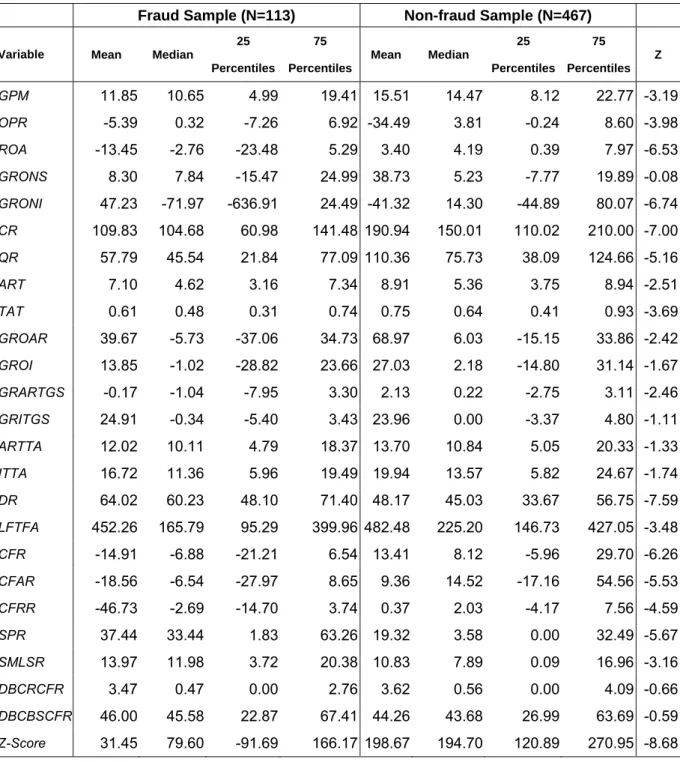
Table 4 shows the descriptive statistics of the variables, including the mean, median, 25 percentiles and 75 percentiles. Column Z means one result of non-parametric test. Except GRONS, GRITGS, DBCRCFR, DBCBSCFR, other variables do have different statistical features between the fraud and non-fraud samples.
<Insert Table 4 here>
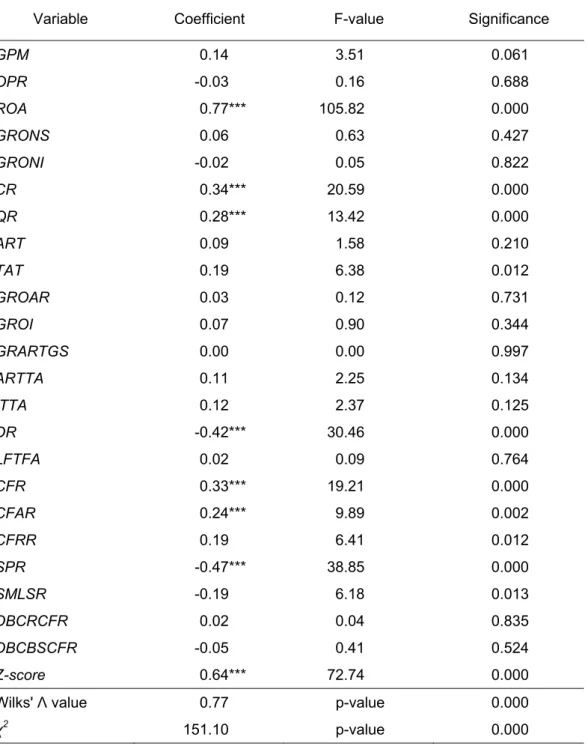
Table 5 shows the empirical results of the discriminant analysis and shows that the Wilks' Λ value equals 0.766 and x2 equals 151.095 (both significant at p-value < 0.01),
which indicates that the discriminant model employed has adequate explanatory power. Table 5 indicates that eight variables, ROA, CR, QR, DR, CFR, CFAR, Z-Score and SPR, have statistically significant effects. As shown in Table 3, these eight variables proxy a company’s attributes from the aspects of profitability (ROA), liquidity (CR and QR), financial structure (DR), cash flow ability (CFR and CFAR), financial difficulty (Z-Score), and corporate governance (SPR).
9 <Insert Table 5 here>
Sample and Growing Hierarchical Self Organizing Map
These eight variables chosen from discriminant analysis were collected for our 113 fraud samples and used as the training data for GHSOM. To have the prevention of overly clustering fraud samples, we set up the following predefined selection criteria to pick a suitable GHSOM:
(1) There is more than one layer of SOM in the GHSOM.
(2) Samples of each mapping should not be overly clustered into any one of child nodes.
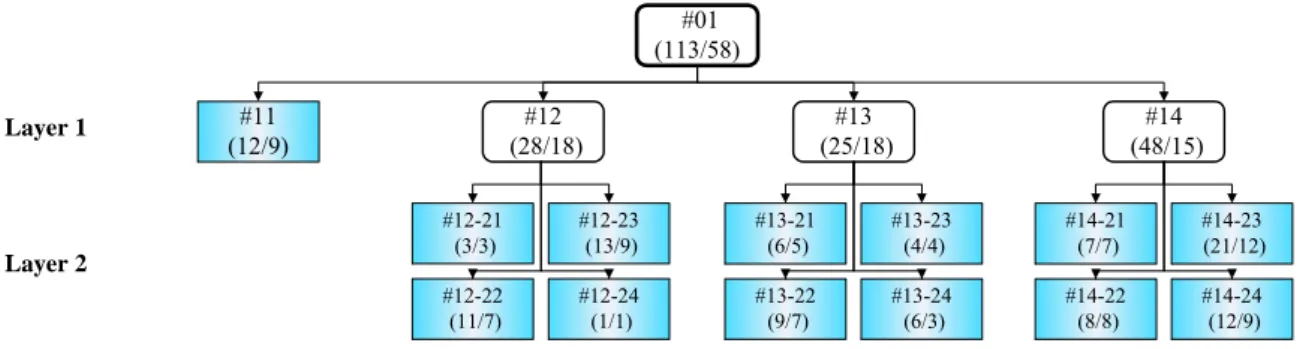
Figure 3 shows the sample distribution of the obtained GHSOM (with τ1 being 0.8
and τ2 0.07), in which leaf nodes are marked in taint. In each node, there is a name
given according to its layer number and its node order in the same SOM as well as its parent’s name. For instance, the node #13-24 is node number 4 in layer 2 developed from the node number 3 of layer 1. In each node, the numbers within the parenthesis indicate the number of fraudulent financial statements and the number of (fraud) firms.
<Insert Figure 3 here>
Common Fraudulent Techniques
To refer to fraudulent techniques that are generally accepted, here the ten fraudulent techniques from (Beasley et al. 1999) are used. That is, there are three basic types of fraudulent techniques: Improper Revenue Recognition, Overstatement of Assets, and Others. Improper Revenue Recognition includes recording fictitious revenues (FT1), recording revenues prematurely (FT2), and no description/overstated revenues (FT3). Overstatement of Assets includes overstating existing assets (FT4), recording fictitious assets or assets not owned (FT5), and capitalizing items that should be expensed (FT6). Others includes understatement of expenses/liabilities (FT7), misappropriation of assets (FT8), inappropriate disclosure (FT9), and other miscellaneous techniques (FT10).
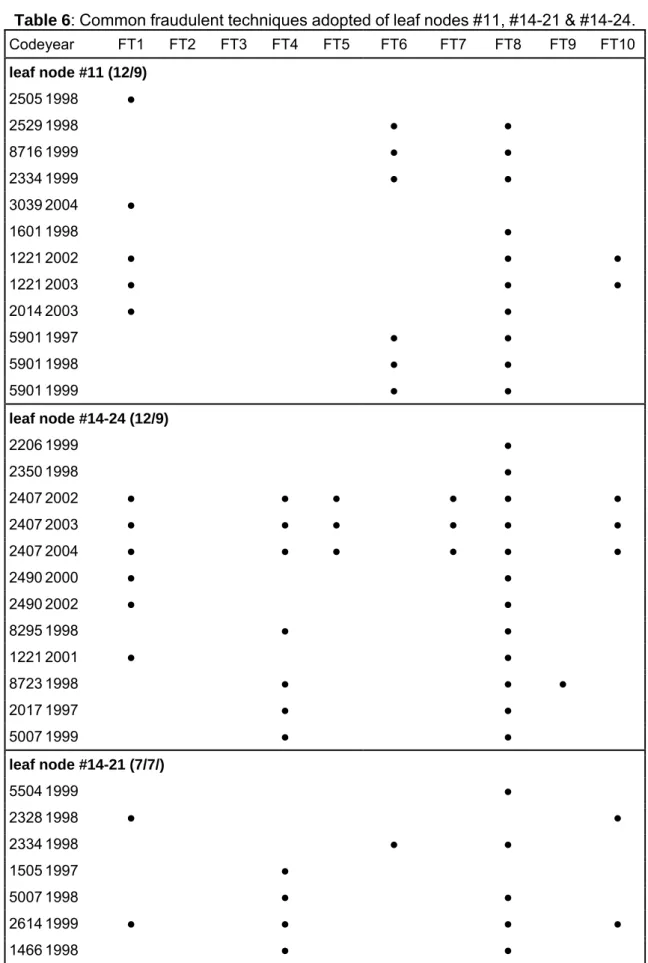
For demonstration purposes, we take merely the three leaf nodes, #11, #14-21, and #14-24 to illustrate the parts of uncovering the regularity of fraudulent techniques
10
from the corresponding indictments and sentences for major securities crimes issued by the Department of Justice. Table 6 summarizes the fraudulent techniques
commonly adopted by companies clustered in these three leaf nodes. The code and year in the first two column of Table 6 lists the company code and the year of each clustered financial statement.
<Insert Table 6 here>
As shown in Table 6, common fraudulent techniques found in leaf node #11 are FT1, FT6 and FT8; in leaf node #14-24 are FT1, FT4 and FT8; and in leaf node #14-21 are FT4 and FT8. Note that leaf nodes #14-24 and #14-21 have same parent (leaf node #14) and they share a certain similarity in common fraudulent techniques. In sum, Table 6 shows that the observed common fraudulent techniques in different leaf nodes are distinctive even though samples are clustered based upon corporate financial situations proxied by input variables (i.e., the eight variables identified from discriminant analysis).
Compared to the traditional fraudulent technique classification scheme, such a contrast demonstrates the advantage of our approach since our classification outcomes appear to be more delicate. For instance, some fraud samples in leaf node #11 were found using FT1 via creating fictitious transactions and defrauding export drawbacks from the Internal Revenue Service by reporting fictitious export sales. Moreover, some fraud samples used FT8 by processing the receipt and payment in advance. In contrast, some fraud samples in leaf node #14-24 were found to have been using FT4 through purchasing intangible asset/long-term investment with high premiums. Some fraud samples used FT8 through related party transactions and merger and acquisition activities to misappropriate cash.
Conclusion
In the data preprocessing stage, a sample set comprised of 113 fraud samples and 467 non-fraud samples is used to identify eight significant variables regarding FFR via the discriminant analysis. Based upon the (identified) variables as inputs, GHSOM clusters 113 fraud samples into 13 (small-sized) leaf nodes. Distinguishing this study from others of feature extraction is that, for each leaf node, common fraud techniques are disclosed with the assistance of expert knowledge in examining corresponding
11
FFR indictments and sentences (exogenous information) of clustered samples without referring to the attributes of input variables. With acknowledging that different leaf nodes have distinctive common fraudulent techniques, the study confirms that
GHSOM can provide implicitly a relationship between common fraud techniques (an exogenous variable) and input variables. To go further to uncover the relationship between common fraud techniques and input variables is one of future works. The study also demonstrates the abilities of GHSOM to (1) extract features from exogenous information that are more abundant and more informative than input variables and (2) classify exogenous variables in terms of input variables.
The exogenous abilities of GHSOM can contribute to the FFR literature at least as follows. Exogenous FFR features uncovered in each leaf node describe the observed regularity of corporate behavior in that subgroup and are applicable to all samples clustered in that leaf node. For each leaf node, this principle and any pre-warning signals provided by exogenous FFR features can result in some FFR audit guideline.
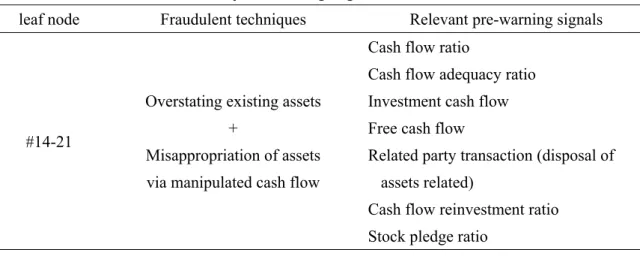
For instance, with the assistance of experts with domain knowledge on common fraudulent techniques, we can identify the financial indicators revealing the potential fraudulent activities as pre-warning signals. Take leaf node #14-21 as an illustration. The expert with domain knowledge on common fraudulent techniques summarizes the primary causes of utilizing both FT4 and FT8 fraudulent techniques as the bad cash flow condition of the firms and high financial pressure from management and derive the relevant pre-warning signals shown in Table 7. When a new sample is imported into the obtained GHSOM and the distance deviation between the input vector and the weight vector of leaf node #14-21 is less than a predefined threshold, it is assigned as the potential (fraud) member of that subgroup. Based upon the assignment, the relevant pre-warning signals shown in Table 7 can help auditors perform prudent audit planning and audit judgment.
<Insert Table 7 here>
In addition, with distinctive exogenous FFR features extracted from different leaf nodes and tons of leaf nodes, a further analysis of associations between (exogenous and endogenous) FFR features and corresponding clustered samples can provide more insights of FFR.
12
Other future works are suggested as follows: (1) to refine the GHSOM to get a better classification mechanism or to identify better ways in extracting exogenous FFR features from the outcomes of GHSOM; (2) to investigate the generality of our approach using data from other countries; and (3) to examine the prediction ability extended from the study.
13 References
ACFE. 2008. 2008 Report to the nation on occupational fraud & abuse, Association of Certified Fraud Examiners, Austin, TX.
Altman, E.I. 1968. "Financial ratios, discriminant analysis and the prediction of corporate bankruptcy,"
Journal of Finance (23:4), pp 589-609.
Beasley, M.S., Carcello, J.V., and Hermanson, D.R. 1999. Fraudulent financial reporting: 1987-1997 COSO, New York.
Bell , T.B., and Carcello, J.V. 2000. "A decision aid for assessing the likelihood of fraudulent financial reporting," Auditing: A Journal of Practice & Theory (19), pp 169-184.
Dechow, P.M., Ge, W., Larson, C.R., Sloan, R.G., and Investors, B.G. 2007. "Predicting material accounting manipulations," AAA 2007 Financial Accounting and Reporting Section (FARS) Paper
[Electronic Version] (1001), December 13, 2007 p48109. Retrieved December 13, 2007 from
http://ssrn.com/abstract=997483.
Dechow, P.M., Sloan, R.G., and Sweeney, A.P. 1996. "Causes and Consequences of Earnings Manipulation: An Analysis of Firms Subject to Enforcement Actions by the SEC," Contemporary
accounting research (13:1), pp 1-36.
Dittenbach, M., Merkl, D., and Rauber, A. 2000. "The growing hierarchical self-organizing map," Proceedings of the IEEE-INNS-ENNS International Joint Conference on Neural Networks, IJCNN, pp. 15-19.
Fanning, K.M., and Cogger, K.O. 1998. "Neural network detection of management fraud using published financial data," Intelligent Systems in Accounting, Finance & Management (7:1), pp 21-41.
Green, B.P., and Choi, J.H. 1997. "Assessing the risk of management fraud through neural network technology," Auditing (16), pp 14-28.
Hoogs, B., Kiehl, T., Lacomb, C., and Senturk, D. 2007. "A genetic algorithm approach to detecting temporal patterns indicative of financial statement fraud," Intelligent Systems in Accounting,
Finance & Management (15:1-2), pp 41-56.
Kirkos, E., Spathis, C., and Manolopoulos, Y. 2007. "Data Mining techniques for the detection of fraudulent financial statements," Expert Systems with Applications (32:4), pp 995-1003. Kohonen, T. 1982. "Self-organized formation of topologically correct feature maps," Biological
cybernetics (43:1), pp 59-69.
La Porta, R., Lopez-de-Silanes, F., Shleifer, A., and Vishny, R. 1999. "Corporate ownership around the world," Journal of Finance (54:2), pp 471-517.
Lee, T.S., and Yeh, Y.H. 2004. "Corporate governance and financial distress: evidence from Taiwan,"
Corporate Governance: An International Review (12:3), pp 378-388.
Ngai, E.W.T., Hu, Y. , Wong , Y.H., Chen, Y., and Sun, X. 2010. "The application of data mining techniques in financial fraud detection: A classification framework and an academic review of
14
literature", Decision Support Systems, In Press, Accepted Manuscript, Available online 19 August 2010.
Persons, O.S. 1995. "Using financial statement data to identify factors associated with fraudulent financial reporting," Journal of Applied Business Research (11), pp 38-46.
Rauber, A., Merkl, D., and Dittenbach, M. 2002. "The growing hierarchical self-organizing map: exploratory analysis of high-dimensional data," IEEE Transactions on Neural Networks (13:6), pp 1331-1341.
Rumelhart, D.E., and Zipser, D. 1985. "Feature discovery by competitive learning*," Cognitive Science (9:1), pp 75-112.
Schweighofer, E., Rauber, A., and Dittenbach, M. 2001. "Automatic text representation, classification and labeling in European law," ACM, p. 87.
Séverin, E. 2010. "Self organizing maps in corporate finance: Quantitative and qualitative analysis of debt and leasing," Neurocomputing (73:10-12), pp. 2061-2067
Shih, J., Chang, Y., and Chen, W. 2008. "Using GHSOM to construct legal maps for Taiwan's securities and futures markets," Expert Systems with Applications (34:2), pp 850-858.
Soriano-Asensi, A., Martin-Guerrero, J., Soria-Olivas, E., Palomares, A., Magdalena-Benedito, R., and Serrano-Lopez, A. 2008. "Web mining based on Growing Hierarchical Self-Organizing Maps: Analysis of a real citizen web portal," Expert Systems with Applications (34:4), pp 2988-2994. Stice, J.D. 1991. "Using financial and market information to identify pre-engagement factors associated
with lawsuits against auditors," Accounting Review (66:3), pp 516-533.
Summers , S.L., and Sweeney, J.T. 1998. "Fraudulently misstated financial statements and insider trading: An empirical analysis," Accounting Review (73:1), pp 131-146.
Virdhagriswaran, S., and Dakin, G. 2006. "Camouflaged fraud detection in domains with complex relationships," ACM, pp. 941-947.
Yeh, Y., Lee, T., and Woidtke, T. 2001. "Family control and corporate governance: Evidence from Taiwan," International Review of finance (2:1 2), pp 21-48.
15
Table 1: Research methodology and findings in nature-related FFR studies.
Research Methodology Findings (Beasley et al.
1999)
• Case study
• Descriptive statistics
• Nature of companies involved
– Companies committing financial statement fraud were relatively small.
– Companies committing the fraud were inclined to
experience net losses or close to break-even positions in periods before the fraud.
• Nature of the control environment
– Top senior executives were frequently involved.
– Most audit committees only met about once a year or the company had no audit committee.
• Nature of the frauds
– Cumulative amounts of fraud were relatively large in light of the relatively small sizes of the companies involved. – Most frauds were not isolated to a single fiscal period. – Typical financial statement fraud techniques involved the
overstatement of revenues and assets.
• Consequences for the company and individuals involved – Severe consequences awaited companies committing
fraud.
– Consequences associated with financial statement fraud were severe for individuals allegedly involved.
(ACFE 2008) • Case study
• Descriptive statistics
• Occupational fraud schemes tend to be extremely costly. The median loss was $175,000. More than one-quarter of the frauds involved losses of at least $1 million.
• Occupational fraud schemes frequently continue for years, two years in typical, before they are detected.
• There are 11 distinct categories of occupational fraud. Financial statement fraud was the most costly category with a median loss of $2 million for the cases examined.
• The industries most commonly victimized by fraud in our study were banking and financial services (15% of cases), government (12%) and healthcare (8%).
• Fraud perpetrators often display behavioral traits that serve as indicators of possible illegal behavior. In financial statement fraud cases, which tend to be the most costly, excessive organizational pressure to perform was a particularly strong warning sign.
16
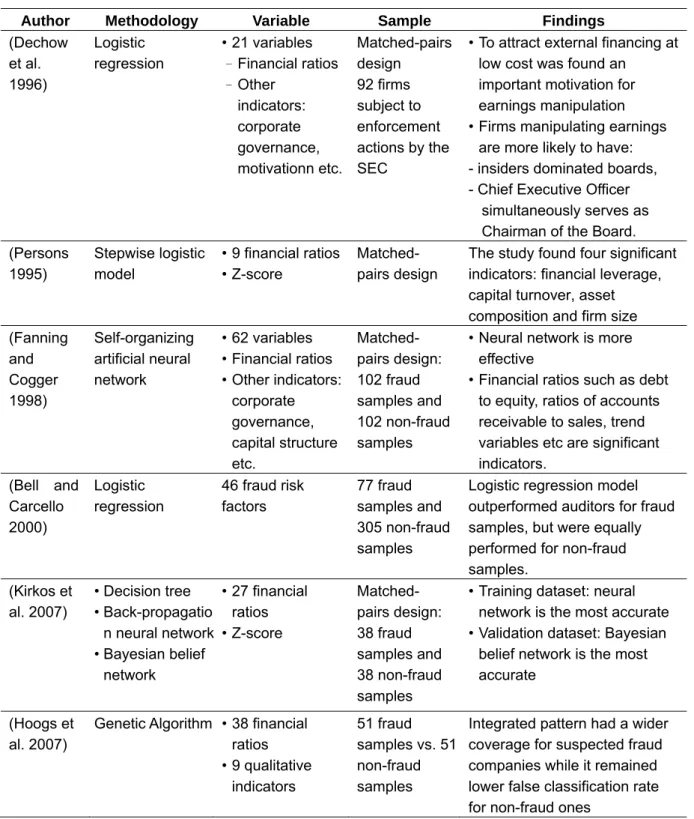
Table 2: Research methodology and findings in FFR empirical studies.
Author Methodology Variable Sample Findings (Dechow et al. 1996) Logistic regression • 21 variables – Financial ratios – Other indicators: corporate governance, motivationn etc. Matched-pairs design 92 firms subject to enforcement actions by the SEC
• To attract external financing at low cost was found an
important motivation for earnings manipulation • Firms manipulating earnings
are more likely to have: - insiders dominated boards, - Chief Executive Officer
simultaneously serves as Chairman of the Board. (Persons 1995) Stepwise logistic model • 9 financial ratios • Z-score Matched- pairs design
The study found four significant indicators: financial leverage, capital turnover, asset composition and firm size (Fanning and Cogger 1998) Self-organizing artificial neural network • 62 variables • Financial ratios • Other indicators: corporate governance, capital structure etc. Matched- pairs design: 102 fraud samples and 102 non-fraud samples
• Neural network is more effective
• Financial ratios such as debt to equity, ratios of accounts receivable to sales, trend variables etc are significant indicators. (Bell and Carcello 2000) Logistic regression 46 fraud risk factors 77 fraud samples and 305 non-fraud samples
Logistic regression model outperformed auditors for fraud samples, but were equally performed for non-fraud samples. (Kirkos et al. 2007) • Decision tree • Back-propagatio n neural network • Bayesian belief network • 27 financial ratios • Z-score Matched- pairs design: 38 fraud samples and 38 non-fraud samples
• Training dataset: neural network is the most accurate • Validation dataset: Bayesian
belief network is the most accurate
(Hoogs et al. 2007)
Genetic Algorithm • 38 financial ratios • 9 qualitative indicators 51 fraud samples vs. 51 non-fraud samples
Integrated pattern had a wider coverage for suspected fraud companies while it remained lower false classification rate for non-fraud ones
17
Table 3: Variable definition and measurement
Variable Definition Literature Measurement Dependent variable:
FRAUD (Persons 1995)
If a company’s financial statements for specific years are confirmed to be fraudulent by the indictments and sentences for major securities crimes issued by the Department of Justice, the firm-year data are classified into fraud
observations, and the variable FRAUD will be set to 1, 0 otherwise.
Independent variable Profitability
Gross profit margin
(GPM) (Dechow et al. 2007) Operatingincome costs Operating
-income Operating
Operating profit ratio
(OPR) (Green and Choi 1997) Operatingincome
expenses Operating -costs Operating -income Operating Return on assets (ROA)
(Hoogs et al. 2007; Persons
1995) Average totalassets
rate) Tax -(1 expenses Interest income Net
Growth rate of net sales
(GRONS)
(Dechow et al. 2007; Stice 1991; Summers and Sweeney 1998) 1 ) year fiscal prior in sales Net sales Net (
Growth rate of net income (GRONI) 1 ) year fiscal prior in income Net sales Net ( Liquidity Current ratio
(CR) (Kirkos et al. 2007) Currentliabilities assets Current
Quick ratio
(QR) (Kirkos et al. 2007) Currentliabilities
expenses Prepaid -s Inventorie -assets Current Operating ability Accounts receivable turnover (ART)
(Green and Choi 1997)
receivable accounts Average sales credit Net
18 Total asset turnover
(TAT)
(Kirkos et al. 2007; Persons
1995) Totalassets sales Net Growth rate of accounts receivable (GROAR) (Dechow et al. 2007) )-1 year fiscal prior in receivable Accounts receivable Accounts ( Growth rate of inventory (GROI) (Dechow et al. 2007) )-1 year fiscal prior in Inventory Inventory ( Growth rate of Accounts receivable to gross sales (GRARTGS)
(Summers and Sweeney
1998) t-1 1 -t t t sales Gross receivable Accounts -sales Gross receivable Accounts Growth rate of Inventory to gross sales (GRITGS)
(Summers and Sweeney
1998) t-1 1 -t t t sales Gross Inventory -sales Gross Inventory Accounts receivable to total assets (ARTTA)
(Green and Choi 1997;
Persons 1995; Stice 1991) Totalassets receivable Accounts Inventory to total assets (ITTA) (Persons 1995; Stice 1991) assets Total Inventory Financial structure Debt ratio (DR)
(Kirkos et al. 2007; Persons
1995) Totalassets s liabilitie Total Long-term funds to fixed assets (LFTFA) (Kirkos et al. 2007) assets Fixed s liabilitie Longterm + Equity
Cash flow ability Cash flow ratio
(CFR) (Dechow et al. 2007) Current liabilities
activities operating
from flows Cash
Cash flow adequacy ratio (CFAR) (Dechow et al. 2007) dividends) cash and additions inventory es, expenditur capital of sum year (Five activities operating from flows cash of sum year Five
19 Cash flow reinvestment ratio (CFRR) (Dechow et al. 2007) capital) Working + assets Other + s investment term Long + assets fixed (Gross dividends Cash -activities operating from flows Cash Financial difficulty Z-score
(Altman 1968; Fanning and Cogger 1998; Stice 1991; Summers and Sweeney
1998) ) 1.0 TAT debt total of Book value equity of ue Market val ( 6 . 0 ) assets Total taxes and interest before Earnings ( 3 . 3 ) assets Total earnings Retained ( 4 . 1 ) assets Total capital Working ( 2 . 1 Corporate Governance Stock Pledge ratio
(SPR)# (Lee and Yeh 2004) largeshareholders'shareholdings
pledge in ngs shareholdi rs' shareholde large Sum of percentage of major shareholders’ shareholdings (SMLSR)
(Beasley et al. 1999) Σ (Percentage of shareholdings >10%)
Deviation between CR and CFR (DBCRCFR)
(La Porta et al. 1999; Lee and
Yeh 2004) Voting rights - Cash flow rights Deviation between
CBS and CFR (DBCBSCFR)
(Lee and Yeh 2004; Yeh et al. 2001)
Percentage of board seats controlled - Cash flow rights
#: According to the rule issued from the Securities and Futures Commission (SFC) of Taiwan,
directors, supervisors, managers and large shareholders (that own 10 per cent or more of a company’s outstanding shares) in public companies are obliged to report to the SFC the percentage of their shareholdings that are pledged for loans and credits. These data matter, since pledging for loans effectively reduces the personal funds required for shareholding. In other words, the degree of personal leverage expands and the over-investments in the stock market by the largest shareholder also create risk for the companies to a certain degree. (Lee and Yeh 2004)
20
Table 4: Descriptive Statistics of variables
Fraud Sample (N=113) Non-fraud Sample (N=467)
Variable Mean Median
25 Percentiles 75 Percentiles Mean Median 25 Percentiles 75 Percentiles Z GPM 11.85 10.65 4.99 19.41 15.51 14.47 8.12 22.77 -3.19 OPR -5.39 0.32 -7.26 6.92 -34.49 3.81 -0.24 8.60 -3.98 ROA -13.45 -2.76 -23.48 5.29 3.40 4.19 0.39 7.97 -6.53 GRONS 8.30 7.84 -15.47 24.99 38.73 5.23 -7.77 19.89 -0.08 GRONI 47.23 -71.97 -636.91 24.49 -41.32 14.30 -44.89 80.07 -6.74 CR 109.83 104.68 60.98 141.48 190.94 150.01 110.02 210.00 -7.00 QR 57.79 45.54 21.84 77.09 110.36 75.73 38.09 124.66 -5.16 ART 7.10 4.62 3.16 7.34 8.91 5.36 3.75 8.94 -2.51 TAT 0.61 0.48 0.31 0.74 0.75 0.64 0.41 0.93 -3.69 GROAR 39.67 -5.73 -37.06 34.73 68.97 6.03 -15.15 33.86 -2.42 GROI 13.85 -1.02 -28.82 23.66 27.03 2.18 -14.80 31.14 -1.67 GRARTGS -0.17 -1.04 -7.95 3.30 2.13 0.22 -2.75 3.11 -2.46 GRITGS 24.91 -0.34 -5.40 3.43 23.96 0.00 -3.37 4.80 -1.11 ARTTA 12.02 10.11 4.79 18.37 13.70 10.84 5.05 20.33 -1.33 ITTA 16.72 11.36 5.96 19.49 19.94 13.57 5.82 24.67 -1.74 DR 64.02 60.23 48.10 71.40 48.17 45.03 33.67 56.75 -7.59 LFTFA 452.26 165.79 95.29 399.96 482.48 225.20 146.73 427.05 -3.48 CFR -14.91 -6.88 -21.21 6.54 13.41 8.12 -5.96 29.70 -6.26 CFAR -18.56 -6.54 -27.97 8.65 9.36 14.52 -17.16 54.56 -5.53 CFRR -46.73 -2.69 -14.70 3.74 0.37 2.03 -4.17 7.56 -4.59 SPR 37.44 33.44 1.83 63.26 19.32 3.58 0.00 32.49 -5.67 SMLSR 13.97 11.98 3.72 20.38 10.83 7.89 0.09 16.96 -3.16 DBCRCFR 3.47 0.47 0.00 2.76 3.62 0.56 0.00 4.09 -0.66 DBCBSCFR 46.00 45.58 22.87 67.41 44.26 43.68 26.99 63.69 -0.59 Z-Score 31.45 79.60 -91.69 166.17 198.67 194.70 120.89 270.95 -8.68
21
Table 5: Empirical results of discriminant analysis.
Variable Coefficient F-value Significance
GPM 0.14 3.51 0.061 OPR -0.03 0.16 0.688 ROA 0.77*** 105.82 0.000 GRONS 0.06 0.63 0.427 GRONI -0.02 0.05 0.822 CR 0.34*** 20.59 0.000 QR 0.28*** 13.42 0.000 ART 0.09 1.58 0.210 TAT 0.19 6.38 0.012 GROAR 0.03 0.12 0.731 GROI 0.07 0.90 0.344 GRARTGS 0.00 0.00 0.997 ARTTA 0.11 2.25 0.134 ITTA 0.12 2.37 0.125 DR -0.42*** 30.46 0.000 LFTFA 0.02 0.09 0.764 CFR 0.33*** 19.21 0.000 CFAR 0.24*** 9.89 0.002 CFRR 0.19 6.41 0.012 SPR -0.47*** 38.85 0.000 SMLSR -0.19 6.18 0.013 DBCRCFR 0.02 0.04 0.835 DBCBSCFR -0.05 0.41 0.524 Z-score 0.64*** 72.74 0.000
Wilks' Λ value 0.77 p-value 0.000
22
Table 6: Common fraudulent techniques adopted of leaf nodes #11, #14-21 & #14-24.
Code year FT1 FT2 FT3 FT4 FT5 FT6 FT7 FT8 FT9 FT10 leaf node #11 (12/9) 2505 1998 ● 2529 1998 ● ● 8716 1999 ● ● 2334 1999 ● ● 3039 2004 ● 1601 1998 ● 1221 2002 ● ● ● 1221 2003 ● ● ● 2014 2003 ● ● 5901 1997 ● ● 5901 1998 ● ● 5901 1999 ● ● leaf node #14-24 (12/9) 2206 1999 ● 2350 1998 ● 2407 2002 ● ● ● ● ● ● 2407 2003 ● ● ● ● ● ● 2407 2004 ● ● ● ● ● ● 2490 2000 ● ● 2490 2002 ● ● 8295 1998 ● ● 1221 2001 ● ● 8723 1998 ● ● ● 2017 1997 ● ● 5007 1999 ● ● leaf node #14-21 (7/7/) 5504 1999 ● 2328 1998 ● ● 2334 1998 ● ● 1505 1997 ● 5007 1998 ● ● 2614 1999 ● ● ● ● 1466 1998 ● ●
FT1:recording fictitious revenues;FT2:recording revenues prematurely;FT3:no description /overstated about revenues; FT4: overstating existing assets; FT5: recording fictitious assets or assets not owned; FT6: capitalizing items that should be expensed; FT7: understatement of expenses/liabilities; FT8: misappropriation of assets; FT9: inappropriate disclosure; FT10: other miscellaneous techniques.
23
Table 7: Relevant pre-warning signals for leaf node #14-21.
leaf node Fraudulent techniques Relevant pre-warning signals
#14-21
Overstating existing assets +
Misappropriation of assets via manipulated cash flow
Cash flow ratio
Cash flow adequacy ratio Investment cash flow Free cash flow
Related party transaction (disposal of assets related)
Cash flow reinvestment ratio Stock pledge ratio
24
Figure 1: The GHSOM structure adapted from (Dittenbach et al. 2000)
Figure 2: Horizontal growth of individual SOM. The notation e indicates the error node
and d the dissimilar neighbor. Source: (Dittenbach et al. 2000)
Figure 3: The sample distribution in the obtained GHSOM, in which leaf nodes are
marked in taint. In each node, the numbers within the parenthesis indicate the number of fraudulent financial statements and the number of (fraud) firms.
#11 (12/9) #12 (28/18) #13 (25/18) #14 (48/15) Layer 1 Layer 2 #12-21 (3/3) #12-23 (13/9) #12-22 (11/7) #12-24 (1/1) #13-21 (6/5) #13-23 (4/4) #13-22 (9/7) #13-24 (6/3) #14-21 (7/7) (21/12)#14-23 #14-22 (8/8) #14-24 (12/9) #01 (113/58)
國科會補助計畫衍生研發成果推廣資料表
日期:2011/08/29國科會補助計畫
計畫名稱: 法人董監事制度與財務績效 計畫主持人: 林宛瑩 計畫編號: 99-2410-H-004-071- 學門領域: 會計無研發成果推廣資料
99 年度專題研究計畫研究成果彙整表
計畫主持人:林宛瑩 計畫編號: 99-2410-H-004-071-計畫名稱:法人董監事制度與財務績效 量化 成果項目 實際已達成 數(被接受 或已發表) 預期總達成 數(含實際已 達成數) 本計畫實 際貢獻百 分比 單位 備 註 ( 質 化 說 明:如 數 個 計 畫 共 同 成 果、成 果 列 為 該 期 刊 之 封 面 故 事 ... 等) 期刊論文 0 0 100% 研究報告/技術報告 0 0 100% 研討會論文 2 2 100% 篇 論文著作 專書 0 0 100% 申請中件數 0 0 100% 專利 已獲得件數 0 0 100% 件 件數 0 0 100% 件 技術移轉 權利金 0 0 100% 千元 碩士生 0 0 100% 博士生 0 0 100% 博士後研究員 0 0 100% 國內 參與計畫人力 (本國籍) 專任助理 0 0 100% 人次 期刊論文 0 0 100% 研究報告/技術報告 0 0 100% 研討會論文 0 0 100% 篇 論文著作 專書 0 0 100% 章/本 申請中件數 0 0 100% 專利 已獲得件數 0 0 100% 件 件數 0 0 100% 件 技術移轉 權利金 0 0 100% 千元 碩士生 0 0 100% 博士生 0 0 100% 博士後研究員 0 0 100% 國外 參與計畫人力 (外國籍) 專任助理 0 0 100% 人次其他成果