Pergamon
0146-6380(95)00017-8
Org. Geochem. Vol. 23, No. 4, pp. 301-310, 1995 Copyright © 1995 Elsevier Science Ltd Printed in Great Britain. All rights reserved 0146-6380/95 $9.50 + 0.00
Grain size effect on bound lipids in sediments
off northeastern Taiwan
WOEI-LIH JENG and MIN-PEN CHEN
Institute of Oceanography, National Taiwan University, Taipei, Taiwan, Republic of China (Received 28 February 1994," returned for revision 14 June 1994; accepted 15 February 1995) Abstract--Two box-core sediments off the northeastern Taiwan coast have been collected and examined for the relationship between bound lipids and grain size in the mud fraction (< 63/t m). No grain size effect was found for the concentrations of En-alkanes, En-fatty acids and Zn-alcohols. The ratios of branched-chain to normal fatty acids increased progressively with decreasing particle size and correlated highly with BOC (bound organic carbon), suggesting an increasing bacterial input. Moreover, we observed an increase in the ratios of monounsaturated to saturated fatty acids with decreasing grain size, pointing to an increasing microbial contribution. Particularly interesting is phytol, which demonstrated a remarkable grain size effect; the phytol to BOC ratio increased sharply with decreasing particle size. Major sterols normalized to BOC increased progressively with a decrease in grain size and correlated highly with BOC. The results indicate that a plankton contribution to phytol and sterols increased as particle size decreased. The grain size effect is stronger for phytol than for sterols and branched-chain fatty acids in the sediments.
Key words--bound organic carbon, hydrocarbons, fatty acids, alcohols, sterols, offshore Taiwan sediments, grain size
INTRODUCTION
Lipid analysis of the separate fractions of sediments may provide more precise information about input sources than analysis of unfractionated sediments (Thompson and Eglinton, 1978). For instance, in lake sediments and equatorial deltaic sediments the car- bon preference index (CPI) values of free n-alkanes and n-fatty acids are lower for finer fractions and higher for coarser ones (Thompson and Eglinton, 1978; Gonzalez et al., 1985), reflecting an enrichment of the coarser fraction in higher plant detritus. How- ever, for Recent equatorial deltaic sediments the CPI values of free n-alkanes and n-fatty acids exhibit no clear relationship with sand, silt and clay (Pillon et al., 1986). For bound n-alkanes in equatorial deltaic sediments, the CPI values show a slight increase with decreasing grain size (Barouxis et al., 1988). Moreover, the ratios of branched-chain to normal fatty acids increase with decreasing particle size, attributable to bacterial input to sediments from equatorial deltaic sediments (Gonzalez et al., 1985; Barouxis et al., 1988) and from a mariculture area (Jeng, 1992). Prahl and Carpenter (1983) examined coastal sediments off Washington and divided them according to size and density. They found that retene, perylene and polynuclear aromatic hydrocarbons (PAH) derived from pyrolytic processes are enriched in the low density fraction ( ~ 1.9 g/cc) of the bulk sediment and that a series of methylated phenanthrene homologs, possibly of fossil origin, are
contained in a more dense, lithic component of the sediment. In contaminated estuarine tidal mud, alkanes derived from oil pollution are more abundant in the clay-sized fraction; in contrast, PAH, mainly derived from combustion of fossil fuels, are present in greatest proportion in the sand fraction (Brassell and Eglinton, 1980).
Up to the present, research dealing with organic compounds in relation to sediment grain size is rather scanty, and sediment particle size has generally been separated into three fractions--sand ( > 6 3 p m), silt (63 ~ 5 pm) and clay ( < 5/~m). Most studies regard- ing the grain size effect on lipids have been carried out on fatty acids and hydrocarbons, but not on alcohols and sterols. Bound lipids have been studied even less. Some compounds related to diagenetic evolution in the sedimentary organic matter have a higher concen- tration in the bound phase than in the extractable phase. For example, the solvent extractable fractions comprised < 5 % of the total alcohols (Shaw and Johns, 1985); phytol has been found exclusively in the bound phase in some sediments (Shaw and Johns, 1985; Jeng and Han, 1993). Nishimura (1977) con- cluded that (1) the extractable and nonextractable sterols have similar origins, (2) some constituents of the latter may be protected from chemical or micro- biological degradation and transformation in the sediments, and (3) the transformation of some con- stituents of the former into nonextractable matter virtually does not occur after incorporation into Suwa sediments. Comparing sand with mud, organic 301
matter is mainly concentrated in mud. In order to provide more detailed information about the grain size effect on .bound lipid distribution in mud, up to four size fractions have been separated and analyzed in this study. An attempt is made to correlate data of n-alkanes, fatty acids, alcohols and sterols with grain size.
Previous studies have focused on sediments from shallow water environments including lake sediment (Thompson and Eglinton, 1978), estuarine tidal mud (Brassell and Eglinton, 1980), deltaic sediments (Pillon et al., 1986; Barouxis et al., 1988) and sedi- ments from a mariculture area (Jeng, 1992). In the present study, open marine sediments were chosen for investigation.
E X P E R I M E N T A L
S e d i m e n t s a m p l e s
Sediments off western Taiwan are mostly sandy (Boggs et al., 1974) and are generally contaminated by heavy metals and/or organics such as petroleum hydrocarbons (Jeng, 1986). In contrast, sediments off eastern Taiwan consist mainly of mud with little or no anthropogenic influence. Further, the Kuroshio current flows northward along the east coast of Taiwan. Its subsurface water shoals up off the north- east coast and turns northeastward along the East China Sea continental slope. Sedimentation rates on the continental slope off eastern Taiwan show an increasing trend from south to north (Hung and Chung, 1994). The rates off the northeast coast are greatest ranging from 3 cm/ka at 122°09'E, 24°00'N to 280cm/ka at 122°32'E, 25°28'N (Hung and Chung, 1994). Another determination made at
123°14.99'E, 25~14.61'N gives a rate of 21 cm/ka (Shieh and Chen, 1993). The organic carbon concen- tration was lowest on the continental shelf with an average of 0.19%, increased with water depth to ca 0.8% on the upper continental slope, and decreased at greater depths to ca 0.50% on the lower continental slope (Lin et al., 1992).
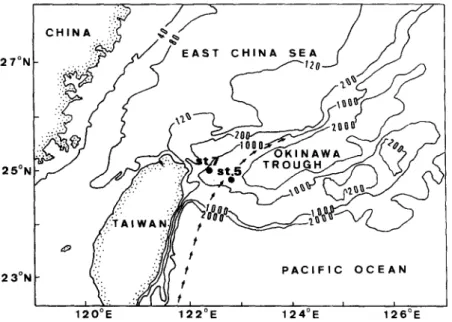
Two box-core sediment samples (top 5 cm) on the continental slope off northeastern Taiwan (Fig. 1) were collected on board R/V Ocean Researcher I. Sample 5 is located at 24°50.18'N, 122°49.08'E with a water depth of 1522 m, and sample 7 at 25°00.19'N, 122°20.48'E with a water depth of 1187 m. Sediments were kept under refrigeration (freezing might break or change particle size) at about 0°C for no more than 5 days before sample work-up.
In the lab, sediments were first dried by filtration followed by methanol washing (mainly to remove water). Extractable lipids were removed by Soxhlet extraction using methylene chloride for 24 h followed by methanol/benzene (1 : 1, v/v) for 48 h. All solvents used were HPLC grade.
S e d i m e n t size f r a c t i o n a t i o n
The extracted sediment was dispersed with a 0.05% sodium metaphosphate solution saturated with chloroform in Teflon bottles and subjected to vigorous shaking (5 strokes/s) with a separatory funnel shaker for 4h, which ensured the complete dispersion of sediment particles. The dispersed sedi- ment was wet-sieved through a 230 mesh stainless steel sieve with distilled water saturated with chloro- form. The mud fraction, having particle size smaller than 63-~m, was pooled and further fractionated into four size fractions by sedimentation/decantation (by
2 T N . ....J
/" ,--'
. .-.:{
~
~
o
.:i:
j
23°N
~'.:
~i"
PACIFIC
O C E A NI ~:': "~'~'/(~ I I I I I
120°E 22°E 124°E 126~E
Fig. 1. Map (after Chern et al., 1990) showing sampling sites. Bathymetric contours are in meters. Arrows indicate the approximate path of the Kuroshio current.
Grain size effect on bound lipids 303 siphon) using a 3-L pyrex beaker with a liquid depth
of about 10 cm and by centrifugal sedimentation for clay (Jeng, 1992). The fraction in which sediment particles sedimented for 5 min is designated as frac- tion 5M; for l h, 1H; and for 12h, 12H. Those sediment particles staying in suspension longer than 12 h were recovered by centrifugation and designated as fraction > 12H. Each fraction was freeze-dried. The sediment size distribution of sample 5 is sand, 2.2%; fraction 5M, 16.8% ; fraction IH, 13.9%; fraction 12H, 13.9%; and fraction > 12H, 53.2%; and that of sample 7 is sand, 2.5%; fraction 5M, 23.1%; fraction 1H, 36.7%; fraction 12H. 19.7%, and fraction > 12H, 17.9%. The low sand percentage is due to the effect of the Kuroshio current which turns approximately in the sampling area. Coarse particles from the East China Sea shelf are blocked by the Kuroshio and deposited on the shelf, and fine particles cross the shelf and settle on the slope of the Okinawa Trough (Chen et al., 1992). In addition, the shelf is predominantly composed of relict sediment from the last glaciation (Niino and Emery, 1961). The sampling sites contain hemipelagic sediment dominated by terrigenous matter from mainland China and, to a lesser extent, Taiwan.
Lipid isolation
Bound lipids in each size fraction were released by hydrolysis using 0.5 N KOH in methanol. After residue separation, n-docos-l-ene, n-nonadecanoic acid and 1-nonadecanol were added as internal stan- dards. The filtrate was extracted with n-hexane (4 x ) to obtain non-saponifiable lipids. Saponifiable lipids were acidified with conc. HC1 to pH 2 and extracted with n-hexane (4 ×). The extract was dried under nitrogen and methylated with 14% BF 3 in methanol (Metcalfe and Schmitz, 1961). The nonsaponifiable lipids were separated into aliphatic hydrocarbon and alcohol/sterol fractions by silica gel column chroma- tography using n-hexane and chloroform/methanol (4: 1, v/v), respectively. Lipids between the two fractions were removed with n-hexane/chloroform (2:3, v/v). The fatty acid methyl esters were cleaned up by silica gel column chromatography using n-hex- ane/chloroform (4: 1, v/v). Alcohols and sterols were derivatized with N,O-bis-(trimethylsilyl)acetamide to form TMS ethers.
Analysis
Aliphatic hydrocarbons, fatty alcohols, sterols, and fatty acids were analyzed by capillary gas chro- matography using an HP 5890A gas chromatograph equipped with a split/splitless injector and a flame ionization detector. An SGE (Australia) OCI-5 cool on-column injector was also fitted in the gas chro- matograph for quantitation. Hydrocarbons and fatty acids (as F A M E s ) respectively were separated on an SE-30 and an SE-54 fused silica capillary columns (30 m × 0.25 mm i.d.) using a dual ramp temperature program from 45 to 90°C/min at 15°C/min and then
from 90 to 280°C at 3°C/min. Alcohols and sterols (as TMS ethers) were separated on an SE-30 fused silica capillary column (30 m x 0.25 mm i.d.); oven tem- perature was programmed as follows: (1) 45-90°C at 15°C/min, (2) 90-270°C at 3°C/min, (3) 20min at 270°C, (4) 270-280°C at 10°C/min, and (5) 20min at 280°C. Hydrogen was used as the carrier gas. Identifications were made by coinjection with authentic standards and by comparing retention times with literature values. Positive confirmation was made with a Finnigan M A T TSQ-46C GC/MS or an HP 5890A gas chromatograph coupled to an HP 5970B mass selective detector. Peaks of each chromatogram were integrated with a Shimadzu data processor, Chromatopac C-R6A. Based on replicate analyses, the analytical precision of lipids was calculated to be 2-8%.
Bound organic carbon (BOC)
All sediment size fractions were determined for their bound organic carbon by the dichromate-acid oxidation method (Gaudette et aL, 1974) with the following modifications: (1) Ag2SO 4 was added to HESO 4 at the rate of 15 g/l and (2) o-phenanthroline- ferrous complex was used as the indicator. The relative standard deviation of BOC determinations is generally < 1%0.
RESULTS AND DISCUSSION
Hydrocarbons
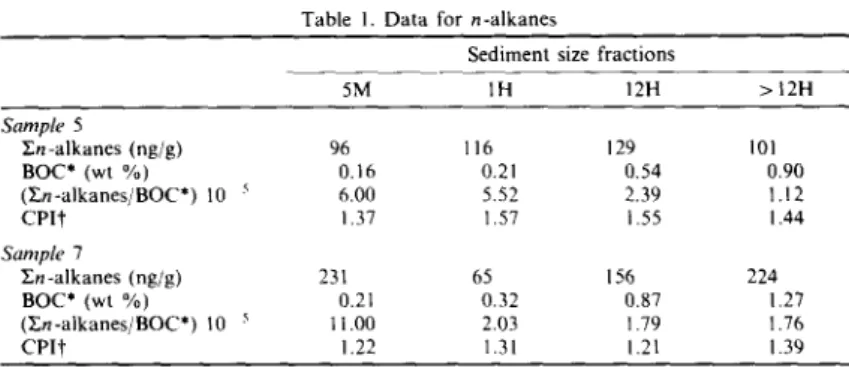
The presence of bound hydrocarbons in sediments is unusual (Van Vleet and Quinn, 1979a) and has been explained as being due to an adsorption on to mineral sites and/or as an association with humic material formed by the decomposition of higher plants (Farrington et al., 1977). A conclusion drawn by Shaw and Johns (1985) is that the bound hydro- carbons are made nonextractable by adsorption to inorganic particles. It is seen from Table 1 that the concentrations of En-alkanes are all below t h e / l g / g level and that BOC values increase with decreasing grain size. Organic matter concentrations in sedi- ments are often strongly related to grain size with an inverse relationship between TOC and grain size (Suess, 1973; Mayer et al., 1985). After being normal- ized to BOC, En-alkanes exhibit a decrease with decreasing particle size. The result suggests that the concentration of n-alkanes is not enhanced by the grain size effect. High-molecular-weight (>C24) n-alkanes with distinct odd carbon preference maxi- mizing at n-C29 or n-C31 are commonly used as an indicator for terrestrial input because of their pres- ence in higher plant waxes (Eglinton et al., 1962; Eglinton and Hamilton, 1967). The odd carbon preference in this range is often measured by the CPI. CPI values (in the C25-C3~ range) of the four size fractions vary little, or are roughly constant (Table 1). Barouxis et al. (1988) have reported the values
Table 1. D a t a for n-alkanes
Sediment size fractions
5M I H 12H > 12H Sample 5 E n - a l k a n e s (ng/g) 96 116 129 101 B O C * (wt %) 0.16 0.21 0.54 0.90 ( T n - a l k a n e s / B O C * ) 10 5 6.00 5.52 2.39 1.12 C P I t 1.37 1.57 1.55 1.44 Sample 7 Z;n-alkanes (ng/g) 231 65 156 224 BOC* (wt %) 0.21 0.32 0.87 1.27 ( E n - a l k a n e s / B O C * ) 10 ~ 11.00 2.03 1.79 1.76 C P I t 1.22 1.31 1.21 1.39
*BOC, bound organic carbon.
tCPI, carbon preference index, in the C~5 C~l range.
increasing from 0.9 (silt) to 1.0 (clay). A comparison between unbound and bound n-alkanes will help explain the result. As an example, the ratio of unbound to bound n-alkanes is ca 45 for sample 7 (unfractionated, Fig. 2), indicating that n-alkanes are concentrated in the unbound phase. The CPIs for unbound and bound n-alkanes in sample 7 are 1.9 and 1.3, respectively. The terrestrial contribution is
relatively weak in the bound phase which results in CPI values varying little with grain size.
F a t t y acids
While branched-chain fatty acids have been found in many organisms including marine phytoplankton (Nichols et al., 1984; Harvey et al., 1988), they are generally found in higher concentrations in bacteria
a) t - o Q. m r r
(A)
Pr tl ii 2 18 19 20 , / I B Ph5
~o
1'5 ,o
25
3o
a'5
4o
,is
I S 29 31 27 28 25 26 335'0
55
6'0 6r,
70
7;
8o
8'5
90
95
iS c 0 O. N i . r(B)
22 I 25 2"/ 28 2,9 30 19 20 21 L 2 3 24|2, e I I [ l 31 32 335
to
15 Zo 25 30 35
4~0 4'5 s'o 55 6'0 65 7'0 7'5
Time (rain) 348'0 8'~ 90 95
Fig. 2. GC traces of unbound (A) and bound (B) aliphatics from sample 7 (unfractionated). Numbers above the peaks refer to carbon number of n-alkanes; Pr = pristane; Ph = phytane. GC conditions are given in the text. Note that n-Cz2:0 was contaminated by the trace impurities from internal standard
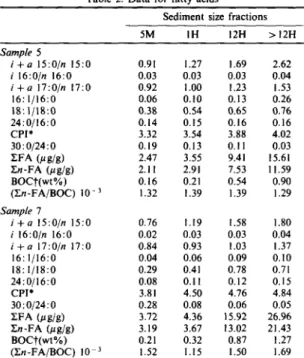
Grain size effect on bound lipids Table 2. Data for fatty acids
Sediment size fractions
5M IH 12H > 12H Sample 5 i + a 15:0/n 15:0 0.91 1.27 1.69 2.62 i 16:0/n 16:0 0.03 0.03 0.03 0.04 i + a 17:0/n 17:0 0.92 1.00 1.23 1.53 16:1/16:0 0.06 0.10 0.13 0.26 18:|/18:0 0.38 0.54 0.65 0.76 24:0/16:0 0.14 0.15 0.16 0.16 CPI* 3.32 3.54 3.88 4.02 30:0/24:0 0.19 0.13 0.11 0.03 EFA (,u g/g) 2.47 3.55 9.41 15.61 En-FA (ug/g) 2.11 2.91 7.53 11.59 BOC'['(wt %) 0.16 0.21 0.54 0.90 (En-FA/BOC) 10- 3 1.32 1.39 1.39 1,29 Sample 7 i + a 15:0/n 15:0 0.76 1.19 1.58 1.80 i 16:0/n 16:0 0.02 0.03 0.03 0.04 i + a 17:0/n 17:0 0.84 0.93 1.03 1.37 16:1/16:0 0.04 0.06 0.09 0.10 18:1/18:0 0.29 0.41 0.78 0.71 24:0/16:0 0.08 0.11 0.12 0.15 CPI* 3.81 4.50 4.76 4.84 30:0/24:0 0.28 0.08 0.06 0.05 ZFA (/~g/g) 3.72 4.36 15.92 26.96 En-FA (/~ g/g) 3.19 3.67 13.02 21.43 BOCt(wt%) 0.21 0.32 0.87 1.27 (Zn-FA/BOC) l0 3 1.52 1.15 1.50 1.69
*CPI, carbon preference index, in the C20-C30 range. tBOC, bound organic carbon.
than in other organisms (Perry et al., 1979; Volkman et al., 1980; Parkes and Taylor, 1983). This makes them a useful indicator of bacterial acid contribution to sediment. The ratio of branched-chain to normal fatty acids has been used as an index for measuring bacterial activity in different size fractions of sedi- ment (Barouxis et aL, 1988; Jeng, 1992). As shown in Table 2, the ratios of branched-chain to normal fatty acids increase as particle sizes decrease. The present result, to the first approximation, can be explained by the grain size effect alone. Effects caused by surface area are almost indistinguishable from effects due to grain size (Horowitz, 1985); as grain size decreases, surface area increases sharply. A positive linear corre- lation between TOC and sediment specific surface area has been demonstrated by Suess (1973) and Mayer et al. (1985). Linear regression of the ratios of branched-chain to normal fatty acids vs BOC gives highly significant correlations (Table 3), suggesting that bacterial activity is highly correlated with sedi- ment surface area. This is in accordance with the Table 3. Linear fitting coefficients for the ratio of branched-chain to normal fatty acids (BFA/NFA) vs bound organic carbon (BOC)
using the equation (BFA/NFA) = a + b (BOC) Correlation BFA/NFA a b coefficient (BFA/NFA) ~ a + b (BOC) Sample 5 i + a 15:0/n 15:0 0.664 2.12 0.984 i 16:0In 16:0 0.0262 0.0161 0.950 i + a 17:0/n 17:0 0.809 0.797 0.998 Sample 7 i + a 15:0/n 15:0 0.784 0.876 0.947 i 16:0/n 16:0 0.0209 0.0129 0.941 i + a 17:0/n 17:0 0.746 0.445 0.950 305 finding that bacterial populations in sediments are strongly correlated with sediment specific surface area (Dale, 1974; DeFlaun and Mayer, 1983). The monounsaturated to saturated fatty acid ratios demonstrate an increasing trend with decreasing grain sizes (Table 2). Gonzalez et al. (1985) have observed that the finest fraction (i.e. clay) is enriched in monounsaturated fatty acids--Cj6: ~ and C~s: 1. This reflects biological activity, particularly that of micro- organisms (Saliot et al., 1980; Volkman et al., 1980). The straight chain fatty acids exhibit a bimodal distribution with
C16:0
being the maximum and C24:0 the secondary maximum. The C24:0 acid is commonly considered to originate from higher plants and is absent from marine plants although four species of benthic diatoms have been shown to contain C24-C2s acids (Volkman et al., 1980). The C~6:0 acid, also found in higher plants, is the most common saturated fatty acid in marine organisms. TheC24:0/C16:0
ratio was employed by Leenheer et al. (1984) and LeBlanc et al. (1989) to determine the relative contribution of fatty acids from allochthonous (terrestrial) vs autochthonous (marine) sources. As seen in Table 2, the ratio increases progressively as grain size decreases, indicating an increase in terrestrial contri- bution. Compared with sample 7, a slight increase of this ratio is found in sample 5. The difference may be ascribed to the fact that sample 7 is located closer to land than sample 5. Generally the presence of higher molecular weight fatty acids (>C20) is taken to indicate higher plant contribution, especially from land (Cranwell, 1974; Simoneit, 1977; Kawamura and Ishiwatari, 1984; Jeng, 1989). Therefore, the CPI of fatty acids in this range is employed as an indicator of higher plant contribution to sediment. As shown in Table 2, CPI values increase progressively with decreasing grain size, indicating that higher plant contribution to bound fatty acids increases as grain sizes decrease. Additionally, the CPI values of each size fraction of sample 7 is higher than that of sample 5, meaning that sample 7 has received more contri- bution from land since it is located closer to land (Fig. 1).The relative abundances of >C24:0 fatty acids, eluting after the secondary maximum C2a:0, decrease with increasing carbon chain length. One interesting phenomenon shown on gas chromatograms is that the decreasing rate is faster for finer grains than for coarser grains, which is shown by the C30:0/C24:0 ratio (Table 2). In addition, En-fatty acids normalized to BOC exhibit no trend with grain size (Table 2), implying no grain size effect.
A l c o h o l s
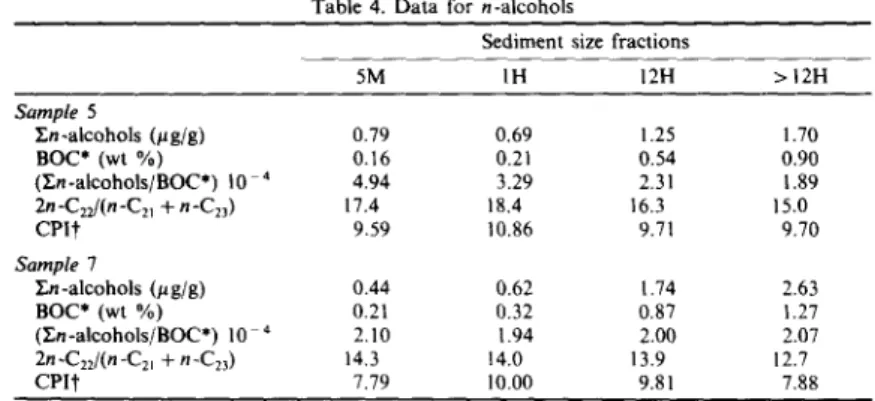
The concentrations of En-alcohols normalized to BOC exhibited a decrease (sample 5) or were virtually constant (sample 7) with decreasing grain size (Table 4), suggesting that they are not enhanced by the grain size effect. The distribution of n-alcohols maximizes at C22 for the four fractions of the two
Table 4. Data for n-alcohols
Sediment size fractions
5M IH 12H > 12H Sample 5 ~n-alcohols (Hg/g) 0.79 0.69 1.25 1.70 BOC* (wt %) 0.16 0.21 0.54 0.90 (~n-alcohols/BOC*) 10 4 4.94 3.29 2.31 1.89 2n-C2z/(n-Czl + n-C23 ) 17.4 18.4 16.3 15.0 CPI'j" 9.59 10.86 9.71 9.70 Sample 7 ~n-alcohols (#g/g) 0.44 0.62 1.74 2.63 BOC* (wt %) 0,21 0.32 0.87 1.27 (]~n-alcohols/BOC*) 10 4 2,10 1.94 2.00 2.07 2n -C2z/(n -C2~ + n-C23 ) 14, 3 14.0 13.9 12.7 CPIt" 7.79 10.00 9.81 7.88
*BOC, bound organic carbon.
tCPI, carbon preference index, in the CI4-C28 range.
samples; it is the general distribution pattern of n-alcohols (extractable and bound, Fig. 3) in sedi- ments in this area (Jeng and Han, 1993). This is unusual since higher plants generally have their m a x i m u m at higher carbon numbers while other organisms exhibit a m a x i m u m at shorter chain
lengths (Nevenzel, 1970; W a n n i g a m a et al., 1981). The source of this c o m p o n e n t in such high levels is as yet unknown; however, Cranwell (1981) suggests that decomposer organisms may be the source of the bound alcohols, centered on C22, present in the sediments. Assuming that n-C2~OH is mediated by
8
5 1 0 1 5 Phytol 19(IS) 222'0
(A)
24 26 16 20 I25 30 3s i0 4s s0 s5 60 8~ 70
7'5 3 0 + ? M GH JL 8o 8s ,Jo ~s too to ¢,- 0 D. f.O :> n," 5 10 15 2 0 Phytol 19(IS)(B)
16 25 3o 3s 4'0 4s 22 i I 24 A20
j ~
21 23 ,?.~ Z so 5s 60 65 7'0 Time (min) E I iN3O ÷?7'5
8o 8s 9o 9sto6
Fig. 3. GC traces of unbound (A) and bound (B) alcohols/sterols (as TMS ethers) from sample 7 (unfractionated). Numbers above peaks refer to carbon number of n-alcohols, Letters above peaks refer to sterols; see Table 6 for sterol identification. GC conditions are given in the text. Note that unbound phytol and the peak eluting right after the internal standard are artifacts due to the potential liberation
Grain size effect on bound lipids 307 microbial activities, the sediment grain size effect
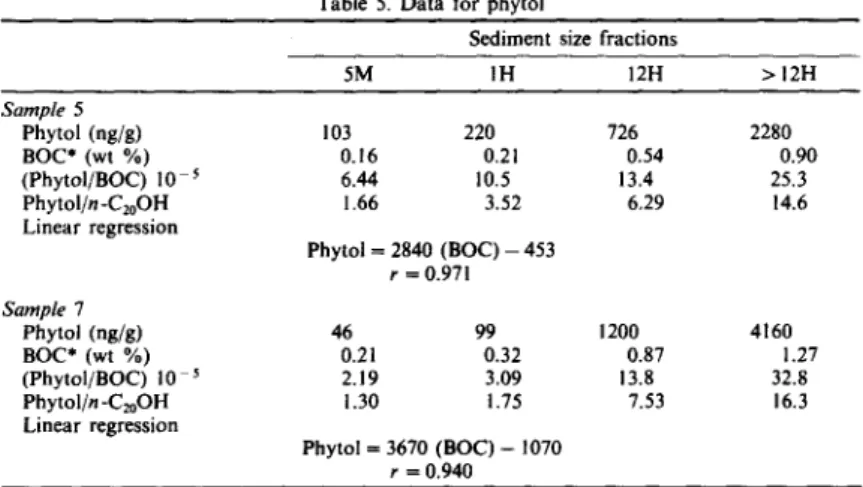
might shed some light on this interesting question based on the result that bacterial numbers or meta- bolic activities in sediments have a strong inverse correlation with sediment grain size (Dale, 1974; DeFlaun and Mayer, 1983). The ratio of 2n-C22/ n-C2t + n-C23 is employed as a relative measure of the degree of microbial activities on C22. Table 4 shows that the ratio decreases slightly with decreasing sediment particle size, suggesting that bacterial activi- ties seem not to be the source for the C22 maximum. Phytol is usually found in the extractable phase of sediments (Van Vleet and Quinn, 1979b), but it is found exclusively in the bound phase in this area (Jeng and Han, 1993). This indicates that rapid transformations are occurring on or prior to depo- sition of the likely source materials (Shaw and Johns, 1985). Degradation of the chlorophylls is likely to occur rapidly in lysed and senescent algal cells (Gillan and Johns, 1980) which are reasonable phytol sources in the sediment. Degradation o f chlorophyll pigments before or immediately following incorporation into the sediment would lead to the results observed and explain the presence of phytol in the bound fraction (Shaw and Johns, 1985). Phytol demonstrates a remarkable grain size effect in the two sediments. For comparison, phytol is normalized to BOC. This ratio increases sharply with decreasing sediment particle size (Table 5), suggesting increasing contribution of phytol derived from chlorophylls originating from microalgae. This effect can also be seen by normaliz- ing phytol to n-C20OH which is not specifically produced by photosynthetic organisms and has the same number of carbon atoms as phytol (Table 5). The result is interesting and is thought to be attributed to high phytol content compared to other areas around Taiwan and phytol being found exclusively in the bound phase.
This phenomenon has not been observed in an estuarine sediment from the Tan-shui river, north- western coast and in a shallow near-shore sediment
from Tung-shih, southwestern coast (Jeng, unpub- lished results). Apparently phytoplankton do not play a significant role in these sediments with a strong anthropogenic influence. It can therefore be con- cluded that the grain size effect on phytol is probably common to open ocean sediments where the over- lying water has abundant phytoplankton.
Sterols
As shown in Fig. 3, unbound sterols are similar in distribution to bound sterols. This may indicate that unbound and bound sterols have similar origins (Nishimura, 1977). The ratio of unbound to bound Y~sterols is 1.8 for sample 7 and 1.5 for sample 5. The four most abundant sterols are cholesta-5, 22E-dien-3fl-ol, cholest-5-en-3fl-ol, 24-methyl- cholesta-5,22E-dien-3fl-ol and 24-ethylcholest-5- en-3/~-ol. Of these sterols, 24-methylcholesta-5, 22E-dien-3fl-ol is a diatom sterol, and zooplankton (copepods and euphausiids) molts and fecal pellets contain predominantly cholesta-5,22E-dien-3fl-ol and cholest-5-en-3fl-ol (Gagosian et al., 1983). This indicates plankton as a major input source. In addition, the phytosterol 24-ethylcholest-5-en-3fl-ol generally found in epicuticular waxes of vascular plants (Scheuer, 1983; Goad, 1977) is also a signifi- cant sterol showing an important contribution from land plants.
In order to test the grain size effect on sterols, all major sterols are normalized to BOC. The BOC normalized major sterols of samples 5 and 7 are presented in Table 6; it shows that the ratios increase progressively with decreasing grain size, indicating that sterois are concentrated in the finer fractions. Further, since bacteria are known to transform stenols into stanols (Edmunds et al., 1980; Taylor et aL, 1981), it would be interesting to find out whether bound sterols are mediated by microbial activity. As shown in Table 6, some stanol/stenol ratios decrease with decreasing grain size; others show an increasing trend. The result suggests that
Table 5. Data for phytol
Sediment size fractions
5M 1H 12H > 12H Sample 5 Phytol (ng/g) BOC* (wt %) (Phytol/BOC) 10 s Phytol/n-C20OH Linear regression Sample 7 Phytol (rig/g) BOC* (wt %) (Phytol/BOC) 10 s Phytol/n -C2oOH Linear regression 103 220 726 2280 0.16 0.21 0.54 0.90 6.44 10.5 13,4 25.3 1.66 3.52 6.29 14.6 Phytol=2840 ( B O C ) - 4 5 3 r = 0.971 46 99 0.21 0.32 2.19 3.09 1.30 1.75 Phytol = 3670 (BOC) - 1070 r = 0.940 1200 0.87 13.8 7.53 4160 1.27 32.8 16.3
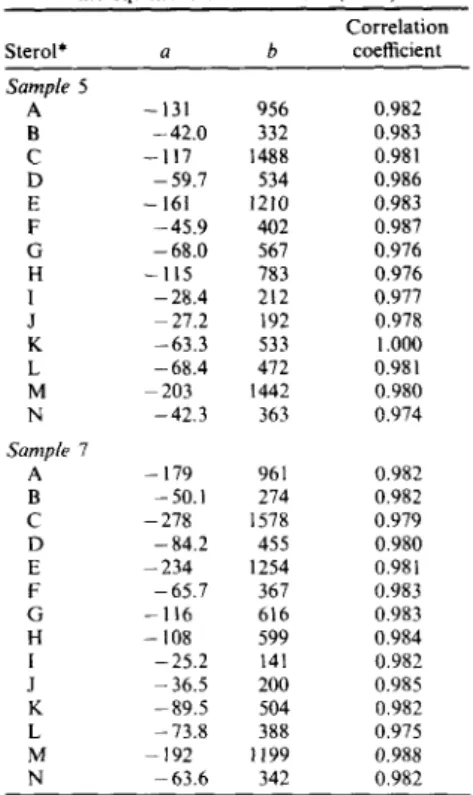
m i c r o b i a l a c t i v i t y d i d n o t a p p e a r to p l a y a d o m i n a n t role in t h e s t e n o l / s t a n o l t r a n s f o r m a t i o n a l t h o u g h s a m p l e 7 is l i g h t olive g r a y to olive g r a y in c o l o r i n d i c a t i n g r e d u c i n g e n v i r o n m e n t s a n d s a m p l e 5 is g r a y i s h b r o w n in c o l o r i n d i c a t i n g o x i d i z i n g e n v i r o n - m e n t s . P r o b a b l y t h e b o u n d s t e r o l s a r e m o r e r e s i s t a n t to d i a g e n e t i c a l t e r n a t i o n ( m i c r o b i o l o g i c a l a n d / o r c h e m i c a l ) in m i c r o b i o l o g i c a l l y - a c t i v e s e d i m e n t s a n d c a n s u r v i v e u n a l t e r e d in t h e s e d i m e n t s f o r a l o n g e r p e r i o d o f t i m e t h a n t h e u n b o u n d o n e s ( N i s h i m u r a , 1977). S t r o n g p o s i t i v e l i n e a r c o r r e l a t i o n s h a v e b e e n f o u n d f o r s t e r o l c o n c e n t r a t i o n a n d B O C ( T a b l e 7), i n d i c a t i n g t h e g r a i n size effect o n b o u n d s t e r o l s . By c o m p a r i n g t h e s l o p e s o f r e g r e s s i o n lines (coefficient b), t h e effect is s t r o n g e r f o r p r e d o m i n a n t s t e r o l s s u c h , as c h o l e s t a - 5 , 2 2 E - d i e n - 3 f l - o l , c h o l e s t - 5 - e n - 3 f l - o l , 2 4 - m e t h y l c h o l e s t a - 5 , 2 2 E - d i e n - 3 f l - o l a n d 2 4 - e t h y l - c h o l e s t - 5 - e n - 3 f l - o l t h a n f o r t h e o t h e r s t e r o l s . T h i s reflects t h a t p l a n k t o n c o n t r i b u t e d s i g n i f i c a n t l y to t h e effect. It is n o t e d t h a t t h e h i g h e r t h e s t e r o l c o n t e n t , t h e s t r o n g e r t h e g r a i n size effect.
Table 6, Major sterols normalized to bound organic carbon (BOC). Values are multiplied by l0 s
Sediment size fractions Sterolt 5M 1H 12H > 12H Sample 5 A 3.38104o* 4.00(0.3~1 5.4410 ~61 8.62i~ 35 I B 1.38 1.52 1.96 3.02 C 10.0010 ~6 ~ 11.0010.26/ 9.98f0.341 14.4010..~4 / D 2.56 2.86 3.39 4.93 E 4.44t0 42) 5.24(039 ) 7.0410361 10.93~034) F 1.88 2.05 2.56 3.69 G 2.88 2.81 3,24 5.27 H 2.56 2.95 4,07 7.04 1 0.88 0.90 1.17 1.93 J 0.63 0.81 1.04 1.73 K 1.69(089 ) 2.24(0791 4.02(o.641 4.671090 I L 1.50 1.76 2.59 4.22 M 4.98103~ I 5.761034 ) 7.961026 ) 12.981026 ) N 1.88 1.95 2.06 3.40 Sample 7 A 3.29t0.30~ 4-06(029~ 6.09(029~ 8.821029 ) B 1.00 1.19 1.75 2.53 C 6.19(028) 7.471o 26 ) 9.91 ~29) 14.72~029 ) D 1.71 1.91 2.85 4.20 E 4.331033 ) 5.3110.301 7.8910301 11.53io.291 F 1.43 1.59 2.37 3.39 G 2.00 2.56 3.91 5.64 H 2.19 2.59 3.90 5.50 I 0.57 0.59 0.91 1.30 J 0.76 0~81 1.31 1.83 K 1.95(0761 2,28(0.6~1 3.2310.721 4.6710.771 L 1.48 1.56 2.33 3.60 M 5.24~o221 5.93(02s I 8.31~026 ) II.lli0z~ 1 N 1.14 1.50 2.16 3.15
*Figures in parentheses give the 5ct-stanol: AS-stenol ratio for the major sterol pairs of identical carbon skeletons.
tSterol identifications are as follows: (A) cholesta-5,22E-dien- 31J-ol; (B) 5a-cholest-22E-en-3,8-ol; (C) cholest-5-en-3fl-ol; (D) 5ct-cholestan-3B-ol; (E) 24-methylcholesta-5,22E-dien-3~-ol; (F) 24-methyl-5ct-cholest-22E-en-3fl-ol; (G) 24-methylcholesta- 5,24(28)-dien-3 B-ol; (H) 24-methylcholest-5-en-3,8-ol + 24- methyl-5~t -cholest-24(28)-en-3,6 -o1(?); (I) 24-methyl-5~t - cholestan-3fl-ol; (j) 23,24-dimethylcholesta-5,22E-dien-3/J-ol; (K) 24-ethylcholesta-5,22E-dien-3/J-ol; (L) 24-ethyl-5~t-cholest- 22E-en-3~-ol; (M) 24-ethylcholest-5-en-31~-ol; (N) 24-ethyl-5ct- cholestan-3/J-ol + unknown.
Table 7. Linear fitting coefficient for sterol concen- tration (ng/g) vs bound organic carbon (BOC) using
the equation: Sterol = a + b (BOC) Correlation Sterol* a b coefficient Samp& 5 A - 131 956 0.982 B -42.0 332 0.983 C - 117 1488 0.981 D - 59.7 534 0.986 E - 161 1210 0.983 F -45.9 402 0.987 G -68.0 567 0.976 H - 115 783 0.976 I -28.4 212 0.977 J 27.2 192 0.978 K -63.3 533 1.000 L -68.4 472 0.981 M 203 1442 0.980 N -42.3 363 0.974 Samp& 7 A - 179 961 0.982 B - 50.1 274 0.982 C -278 1578 0.979 D - 84.2 455 0.980 E - 2 3 4 1254 0.981 F -65.7 367 0.983 G - 116 616 0.983 H -108 599 0.984 I -25.2 141 0.982 J - 36.5 200 0.985 K -89.5 504 0.982 L - 73.8 388 0.975 M -192 1199 0.988 N -63.6 342 0.982
*Sterol identifications as in Table 6.
SUMMARY
I n s u m m a r y , B O C n o r m a l i z a t i o n h a s b e e n u s e d to i n d i c a t e t h e g r a i n size effect o n b o u n d lipids. N o g r a i n size effect h a s b e e n f o u n d f o r t h e c o n c e n t r a t i o n s o f E n - a l k a n e s , E n - f a t t y a c i d s a n d ] ~ n - a l c o h o l s . P h y t o l a n d s t e r o l s d e r i v e d f r o m p l a n k t o n h a v e b e e n f o u n d to e x h i b i t a p r o n o u n c e d g r a i n size effect, s h o w i n g t h a t p l a n k t o n p l a y e d a p r e d o m i n a n t role. T h e effect is r e l a t i v e l y s t r o n g e r f o r p h y t o l t h a n f o r s t e r o l s , as i n d i c a t e d b y c o m p a r i n g t h e s l o p e s o f r e g r e s s i o n lines in T a b l e s 5 a n d 7. By u s i n g t h e r a t i o s o f b r a n c h e d - c h a i n to n o r m a l f a t t y a c i d s a n d t h e r a t i o s o f m o n o - u n s a t u r a t e d to s a t u r a t e d f a t t y acids, b r a n c h e d - c h a i n a n d m o n o u n s a t u r a t e d f a t t y a c i d s d e m o n s t r a t e t h e g r a i n size effect a t t r i b u t e d to m i c r o b i a l a c t i v i t y . H o w - ever, m i c r o b i a l a c t i v i t y d i d n o t a p p e a r to p l a y a s i g n i f i c a n t role f o r t h e n - C 2 2 O H m a x i m u m a n d s t a n o l / s t e n o l t r a n s f o r m a t i o n . A s s o c i a t e E d i t o r - - B . Simoneit
A c k n o w l e d g e m e n t s - - W e are grateful to Dr Bernd R. T.
Simoneit and two a n o n y m o u s reviewers for constructive c o m m e n t s and suggestions. This study was supported by the National Science Council, Republic o f China.
REFERENCES
Barouxis A., Scribe P., D a g a u t J. and Saliot A. (1988) Free and b o u n d lipids from equatorial surficial sediments
Grain size effect on bound lipids 309 separated as a function of particle size. Org. Geochem. 13,
773-783.
Boggs S., Wang W. C. and Chen J. C. (1974) Textural and compositional patterns of Taiwan shelf sediment.
Acta Oceanogr. Taiwanica 4, 13-56.
Brassel S. C. and Eglinton G. (1980) Environmental chem- i s t r y - A n interdisciplinary subject. Natural and pollutant organic compounds in contemporary aquatic environ- ments. In Analytical Techniques in Environmental Chem-
istry (Edited by Albaiges J.), pp. 1-22. Pergamon Press,
Oxford.
Chen M. P., Lo S. C. and Lin K. L. (1992) Composition and texture of surface sediment indicating the depositional environments off northeast Taiwan. Terres. Atmos.
Ocean. Sci. (ROC) 3, 395-418.
Chern C. S., Wang J. and Wang D. P. (1990) The exchange of Kuroshio and East China Sea water. J. Geophys. Res. 95, 16017-16023.
Cranwell P. A. (1974) Monocarboxylic acids in lake sedi- ment: Indicators, derived from terrestrial and aquatic biota, of paleoenvironmental trophic levels. Chem. Geol. 14, 1-14.
Cranwell P. A. (1981) Diagenesis of free and bound lipids in terrestrial detritus deposited in a lacustrine sediment.
Org. Geochem. 3, 79-89.
Dale, N. G. (1974) Bacteria in intertidal sediments: Factors related to their distribution. Limnol. Oceanogr. 19, 509 -518.
DeFlaun M. F. and Mayer L. M. (1983) Relationships between bacteria and grain surfaces in intertidal sedi- ments. Limnol. Oceanogr. 28, 873 881.
Edmunds K. L. H., Brassell S. C. and Eglinton G. (1980) The short-term diagenetic fate of 5ct-cholestan-3fl-ol:
in-situ radiolabelled incubations in algal mates. In Advances in Organic Geochemistry 1979 (Edited by
Douglas A. G. and Maxwell J. R.), pp. 427-434. Pergamon Press, Oxford.
Eglinton G. and Hamilton R. J. (1967) Leaf epicuticular waxes, Science 156, 1322-1335.
Eglinton G., Hamilton R. J., Raphael R. A. and Gonzalez A. G. (1962) Hydrocarbon constituents of the wax coat- ings of plant leaves: a taxonomic survey. Nature 193, 739-742.
Farrington J. W., Henrichs S. M. and Anderson R. (1977) Fatty acids and Pb-210 geochronology of a sedi- ment core from Buzzards Bay, Massachusetts. Geochim.
Cosmochim. Acta 41, 289-296.
Gagosian R. B., Volkman J. K. and Nigrelli G. E. (1983) The use of sediment traps to determine sterol sources in coastal sediments off Peru. In Advances in Organic Geo-
chemistry 1981 (Edited by Bjoroy M. et al.), pp. 369-379.
Wiley, Chichester.
Gaudette H. E., Flight W. R., Toner L. and Folger D. W. (1974) An inexpensive titration method for the determi- nation of organic carbon in recent sediments. J. Sedi.
Petrol. 44, 249-253.
Gillan F. T. and Johns R. B. (1980) Input and early diagenesis of chlorophylls in a temperate intertidal sediment. Mar. Chem. 9, 243-253.
Goad L. J. (1977) The biosynthesis of plant sterols. In Lipids
and Lipid Polymers in Higher Plants (Edited by Tevini M.
and Lichtenthaler H. K.), pp. 146-168. Springer Verlag. Gonzalez C., Saliot A. and Pillon P. (1985) n-Alkanes in an equatorial sedimentary environment: their distribution as a function of particle size. Int. J. Environ. Anal. Chem. 22, 47-59.
Harvey H. R., Bradshaw S. A., O'Hara S. C. M., Eglinton G. and Corner E. D. S. (1988) Lipid compo- sition of the marine dinoflagellate Scrippsiella trochoidea.
Phytochemistry 27, 1723-1729.
Horowitz A. J. (1985) A Primer on Trace Metal-Sediment
Chemistry. U.S. Geological Survey Water-Supply Paper
2277.
Hung G. W. and Chung Y. C. (1994) Sedimentation rates on the continental slope off eastern Taiwan. Mar. Geol. !19, 99-109.
Jeng W. L. (1986) Hydrocarbons in marine sediments off southwestern Taiwan. Proc. Natl. Sci. Counc. ROC(A)
10(2), 123-129.
Jeng W. L. (1989) Fatty acids as tools for geochemistry and marine environmental quality. Acta Oceanogr. Taiwanica 23, 43-52.
Jeng W. L. (1992) Effect of grain size on the distribution of fatty acids in coastal sediments. Acta Oceanogr.
Taiwanica 28, 46-57.
Jeng W. L. and Han B. C. (1993) Fatty alcohols and sterols in the continental margin sediments off northeastern Taiwan. Acta Oceanogr. Taiwanica 31, 65-72.
Kawamura K. and Ishiwatari R. (1984) Fatty acid geochem- istry of a 200 m sediment core from Lake Biwa, Japan. Early diagenesis and paleoenvironmental information.
Geochim. Cosmochim. Acta 48, 251-266.
LeBlanc C. G., Bourbonniere R. A., Schwarcz H. P. and Risk M. J. (1989) Carbon isotopes and fatty acids analysis of the sediments of Negro Harbour, Nova Scotia, Canada. Estuar. Coast. Shelf. Sci. 28, 261-276. Leenheer M. J., Flessland K. D. and Meyers P. A.
(1984) Comparison of lipid character of sediments from the Great Lakes and the Northwestern Atlantic. Org.
Geochem. 7, 141-150.
Lin S., Liu K. K., Chen M. P., Chen P. and Chang F. Y. (1992) Distribution of organic carbon in the KEEP area continental margin sediments. Terres. Atmos. Ocean. Sei.
(ROC) 3, 365-378.
Mayer L. M., Rahaim P. T., Guerin W., Macko S. A., Watling L. and Anderson F. E. (1985) Biological and granulometric controls on sedimentary organic matter of an intertidal mudflat. Estuar. Coast. Shelf Sci. 20, 491-503.
Metcalfe L. D. and Schmitz A. A. (1961) The rapid prep- aration of fatty acid esters for gas chromatographic analysis. Anal. Chem. 33, 363-364.
Nevenzel J. C. (1970) Occurrence, function and biosynthesis of wax esters in marine organisms. Lipids 5, 308-319. Nichols P. D., Jones G. J., De Leeuw J. W. and Johns
R. B. (1984) The fatty acid and sterol composition of two marine dinoflagellates. Phytochemistry 23, 1043 1047. Niino H. and Emery K. O. (1961) Sediments of shallow
portions of East China Sea and South China Sea. Geol.
Soc. Am. Bull. 72, 731-762.
Nishimura M. (1977) The geochemical significance in early sedimentation of geolipids obtained by saponification of lacustrine sediments. Geochim. Cosmochim. Acta 41, 1817-1823.
Parkes R. J. and Taylor J. (1983) The relationship between fatty acid distributions and bacterial respiratory types in contemporary marine sediments. Estuar. Coast. Shelf Sci.
16, 173-189.
Perry G. J., Volkman J. K., Johns R. B. and Bavor H. J. Jr (1979) Fatty acids of bacterial origin in contem- porary marine sediments. Geochim. Cosmochim. Acta 43, 1715-1725.
Pillon P., Jocteur-Monrozier L., Gonzalez C. and Saliot A. (1986) Organic geochemistry of Recent equatorial deltaic sediments. Org. Geochem. 10, 711-716.
Prahl F. G. and Carpenter R. (1983) Polycyclic aromatic hydrocarbons (PAH)-phase association in Washington coastal sediment. Geochim. Cosmochim. Acta 47, 1013-1023.
Saliot A., Tissier M. J. and Boussuge C. (1980) Organic geochemistry of the deep ocean-sediment interface and interstitial water. In Advances in Organic Geochemistry 1979 (Edited by Douglas A. G. and Maxwell J. R.), pp. 333-341. Pergamon Press, Oxford.
Scheuer P. J. (1973) Chemistry of Marine Natural Products, pp. 61-82. Academic Press.
Shaw P. M. and Johns R. B. (1985) Organic geochemical studies of a recent Inner Great Barrier Reef sediment--l. Assessment of input sources. Org. Geochern. 8, 147-156. Shieh Y. T. and Chen M. P. (1993) Late Quaternary paleoceanography as indicated by the assemblage of planktonic foraminifera from cores off northeastern Taiwan. Acta Oceanogr. Taiwanica 30, 43-65 (in Chinese with English abstract).
Simoneit B. R. T. (1977) Diterpenoid compounds and other lipids in deep-sea sediments and their geochemical significance. Geochim. Cosmochim. Acta 41,463-476. Suess E. (1973) Interaction of organic compounds with
calcium carbonate--II. Organo-carbonate association in Recent sediments. Geochirn. Cosrnochirn. Acta 37, 2435-2447.
Taylor C. D., Smith S. O. and Gagosian R. B. (1981) Use of microbial enrichments for the study of the anaerobic degradation of cholesterol. Geochirn. Cosmochim. Acta
45, 2161-2168.
Thompson S. and Eglinton G. (1978) The fractionation of a Recent sediment for organic geochemical analysis.
Geochirn. Cosmochirn. Acta 42, 199-207.
Van Vleet E. S. and Quinn J. G. (1979a) Diagenesis of marine lipids in ocean sediments. Deep-Sea Res. 26A,
1225-1236.
Van Vleet E. S. and Quinn J. G. (1979b) Early diagenesis of fatty acids and isoprenoid alcohols in estuarine and coastal sediments. Geochirn. Cosrnochirn. Acta 43, 289-303.
Volkman J. K., Johns R. B., Gillan F. T., Perry G. J. and Bavor H. J. Jr (1980) Microbial lipids of an intertidal sediment--l. Fatty acids and hydrocarbons. Geochirn. Cosrnochirn. Acta 44, 1133-1143.
Wannigama G. P., Volkman J. K., Gillan F. T., Nichols P. D, and Johns R. B. (1981) A comparison of lipid components of the fresh and dead leaves and pneumatophores of the mangrove Avicennia marina. Phytochernistry 20, 659-666.