Control of Dye Aggregation and Electron Injection for Highly Efficient Porphyrin
Sensitizers Adsorbed on Semiconductor Films with Varying Ratios of Coadsorbate
Hsueh-Pei Lu,†Chen-Yuan Tsai,†Wei-Nan Yen,‡Chou-Pou Hsieh,‡ Cheng-Wei Lee,†,‡ Chen-Yu Yeh,*,‡and Eric Wei-Guang Diau*,†
Department of Applied Chemistry and Institute of Molecular Science, National Chiao Tung UniVersity, Hsinchu 300, Taiwan, and Department of Chemistry, National Chung Hsing UniVersity, Taichung 402, Taiwan ReceiVed: August 22, 2009; ReVised Manuscript ReceiVed: October 21, 2009
We report the photovoltaic performances and kinetics of femtosecond fluorescence for three zinc-porphyrin sensitizers (YD0-YD2) coadsorbed with chenodeoxycholic acid (CDCA) at three molar ratios on nanocrystalline semiconductor (TiO2 or Al2O3) films. The addition of CDCA improved the efficiencies of YD0 and YD1 so that their maximum performance occurred at a dye/CDCA ratio of 1:2, but the presence of CDCA had a negative effect for YD2. Porphyrin aggregation on TiO2surfaces not only accelerates the rate of intermolecular energy transfer but also increases the rate of interfacial electron injection, so that the electron injection yields (Φinj) are balanced by these two important factors. As a result, Φinj increased slightly with increasing amount of CDCA for both YD0 and YD1, but decreased for YD2; for this reason, the presence of CDCA failed to improve the photovoltaic performance for YD2, unlike for YD0 and YD1. The cell performances were optimized on TiO2films of∼10-µm thickness with a scattering layer of ∼4-µm thickness: the efficiencies of power conversion of YD1 and YD2 are slightly smaller than, but near, that of N719, being 6.5% and 6.8%, respectively, compared to 7.3%. Without a scattering layer on the films, the performance of N719 was degraded significantly (6.3%), whereas the efficiencies of YD1 and YD2 decreased only slightly (6.4% and 6.6%), making this series of green sensitizers promising candidates for future light-penetrable photovoltaic applications.
1. Introduction
With advantages of low cost, low weight, coloring, and easy processing, dye-sensitized solar cells (DSSCs) are prospective alternatives for future devices for the conversion of solar energy, complementary to silicon-based solar cells.1DSSC devices with Ru complexes as photosensitizers have attained the greatest efficiency of power conversion, η ≈ 11%,2 but a limited availability of Ru dyes and associated environmental concerns have stimulated much effort to find alternative, cheaper, and safer organic-based dyes.3 Among those non-Ru-based dyes, porphyrin chromophores are promising candidates because they capture solar energy efficiently. Numerous reports of porphyrin-based DSSC have appeared.3d,4 For example, a DSSC device with porphyrin sensitizers and a π-conjugated anchoring group functionalized at the β-position was reported to attain an efficiency of power conversion of η ) 7.1%,4b and a device made of a β,β′-edge-fused zinc porphyrin with quinoxaline moiety exhibited a comparable cell performance, η ) 6.3%.3d We reported a novel zinc porphyrin dye (YD1)5that has in its molecular structure an electron-donating diarylamino group attached at the meso position of the porphyrin ring opposite the meso-substituted phenylethynyl carboxyl anchoring group; a device made from this YD1 dye was found to have a cell performance similar to that of a Ru-based DSSC, making the push-pull porphyrin the most efficient green dye for DSSC applications.5
The effect of aggregation on the TiO2 surface is an important issue in further improving the cell performance of porphyrin-based DSSCs.4-6Aggregates do not contribute to photocurrent generation in devices made of tetrachelate porphyrin chromophores,4c and some push-pull porphyrins likewise suffer from dye aggregation.5 To suppress dye ag-gregation on the TiO2surface, a remedy is to add a coadsorbate into the dye solution when fabricating sensitized TiO2films into devices. The most popular coadsorbate is chenodeoxycholic acid (CDCA),4a,5but other coadsorbates with either long alkyl chains (e.g., hexadecylmalonic acid or HDMA)7or bulky groups [e.g., dineohexyl bis(3,3-dimethylbutyl)phosphinic acid, or DINHOP]8 have also been reported. We report here results of our systematic characterizations of three zinc porphyrin sensitizers, YD0-YD2 (Chart 1), coadsorbed with CDCA at three ratios on TiO2films with thicknesses of 5-10 µm with and without an added scattering layer with a thickness of ∼4 µm. Without a diary-lamino group, YD0 served as a reference for comparison with YD1 and YD2. The diarylamino motif has been commonly applied in the preparation of push-pull organic dyes for HOMO-LUMO tuning.9YD2 was modified from YD1 in that * Corresponding authors. E-mail: [email protected] (C.-Y.Y.),
[email protected] (E.W.-G.D.). †National Chiao Tung University. ‡National Chung Hsing University.
CHART 1: Molecular Structures of Three Zinc Porphyrin Sensitizers
10.1021/jp908100v 2009 American Chemical Society Published on Web 11/16/2009
the two tert-butyl groups in the diarylamino substituent were replaced with two long alkyl chains to improve its thermal and photochemical stability in a device.10This design mimics the strategy applied in an amphiphilic ruthenium polypyridyl sensitizer (Z907) that has shown excellent stability toward water-induced desorption under both thermal stress and light-soaking conditions.11The cell performances of YD0 and YD1 improved upon addition of CDCA at a dye/CDCA ratio of 1:2, whereas that of YD2 decreased in the presence of CDCA. With femtosecond fluorescence up-conversion applied to both por-phyrin-sensitized TiO2 and Al2O3 films, we estimated the electron-injection yield (Φinj) for YD0-YD2 and rationalized the discrepancy between YD1 and YD2.
2. Results and Discussion
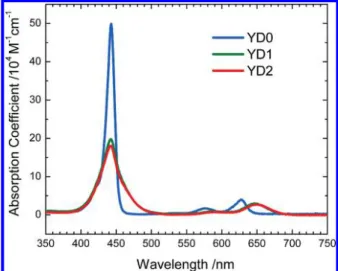
The syntheses of YD0 and YD1 are described elsewhere,5 and that of YD2 is available in the Supporting Information. Figure 1 shows absorption spectra of YD0-YD2 in ethanol solution. Because of the electronic coupling between the aromatic substituent and the porphyrin ring, the Soret bands of YD1 and YD2 are broader and the Q bands of YD1 and YD2 are significantly shifted toward longer wavelengths compared to YD0. The absorption spectra of YD1 and YD2 are similar, apart from a slightly red-shifted shoulder of the Q band of YD2. The spectral features of YD1 and YD2 with broad Soret band and red-shifted Q bands serve to increase the harvesting of solar energy in a DSSC device, as explained in the following section. 2.1. Photovoltaic Properties of YD0-YD2 Coadsorbed with CDCA at Varying Ratios. These three porphyrins were sensitized on TiO2 films with thicknesses of L ≈ 5 µm and fabricated into DSSC devices to characterize their photovoltaic performance (Supporting Information). The photovoltaic mea-surements were performed with five identical working electrodes for each porphyrin (YD0-YD2) coadsorbed with CDCA at varying molar ratios under the same experimental conditions. The raw data for each current-voltage (J-V) measurement are summarized in Tables S1-S4 (Supporting Information) for YD0-YD2 and N719, respectively; the corresponding averaged photovoltaic parameters are summarized in Table 1. Figure 2a-c shows typical J-V curves (working electrode a in Tables S1-S3 in the Supporting Information) of the porphyrin-based DSSC devices for YD0-YD2, respectively, with CDCA at varying molar ratios as indicated. Our results demonstrate two important points: the efficiencies of power conversion of YD1 and YD2 are significantly greater than those of YD0, reflecting the values
of the short-circuit photocurrent density (JSC), and the addition of CDCA improved both the open-circuit voltage (VOC) and the filling factor (FF) for all sensitizers. VOCand FF in the presence of CDCA increase through suppression of dye aggregation4a,5 to increase the injected electrons and modification of the TiO2 electrode surface to increase electron interception.3bJ
SChas a maximum value at a dye/CDCA ratio of 1:2 for YD0 and YD1, in contrast with a maximum of JSCin the absence of CDCA for YD2. The loading of dye (Table 1) systematically decreased with decreasing ratio of dye to CDCA for all three sensitizers; this trend is consistent with the variation of JSCin YD2. The presence of CDCA thus failed to improve the cell performance of YD2, unlike for YD0, YD1, and other porphyrin sensitizers. For TiO2films with a thickness of∼5 µm, the performance of the YD2 device in the absence of CDCA attained an efficiency of η ) 5.7%, slightly greater than that of N719 (η ) 5.5%) through the significantly greater JSCof the former (11.0 vs 9.3 mA cm-2).
Figure 3a-c shows spectra for the incident photon to current conversion efficiency (IPCE) of the same DSSC devices whose
J-V characteristics appear in Figure 2a-c; the dashed curves
represent the corresponding light-harvesting efficiencies (LHE) obtained from absorption spectra of the sensitized TiO2films. Integrating the IPCE over the AM 1.5G solar spectrum yields a calculated JSC value similar to the collected value for all devices under investigation (Supporting Information Figure S1), thus validating the J-V results shown in Figure 2. The IPCE spectra of YD0-YD2 mimic the corresponding LHE spectra in the range of 400-700 nm. We deduced two features from our IPCE results to account for the cell performances of YD1 and YD2 being superior to that of YD0. First, the IPCE spectra of YD1 and YD2 exhibit Soret and Q bands that are broadened and red-shifted relative to those of YD0, improving the light harvesting of the former. Second, the gaps between the LHE and IPCE spectra of YD1 and YD2 (20%) are smaller than that of YD0 (∼30%), thereby increasing the capabilities of electron injection and charge collection for the former. As a result, the
JSCvalues of YD1 and YD2 are significantly greater than that of YD0. The presence of CDCA decreases the LHE for all porphyrins, but the IPCE spectra of YD0 and YD1 differ from that of YD2; the IPCE values are greatest for YD0 and YD1 for a dye/CDCA ratio of 1:2, whereas the IPCE spectrum of YD2 varies little with dye/CDCA ratio. The IPCE results shown in Figure 3 are thus consistent with the J-V results shown in Figure 2.
2.2. Enduring Charge-Separation States of YD1 and YD2 on TiO2Films. The absorption (or LHE) spectra of the YD1/
TiO2and YD2/TiO2films feature an additional band at about ∼800 nm, which YD0 lacks. As the IPCE spectra of YD1 and YD2 show no signal near ∼800 nm, this 800-nm absorption band makes no contribution to photocurrent generation. In our work on the spectroelectrochemistry of YD1, two characteristic bands at∼800 and ∼1350 nm were unambiguously observed for the oxidized species of YD1.5Such a spectral feature for the YD1/TiO2and YD2/TiO2films thus indicates the formation of the dye cationic species. To confirm this deduction, we performed additional experiments in three steps and observed the following results (Figure 4): (i) the 800- and 1350-nm bands were absent when we initially prepared a YD1/TiO2film under dark conditions, (ii) the two characteristic absorption bands appeared after the film was exposed to a lamp (100 mW cm-2) for 1 min, and (iii) this spectral feature persisted until the film was further rinsed with a ferrocene/tert-butanol solution that eliminated the cationic spectral feature because YD1+became
reduced to YD1 by ferrocene; the same is true for YD2. We thereby confirmed that the appearance of the absorption band at 800 nm is due to the formation of an enduring cationic state of YD1 or YD2 on a TiO2 film after photoinduced charge separation; this result implies the excellent character of charge separation in the YD1/TiO2and YD2/TiO2films with protracted charge recombination.
The observed retardation of charge recombination might reflect an optimal spatial separation between the amino moiety and the TiO2surface reported for a Ru-dye system.12 For the porphyrin system, the period for charge recombination of a triarylamine-substituted porphyrin/TiO2film is 20 times that of a free-base porphyrin counterpart (80 vs 4 ms).13The smaller VOC of porphyrin-sensitized solar cells reflects a decreased electron lifetime related to a rapid recombination of electrons with either dye cations or I3
-ions.14In our work, an enduring charge separation in porphyrin-sensitized TiO2films implies that the interception of conduction-band electrons is controlled solely by recombination of electrons with I3-. That the observed VOC value in a YD1- or YD2-based DSSC is larger than those in YD0- and other porphyrin-based devices4,14is thus inferred to be due to the diminished recombination between I3
-and
conduction-band electrons, because I3
-might attach to the positively charged diarylamino moiety far from the TiO2surface. 2.3. Effect of CDCA on APCE Spectra. JSC plays an important role in the efficiency of DSSC devices; the cell performance with varying CDCA ratio can thus be understood from the IPCE spectra in Figure 3. At each wavelength λ, the IPCE depends on the LHE, the quantum yield of electron injection (Φinj), and the efficiency of charge collection at the counter electrode (ηc) according to the expression1b,15
Because LHE(λ) reflects the native absorption ability of a dye to capture the solar energy at wavelength λ, it is helpful to understand the electron-transport kinetics by expressing the absorbed photon to current conversion efficiency (APCE) according to15
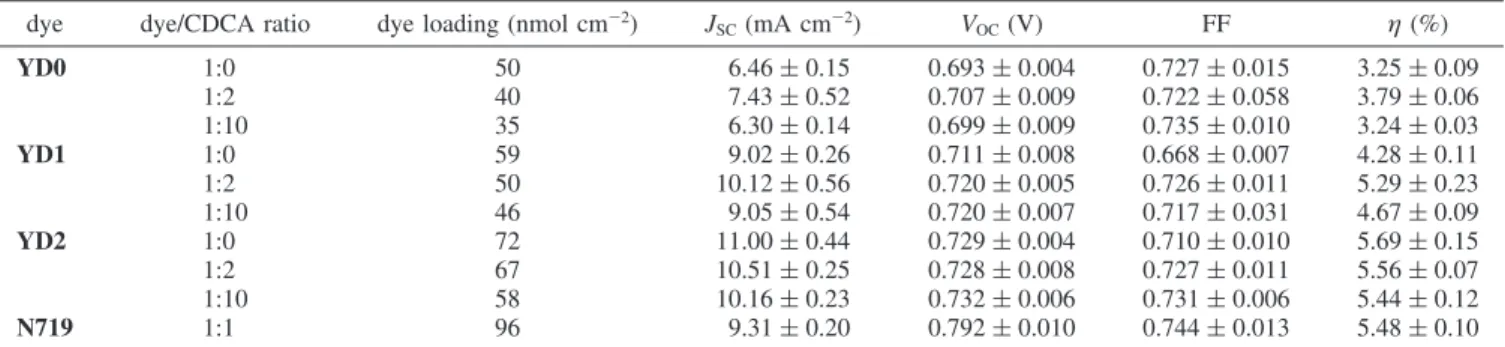
TABLE 1: Photovoltaic Parameters of DSSCs with TiO2Films (L≈ 5 µm) Sensitized with YD0-YD2 and N719 Coadsorbed
with Varying CDCA Ratios under Simulated AM-1.5 Illumination (Power ) 100 mW cm-2) and an Active Area of 0.16 cm2 a
dye dye/CDCA ratio dye loading (nmol cm-2) JSC(mA cm-2) VOC(V) FF η (%)
YD0 1:0 50 6.46 ( 0.15 0.693 ( 0.004 0.727 ( 0.015 3.25 ( 0.09 1:2 40 7.43 ( 0.52 0.707 ( 0.009 0.722 ( 0.058 3.79 ( 0.06 1:10 35 6.30 ( 0.14 0.699 ( 0.009 0.735 ( 0.010 3.24 ( 0.03 YD1 1:0 59 9.02 ( 0.26 0.711 ( 0.008 0.668 ( 0.007 4.28 ( 0.11 1:2 50 10.12 ( 0.56 0.720 ( 0.005 0.726 ( 0.011 5.29 ( 0.23 1:10 46 9.05 ( 0.54 0.720 ( 0.007 0.717 ( 0.031 4.67 ( 0.09 YD2 1:0 72 11.00 ( 0.44 0.729 ( 0.004 0.710 ( 0.010 5.69 ( 0.15 1:2 67 10.51 ( 0.25 0.728 ( 0.008 0.727 ( 0.011 5.56 ( 0.07 1:10 58 10.16 ( 0.23 0.732 ( 0.006 0.731 ( 0.006 5.44 ( 0.12 N719 1:1 96 9.31 ( 0.20 0.792 ( 0.010 0.744 ( 0.013 5.48 ( 0.10
aPhotovoltaic parameters are average values obtained from analysis of J-V curves of five identical working electrodes for each device
fabricated and characterized under the same experimental conditions. The raw data of each J-V measurement are summarized in Tables S1-S4 (Supporting Information); the uncertainties represent two standard deviations of the measurements.
Figure 2. Current-voltage characteristics of DSSC devices (working
electrode a in the Supporting Information) with sensitizers of (a) YD0, (b) YD1, and (c)YD2 coadsorbed with CDCA in three ratios on a TiO2
film with a thickness of ∼5 µm under illumination with simulated AM1.5G full sunlight (100 mW cm-2) and an active area of 0.16 cm2.
Figure 3. Corresponding action spectra for the efficiency of conversion
of incident photons into current (IPCE) of the same DSSC devices as used for Figure 2. Dashed curves show the corresponding spectra of light-harvesting efficiency (LHE).
IPCE(λ) ) LHE(λ)Φinjηc (1)
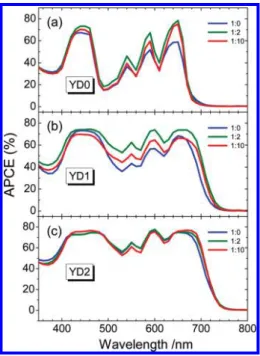
Figure 5a-c displays APCE spectra for YD0-YD2, respec-tively. The APCE values depend strongly on λ for YD0, but are less sensitive to λ in the visible region for YD1 and YD2; the effect of CDCA on APCE is more pronounced for YD1, whereas the presence of CDCA has almost no influence on APCE for YD2. As APCE involves two parameters, namely, Φinjand ηc, the factor affecting the photovoltaic performances of these devices is understandable if one parameter can be well characterized. To estimate Φinjfor the corresponding devices, we therefore measured femtosecond fluorescence up-conversion for TiO2 films with thicknesses of 5 µm sensitized with YD0-YD2 with CDCA added at various ratios.
2.4. Femtosecond Fluorescence Decays of YD0-YD2 on TiO2 and Al2O3 Films. To investigate the dynamics of
interfacial electron injection in porphyrin-sensitized TiO2films, we measured femtosecond fluorescence decays with porphyrin-sensitized Al2O3films serving as references. The nanocrystalline TiO2films were prepared by the same method as was used for photovoltaic measurements; the preparation of nanocrystalline
Al2O3films of the same thickness (L≈ 5 µm) is described in Supporting Information. To ensure that the amounts of dye loading on the two films are similar, we controlled the absorbances of the porphyrins on TiO2and Al2O3films to be equal; the corresponding absorption spectra are shown in Figure S2 (Supporting Information).
Parts a-c of Figure 6 show normalized steady-state emission spectra of TiO2films of YD0-YD2, respectively; parts d-f of Figure 6 show the normalized steady-state emission spectra of Al2O3films of YD0-YD2, respectively. These results indicate three important features: (i) the thin-film spectra exhibit a broad red-shifted spectral feature relative to their solution spectra, indicating the significance of dye aggregation on the surface of semiconductors; (ii) the emission spectra of YD1 on Al2O3films are shifted toward the solution spectra upon addition of CDCA at various ratios, but the spectral shifts of YD2 are insensitive to the presence of CDCA on either film; and (iii) the relative intensities of the emissions of the Al2O3films are significantly greater than those of the corresponding TiO2films, indicating the occurrence of electron injection from the excited state of a porphyrin to the conduction band of TiO2. Thus time-resolved information is crucial for understanding the details of electron injection occurring at the dye/TiO2interface and the intermo-lecular energy transfer of the dye molecules on the surface of the films.
With excitation of thin-film samples at 430 nm,4h,6b the emissions at the maximum intensity were optically gated with the fundamental pulse (860 nm) to yield the emission decays of YD0-YD2 on TiO2 films as shown in Figure 7a-c, respectively, and on Al2O3 films as shown in Figure 7d-f, respectively. These transients show decays much more rapid for YD1 and YD2 than for YD0 and for TiO2films than for Al2O3 films, but slower when more CDCA is added; such a feature was not obvious for YD2. The temporal profiles of all thin-film samples are characterized with a multiexponential decay; the corresponding time coefficients were obtained on analyzing the data with a parallel kinetic model
In this model, we assume that A, A′, and A′′ are excited-state species of the dye molecule at separate sites of the surface of the semiconductor undergoing nonradiative relaxations through distinct channels to the corresponding dark states, B, B′, and B′′; τ1, τ2, and τ3 are their corresponding first-order decay coefficients. For Al2O3 films, three decay components are required to fit the fluorescence transients; for TiO2films, only two components are sufficient for the fits. The detailed decon-voluted components of the fitted curves are shown in Figures S3-S5 (Supporting Information) for YD0-YD2, respectively. The relaxations of porphyrins on TiO2and Al2O3films exhibit such a multiple-exponential feature because of the surface inhomogeneity of the semiconductors. To resolve the kinetics resulting from energy transfer and electron injection, we averaged the time coefficients according to the amplitude-averaged decay periods,16i.e., τ
TiO2) τ1A1+ τ2A2and τAl2O3) τ1A1+ τ2A2+ τ3A3; Airepresents the relative amplitudes, subject Figure 4. Absorption spectra of a YD1/TiO2film (L≈ 5 µm) under
consecutive processing. The film was (i) prepared initially in a dark environment, (ii) then irradiated with simulated sunlight (100 mW cm-2) for 1 min, and (iii) finally rinsed with drops of a ferrocene/tert-butanol solution. The inset shows the corresponding enlarged spectra.
Figure 5. Spectra for the efficiency of conversion of absorbed photons
to current (APCE) transformed from the corresponding IPCE and LHE spectra according to eq 2. A 98 τ1 B A′ 98 τ2 B′ A′′ 98 τ3 B′′
to the condition∑iAi) 1.0. The corresponding rate coefficients were determined according to kTiO2) τTiO2-1and kAl2O3) τAl2O3-1. The emission decays of the porphyrin/Al2O3films reflect only the intermolecular energy transfer because of aggregation of the dye on the Al2O3surface, but the emission decays of the porphyrin/TiO2 films not only contain the aggregate-induced energy transfer but also reflect the rapid electron injection from the excited state of the dye into the conduction band of TiO2. If we assume that the extents of dye aggregation on the two films are similar, based on the same amounts of dye molecules adsorbed on the films with similar nanostructural morphologies, the rate coefficient for electron injection from an excited porphyrin into the TiO2surface is determined by kinj≈ kTiO2
- kAl2O3. These amplitude-averaged kinetic parameters for YD0-YD2 with varying CDCA ratios sensitized on the TiO2 and Al2O3films are summarized in Table 2.
The rate coefficients (kAl2O3) for aggregate-induced energy transfer decrease in the order YD2> YD1 > YD0 in the absence of CDCA, but the decrease of the rate coefficients in the presence of CDCA is in the oppositely order; e.g., for a dye/ CDCA ratio varying from 1:0 to 1:10, the values of kAl2O3for YD0 decreased by two-thirds, but those of YD2 decreased by only∼20%. The large kAl2O3values and great spectral shifts of films vs solution (Figure 6f) of YD2 indicate the occurrence of dye aggregation to some extent on semiconductor films, but the small variation of kAl2O3 and the small spectral shifts with
Figure 6. Steady-state fluorescence spectra of samples (L≈ 5 µm) of the same type as used for measurements of femtosecond fluorescence
up-conversion: YD0-YD2 with varying CDCA ratios coadsorbed on (a-c) TiO2films and (d-f) Al2O3films.
Figure 7. Femtosecond fluorescence decays of samples (L≈ 5 µm) obtained from measurements of femtosecond fluorescence up-conversion:
increasing amount of CDCA imply that the coadsorbate cannot effectively suppress porphyrin aggregation for YD2. The porphyrins hence seemed to form aggregate clusters on semi-conductor films. When CDCA is added for YD0 and YD1, the coadsorbate might enter the interspace of each cluster so that
kAl2O3decreases substantially; for YD2, CDCA might enter the interspace of the aggregate clusters less effectively, probably because of the hindrance of the two hydrophobic hexyl chains, so that kAl2O3decreases only slightly.
The rate coefficients (kinj) for electron injection of YD1 and YD2 are significantly larger than that of YD0, reflecting the superior electron-donating ability of the former with the dia-rylamino substituents. The values of kinjalso depend on the dye/ CDCA ratio for all three porphyrins: the more CDCA added, the smaller the value of kinj. For an increas in the dye/CDCA ratio from 1:0 to 1:10, kinjdecreased in the order YD0> YD1 ≈ YD2. Porphyrin aggregation on TiO2surfaces thus not only accelerates the rate of intermolecular energy transfer, represented by kAl2O3, but also increases, to some extent, the rate of interfacial electron injection represented by kinj, so that the yields of electron injection are balanced by these two important factors. Electron injection from an electronically excited state of a porphyrin into the conduction band of TiO2competes with other radiative or nonradiative relaxation channels. The quantum yield, Φinj, for electron injection, which defines the fraction of photons absorbed by the porphyrin that become converted into electrons in the conduction band of TiO2, is formulated as
where kagg represents the nonradiative rate coefficient for aggregate-induced energy transfer so that it is equal to kAl2O3. kr and knrrepresent the rate coefficients for radiative and other nonradiative (e.g., intersystem crossing) processes, respectively. The values of Φinjcalculated according to eq 3 are summarized in the rightmost column of Table 2. For both YD0 and YD1, Φinjincreased slightly with increasing amount of CDCA because the rate of energy transfer decreased more than the rate of electron injection, but Φinjdecreased slightly with increasing amount of CDCA for YD2 because the variation of the rate coefficients was in the other direction. Even though the variations are within the experimental uncertainties, our results are consistent with the presence of CDCA not improving the photovoltaic performance for YD2 as it did for YD0 and YD1.
Because of similar APCE values for YD1 (1:2) and YD2 (1:0), Φinjfor YD1 being larger than that for YD2 implies that the efficiency of charge collection of YD2 is superior to that of YD1 through an advantage of two long hydrophobic alkyl chains in the diarylamino group of YD2.
2.5. Optimization of Cell Performance for YD0-YD2 on Thicker TiO2 Films. At the optimal conditions for the
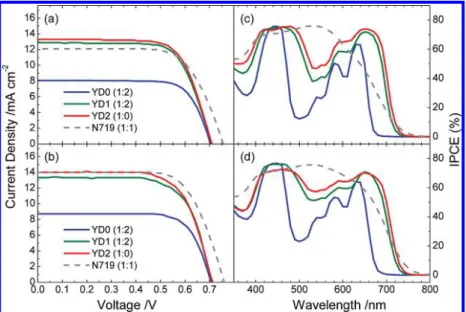
YD0-YD2 devices, we performed photovoltaic measurements for the three porphyrins sensitized on TiO2films with thicknesses of∼10 µm without and with an added scattering layer with a thickness of ∼4 µm. We similarly performed photovoltaic measurements of YD0-YD2 and N719 with three identical working electrodes under the same experimental conditions. The raw data for each current-voltage (J-V) measurement are summarized in Tables S5 and S6 (Supporting Information) for TiO2films without and with the scattering layer, respectively; the corresponding average photovoltaic parameters are sum-marized in Table 3. Figure 8a,b shows typical J-V curves (working electrode a in Tables S5 and S6, Supporting Informa-tion) for TiO2 films without and with the scattering layer, respectively; the corresponding IPCE spectra appear in Figure 8c,d. Integrating the IPCE over the AM 1.5G solar spectra again yielded calculated JSC values that matched perfectly with the collected values for all devices under investigation (see Figure S6 in the Supporting Information).
Our results indicate that both YD1 (1:2) and YD2 (1:0) exhibit remarkable performances relative to N719 (1:1) without a scattering layer; the performance of YD0 (1:2) is significantly less than that of the others. YD2 performs even better than YD1 because the larger JSCvalue results from the more intense and broader IPCE spectrum shown in Figure 8c. The JSCvalues of these two promising porphyrin-based devices, YD1 and YD2, are greater than that of the N719 device. Even though the VOC and FF values for the former are smaller than those for the latter, the net effects of these variations make the overall efficiencies of power conversion of the YD1 and YD2 devices superior to that of the N719 device. YD1 (η ) 6.4%) and YD2 (η ) 6.6%) are thus two green sensitizers that are remarkable for their outstanding cell performances relative to that of N719 (η ) 6.3%) without an added scattering layer for green-light-penetrable DSSC applications.
When TiO2films with thicknesses of∼10 µm were covered with a scattering layer with a thickness of ∼4 µm, the cell performance of N719 was improved significantly to η ) 7.3%, whereas the performances of the porphyrin dyes increased only slightly, to η ) 6.5% and 6.8% for YD1 and YD2, respectively. The IPCE spectra of YD1 and YD2 exhibit a large gap between the Soret and the Q bands without a scattering layer (Figure 8c), but this gap is decreased for the TiO2films with a scattering
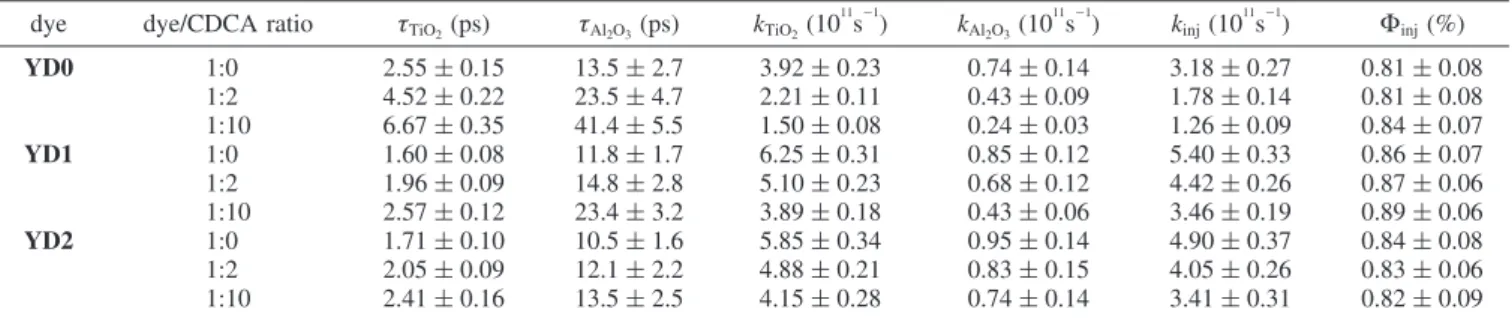
TABLE 2: Kinetic Parameters of TiO2and Al2O3Films (L≈ 5 µm) Sensitized with YD0-YD2 Coadsorbed with Varying
CDCA Ratios Obtained from Analysis of Femtosecond Fluorescence Decays Shown in Figure 7a dye dye/CDCA ratio τTiO2(ps) τAl2O3(ps) kTiO2(10
11 s-1) kAl2O3(10 11 s-1) kinj(10 11 s-1) Φinj(%) YD0 1:0 2.55 ( 0.15 13.5 ( 2.7 3.92 ( 0.23 0.74 ( 0.14 3.18 ( 0.27 0.81 ( 0.08 1:2 4.52 ( 0.22 23.5 ( 4.7 2.21 ( 0.11 0.43 ( 0.09 1.78 ( 0.14 0.81 ( 0.08 1:10 6.67 ( 0.35 41.4 ( 5.5 1.50 ( 0.08 0.24 ( 0.03 1.26 ( 0.09 0.84 ( 0.07 YD1 1:0 1.60 ( 0.08 11.8 ( 1.7 6.25 ( 0.31 0.85 ( 0.12 5.40 ( 0.33 0.86 ( 0.07 1:2 1.96 ( 0.09 14.8 ( 2.8 5.10 ( 0.23 0.68 ( 0.12 4.42 ( 0.26 0.87 ( 0.06 1:10 2.57 ( 0.12 23.4 ( 3.2 3.89 ( 0.18 0.43 ( 0.06 3.46 ( 0.19 0.89 ( 0.06 YD2 1:0 1.71 ( 0.10 10.5 ( 1.6 5.85 ( 0.34 0.95 ( 0.14 4.90 ( 0.37 0.84 ( 0.08 1:2 2.05 ( 0.09 12.1 ( 2.2 4.88 ( 0.21 0.83 ( 0.15 4.05 ( 0.26 0.83 ( 0.06 1:10 2.41 ( 0.16 13.5 ( 2.5 4.15 ( 0.28 0.74 ( 0.14 3.41 ( 0.31 0.82 ( 0.09 a
Average time coefficients obtained from raw data shown in Figures S3-S5 (Supporting Information), using the amplitude-averaged decay times. The uncertainties represent two standard deviations obtained from nonlinear curve fitting and subsequent data analysis.
Φinj) kinj kinj+ kagg+ knr + kr ) kinj kTiO2 ≈ (τTiO2 -1- τ Al2O3 -1 )τTiO2) 1 -τTiO2 τAl2O3 (3)
layer (Figure 8d). The shoulders of the efficiency spectra on the red side extended no further beyond the edge of the Q band in the presence of a scattering layer; for this reason, only a slight improvement in JSCwas found for the porphyrin-based DSSCs with a scattering layer. In contrast, the cell performance improved significantly for an N719-based DSSC with a scat-tering layer because of the effective scatscat-tering effect in the red shoulder of the efficiency spectrum.
3. Summary and Concluding Remarks
We report here photovoltaic performances and femtosecond fluorescence kinetics for three porphyrin sensitizers (YD0-YD2) coadsorbed with chenodeoxycholic acid (CDCA) at three molar ratios on nanocrystalline semiconductor films of TiO2 and Al2O3. Our photovoltaic results revealed three important points summarized as follows: First, devices YD1 and YD2 made of porphyrins with electron-donating substituents outperform reference cell YD0 because of the effective elec-tronic coupling between the diarylamino group and the porphyrin core that makes the IPCE spectra of the former much broader and red-shifted compared to the latter. Second, the addition of CDCA improved the cell performances of YD0 and YD1 to attain the greatest efficiencies at a dye/CDCA ratio of 1:2, but the presence of CDCA had a negative effect for YD2. Third,
the efficiencies of power conversion of YD1 and YD2 are slightly greater than that of N719 (6.4% and 6.6% vs 6.3%) without an added scattering layer on a TiO2film with a thickness of∼10 µm, but when the 10-µm TiO2films were covered with a scattering layer with a thickness of ∼4 µm, the cell performance of N719 significantly improved to η ) 7.3%, whereas the performances of YD1 and YD2 increased only slightly, to η ) 6.5% and 6.8%. The reason is that the shoulders of the IPCE spectra of YD1 and YD2 on the red side extended no further beyond the edge of the Q band, but such a scattering effect in the red shoulder significantly enhanced JSCfor device N719 with a scattering layer.
The superlative cell performances of YD1 and YD2 are due to their large JSCvalues, which arise from the uniformly large efficiency broadly covering the entire visible region of the solar spectrum. The diarylamino group attached at the meso position of the porphyrin core not only extends the absorption spectrally to a region of greater wavelength but also pushes the excited electrons spatially toward the TiO2film for an improved charge separation. Both YD1 and YD2 adsorbed on a TiO2 surface exhibit a long-lived cationic spectral feature corresponding to the absorption bands at∼800 and ∼1350 nm for their protracted charge recombination, whereas this spectral feature was absent when they were adsorbed on Al2O3films or for YD0 adsorbed
TABLE 3: Photovoltaic Parameters of DSSCs with TiO2Films [L≈ 10 or (10 + 4) µm] Sensitized with YD0-YD2 and N719
Coadsorbed with Varying CDCA Ratios under Simulated AM-1.5 Illumination (Power ) 100 mW cm-2) and an Active Area of 0.16 cm2 a
dye (dye/CDCA) L (µm) JSC(mA cm-2) VOC(V) FF η (%)
YD0 (1:2) ∼10 8.11 ( 0.04 0.700 ( 0.009 0.741 ( 0.008 4.21 ( 0.08 ∼(10 + 4) 8.63 ( 0.20 0.706 ( 0.002 0.744 ( 0.006 4.53 ( 0.06 YD1 (1:2) ∼10 12.80 ( 0.28 0.710 ( 0.003 0.707 ( 0.008 6.42 ( 0.05 ∼(10 + 4) 13.05 ( 0.45 0.712 ( 0.003 0.703 ( 0.018 6.54 ( 0.16 YD2 (1:0) ∼10 13.43 ( 0.24 0.711 ( 0.004 0.694 ( 0.014 6.62 ( 0.12 ∼(10 + 4) 13.68 ( 0.57 0.711 ( 0.003 0.695 ( 0.023 6.76 ( 0.13 N719 (1:1) ∼10 11.64 ( 0.87 0.760 ( 0.010 0.712 ( 0.040 6.30 ( 0.11 ∼(10 + 4) 13.83 ( 0.36 0.760 ( 0.008 0.698 ( 0.010 7.33 ( 0.08
aThe photovoltaic parameters are averaged values obtained from analysis of the J-V curves of three identical working electrodes for each
device fabricated and characterized under the same experimental conditions; the raw data of each J-V measurement are summarized in Tables S5 and S6 (Supporting Information), for L /µm≈ 10 and ≈ (10 + 4), respectively; the uncertainties represent two standard deviations of the measurements.
Figure 8. Optimal current-voltage characteristics of DSSC devices YD0-YD2 (working electrode a in the Supporting Information) on TiO2films
(thickness≈ 10 µm) (a) without a scattering layer and (b) with a scattering layer (thickness ≈ 4 µm) under illumination of simulated AM1.5G full sunlight (100 mW cm-2) and an active area 0.16 cm2. (c,d) Corresponding IPCE action spectra. The gray dashed curves in all plots show the results
on both films. The existence of the enduring charge-separation state in the porphyrin-sensitized TiO2 films implies that the interception of conduction-band electrons is controlled solely by recombination of the electrons with I3-in the electrolyte. That the cell performances of YD1 and YD2 are superior to that of YD0 is thus due to the diminished recombination between I3-and conduction-band electrons, because I3-might attach to the positively charged diarylamino moiety far from the TiO2 surface.
Because dye aggregation is an important issue for further improvement of the cell performance for porphyrin-based DSSC, we investigated the excited-state relaxation dynamics of YD0-YD2 with N719 at various ratios coadsorbed on TiO2or Al2O3films (thickness≈ 5 µm) using femtosecond fluorescence up-conversion. The order of rates of aggregate-induced energy transfer of porphyrins on Al2O3films is YD2> YD1 > YD0 in the absence of CDCA, but the rate of energy transfer in the presence of CDCA decreased much less for YD2 than for YD0 and YD1. The rates of electron injection of YD1 and YD2 are significantly greater than those of YD0, confirming that the involvement of the diarylamino substitutes in YD1 and YD2 has a dynamic effect to push the electrons efficiently toward TiO2. As the rates of electron injection for all three porphyrins decreased when more CDCA was added, porphyrin aggregation on TiO2surfaces not only accelerated the rate of intermolecular energy transfer but also increased the rate of interfacial electron injection so that the yields (Φinj) of electron injection were balanced by these two important factors. As a result, Φinj increased slightly with increasing amount of CDCA for both YD0 and YD1, but the variation in Φinjwas reversed for YD2 because the rate of electron injection decreased more signifi-cantly than the rate of energy transfer for the latter. The femtosecond results thus explain why the presence of CDCA failed to improve the photovoltaic performance for YD2 unlike for YD0 and YD1. The presence of CDCA suppresses dye aggregation, decreases the amount of dye loading on the TiO2 surface and diminishes electron injection from dye to TiO2; the overall performance of a porphyrin-based DSSC is thus a subtle balance between these factors.
Acknowledgment. The National Science Council of Taiwan and Ministry of Education of Taiwan, under the ATU program, provided support for this project.
Supporting Information Available: Synthesis and charac-terization of YD2, electrode preparation and device fabrication, effect of dye loading, photovoltaic characterization, femtosecond fluorescence spectra, and supplementary tables (Tables S1-S6) and figures (Figures S1-S6). This material is available free of charge via the Internet at http://pubs.acs.org.
References and Notes
(1) (a) O’Regan, B.; Gra¨tzel, M. Nature 1991, 353, 737. (b) Nazeer-uddin, M. K.; Kay, A.; Rodicio, I.; Humphry-Baker, R.; Mu¨ller, E.; Liska,
P.; Vlachopoulos, N.; Gra¨tzel, M. J. Am. Chem. Soc. 1993, 115, 6382. (c) Gra¨tzel, M. Inorg. Chem. 2005, 44, 6841.
(2) (a) Wang, Q.; Ito, S.; Gra¨tzel, M.; Fabregat-Santiago, F.; Mora-Sero´, I.; Bisquert, J.; Bessho, T.; Imai, H. J. Phys. Chem. B 2006, 110, 25210. (b) Gao, F.; Wang, Y.; Shi, D.; Zhang, J.; Wang, M.; Jing, X.; Humphry-Baker, R.; Wang, P.; Zakeeruddin, S. M.; Gra¨tzel, M. J. Am.
Chem. Soc. 2008, 130, 10720.
(3) (a) Robertson, N. Angew. Chem., Int. Ed. 2006, 45, 2338. (b) Hamann, T. W.; Jensen, R. A.; Martinson, A. B. F.; Ryswyk, H. V.; Hupp, J. T. Energy EnViron. Sci. 2008, 1, 66. (c) Mishra, A.; Fischer, M. K. R.; Ba¨uerle, P. Angew. Chem., Int. Ed. 2009, 48, 2474. (d) Imahori, H.; Umeyama, T.; Ito, S. Acc. Chem. Res., published online May 1, 2009, http:// dx.doi.org/10.1021/ar900034t.
(4) (a) Wang, Q.; Campbell, W. M.; Bonfantani, E. E.; Jolley, K. W.; Officer, D. L.; Walsh, P. J.; Gordon, K.; Humphry-Baker, R.; Nazeeruddin, M. K.; Gra¨tzel, M. J. Phys. Chem. B 2005, 109, 15397. (b) Campbell, W. M.; Jolley, K. W.; Wagner, P.; Wagner, K.; Walsh, P. J.; Gordon, K. C.; Schmidt-Mende, L.; Nazeeruddin, M. K.; Wang, Q.; Gra¨tzel, M.; Officer, D. L. J. Phys. Chem. C 2007, 111, 11760. (c) Rochford, J.; Chu, D.; Hagfeldt, A.; Galoppini, E. J. Am. Chem. Soc. 2007, 129, 4655. (d) Eu, S.; Hayashi, S.; Umeyama, T.; Oguro, A.; Kawasaki, M.; Kadota, N.; Matano, Y.; Imahori, H. J. Phys. Chem. C 2007, 111, 3528. (e) Stromberg, J. R.; Marton, A.; Kee, H. L.; Kirmaier, C.; Diers, J. R.; Muthiah, C.; Taniguchi, M.; Lindsey, J. S.; Bocian, D. F.; Meyer, G. J.; Holten, D. J. Phys. Chem.
C 2007, 111, 15464. (f) Hayashi, S.; Tanaka, M.; Hayashi, H.; Eu, S.;
Umeyama, T.; Matano, Y.; Araki, Y.; Imahori, H. J. Phys. Chem. C 2008,
112, 15576. (g) Park, J. K.; Lee, H. R.; Chen, J.; Shinokubo, H.; Osuka,
A.; Kim, D. J. Phys. Chem. C 2008, 112, 16691. (h) Lin, C.-Y.; Lo, C.-F.; Luo, L.; Lu, H.-P.; Hung, C.-S.; Diau, E. W.-G. J. Phys. Chem. C 2009,
113, 755. (i) de Tacconi, N. R.; Chanmanee, W.; Rajeshwar, K.; Rochford,
J.; Galoppini, E. J. Phys. Chem. C 2009, 113, 2996.
(5) Lee, C.-W.; Lu, H.-P.; Lan, C.-M.; Huang, Y.-L.; Liang, Y.-R.; Yen, W.-N.; Liu, Y.-C.; Lin, Y.-S.; Diau, E. W.-G.; Yeh, C.-Y. Chem.sEur.
J. 2009, 115, 1403.
(6) (a) Galoppini, E. Coord. Chem. ReV. 2004, 248, 1283. (b) Luo, L.-Y.; Lo, C.-F.; Lin, C.-Y.; Chang, I.-J.; Diau, E. W.-G. J. Phys. Chem. B
2006, 110, 410. (c) Lo, C.-F.; Luo, L.; Diau, E. W.-G.; Chang, I.-J.; Lin,
C.-Y. Chem. Commun. 2006, 1430.
(7) Wang, P.; Zakeeruddin, S. M.; Comte, P.; Charvet, R.; Humphry-Baker, R.; Gra¨tzel, M. J. Phys. Chem. B 2003, 107, 14336.
(8) Wang, M.; Li, X.; Lin, H.; Pechy, P.; Zakeeruddin, S. M.; Gra¨tzel, M. Dalton Trans., published online 2009, http://dx.doi.org/10.1039/ b908673k.
(9) Lu, H.-P.; Mai, C.-L.; Tsia, C.-Y.; Hsu, S.-J.; Hsieh, C.-P.; Chiu, C.-L.; Yeh, C.-Y.; Diau, E. W.-G. Phys. Chem. Chem. Phys. 2009, 11, 10270.
(10) (a) Hagberg, D. P.; Marinado, T.; Karlsson, K. M.; Nonomura, K.; Qin, P.; Boschloo, G.; Brinck, T.; Hagfeldt, A.; Sun, L. J. Org. Chem.
2007, 72, 9550. (b) Hagberg, D. P.; Yum, J.-H.; Lee, H.; De Angelis, F.;
Marinado, T.; Karlsson, K. M.; Humphry-Baker, R.; Sun, L.; Hagfeldt, A.; Gra¨tzel, M.; Nazeeruddin, Md. K. J. Am. Chem. Soc. 2008, 130, 6259. (c) Ooyama, Y.; Harima, Y. Eur. J. Org. Chem. 2009, 18, 2903.
(11) (a) Zakeeruddin, S. M.; Nazeeruddin, Md. K.; Humphry-Baker, R.; Pe´chy, P.; Quagliotto, P.; Barolo, C.; Viscardi, G.; Gra¨tzel, M. Langmuir
2002, 18, 952. (b) Wang, P.; Zakeeruddin, S. M.; Moser, J. E.; Nazeeruddin,
Md. K.; Sekiguchi, T.; Gra¨tzel, M. Nat. Mater. 2003, 2, 402.
(12) (a) Hirata, N.; Lagref, J.-J.; Palomares, E. J.; Durrant, J. R.; Nazeeruddin, M. K.; Gra¨tzel, M. Chem.sEur. J. 2004, 10, 595. (b) Haque, S. A.; Handa, S.; Peter, K.; Palomares, E.; Thelakkat, M.; Durrant, J. R.
Angew. Chem., Int. Ed. 2005, 44, 5740.
(13) Clifford, J. N.; Yahioglu, G.; Milgrom, L. R.; Durrant, J. R. Chem.
Commun. 2002, 1260.
(14) Mozer, A. J.; Wagner, P.; Officer, D. L.; Wallace, G. G.; Campbell, W. M.; Miyashita, M.; Sunahara, K.; Mori, S. Chem. Commun. 2008, 4741. (15) Halmes, J.; Boschloo, G.; Hagfeldt, A.; Lund, P. J. Phys. Chem. C
2008, 112, 5623.
(16) Valeur, B. Molecular Fluorescence: Principles and Applications; Wiley-VCH: New York, 2002.

![TraditionalMLCalgorithmsmainlytacklethebatchMLCproblem,wheretheinputdataarepresentedinabatch[24,28].Nevertheless,inmanyMLCapplicationssuchase-mailcategorization[22],multi-labelexamplesarriveasastream.Onlineanalysisistherefore dimensionreducermotivatedbyma](data:image/gif;base64,R0lGODlhAQABAIAAAP///wAAACH5BAEAAAAALAAAAAABAAEAAAICRAEAOw==)