Volume 2013, Article ID 384305,14pages http://dx.doi.org/10.1155/2013/384305
Research Article
An Analytical Framework of a Deployment Strategy for Cloud
Computing Services: A Case Study of Academic Websites
Chi-Hua Chen,
1,2Hui-Fei Lin,
3Hsu-Chia Chang,
1Ping-Hsien Ho,
1and Chi-Chun Lo
11Institute of Information Management, National Chiao Tung University, 1001 University Road, Hsinchu 300, Taiwan 2Telecommunication Laboratories, Chunghwa Telecom Co. Ltd., No. 12, Lane 551, Min-Tsu Road Sec. 5,
Yang-Mei, Taoyuan 326, Taiwan
3Department of Communication and Technology, National Chiao Tung University, 1001 University Road, Hsinchu 300, Taiwan
Correspondence should be addressed to Chi-Hua Chen; chihua0826@gmail.com Received 9 April 2013; Revised 14 July 2013; Accepted 1 August 2013
Academic Editor: Yi-Chung Hu
Copyright © 2013 Chi-Hua Chen et al. This is an open access article distributed under the Creative Commons Attribution License, which permits unrestricted use, distribution, and reproduction in any medium, provided the original work is properly cited. Cloud computing has become a popular topic for exploration in both academic and industrial research in recent years. In this paper, network behavior is analyzed to assess and compare the costs and risks associated with traditional local servers versus those associated with cloud computing to determine the appropriate deployment strategy. An analytic framework of a deployment strategy that involves two mathematical models and the analytical hierarchy process is proposed to analyze the costs and service level agreements of services involving using traditional local servers and platform as service platforms in the cloud. Two websites are used as test sites to analyze the costs and risks of deploying services in Google App Engine (GAE) (1) the website of Information
and Finance of Management (IFM) at the National Chiao Tung University (NCTU) and (2) the NCTU website. If the examined
websites were deployed in GAE, NCTU would save over 83.34% of the costs associated with using a traditional local server with low risk. Therefore, both the IFM and NCTU websites can be served appropriately in the cloud. Based on this strategy, a suggestion is proposed for managers and professionals.
1. Introduction
Cloud computing can provide high scalability and powerful computing capabilities, enable rapid deployment, and reduce costs for businesses [1, 2]; therefore, cloud computing is increasingly relevant. The current cloud computing service (CCS) vendors (e.g., Google, Microsoft, Salesforce.com, and Amazon.com) provide CCS requesters with three different architectures for their service deployment: infrastructure as
a service (IaaS), platform as a service (PaaS), and software as a
service (SaaS) [3]. IaaS enables substituting a hardware
infras-tructure with a platform virtualization environment (e.g., a virtual private server) to offer businesses fully outsourced service [4]. PaaS provides a higher level of abstraction and can support the integration of design, development, deployment, testing, and hosting for CCS requesters [5]. SaaS provides business application software through the Internet.
In recent years, numerous businesses have transferred their services PaaS platforms (e.g., Google App Engine (GAE),
Amazon Web Service (AWS), and Microsoft Azure),
espe-cially onto GAE, which can provide automatic and optimal resource allocation with scaling and load-balancing tech-niques. GAE also provides supports dynamic web service with full support for common web technologies and reliable storage with queries, sorting, and transactions. In addition, applications run in a secure environment with limited access to the underlying operating system in the sandbox [6]. Several factors affect CCS deployment strategies in the PaaS platform. Cloud computing providers and other parties such as service consumers and companies sign service level
agree-ments (SLAs) to order their desired level of cloud computing
service from a provider. Armbrust et al. [7] showed that the cost and the service blocking rate (SBR) are crucial factors in determining the deployment strategy. Although cloud computing can support utility computing and pay-per-use for on-demand scalability, the CCS requester is charged a high unit cost by CCS vendors. Furthermore, the available rate of CCS in accordance with SBR is considered for SLAs.
Table 1: The competitive matrix diagrams of CCS vendors [8].
Provider Google App Engine Microsoft Windows Azure Amazon Web Services
IaaS No No Yes
PaaS Yes (Python, Java) Yes (.Note, Java, Ruby, Python, PHP) No
Compute billing model Pay-per-use Pay-per-use Pay-per-use
Storage billing model Pay-per-use Pay-per-use Pay-per-use
Relational database service Yes (MySQL based) Yes (SQL Server) No
Table 2: Request free and billing-enabled quota [6].
Resource Free default quota Billing-enabled default quota
Daily limit Maximum rate Daily limit Maximum rate
Requests (includes HTTPS) 43,200,000 requests 45,200 requests/minute 43,200,000 requests 45,200
requests/minute Outgoing bandwidth (billable,
includes HTTPS) 1 GB 56 MB/minute
1 GB free; 14,400 GB
maximum 10 GB/minute
Incoming bandwidth (billable,
includes HTTPS) 1 GB 56 MB/minute
1 GB free; 14,400 GB
maximum 10 GB/minute
CPU time (billable) 6.5 CPU hours 15 CPU minutes/minute
6.5 CPU hours free; 1,729 CPU hours
maximum
72 CPU minutes/minute
Based on the relationship between demand and capacity, an analytic framework of a deployment strategy that com-bines the analytical hierarchy process (AHP) to analyze the cost and an SLA based on the SBR of the CCS is proposed. Two websites are used as examples(1) the Information and
Finance of Management (IFM) page on the National Chiao
Tung University (NCTU) website and(2) the NCTU website.
In this paper, network behaviors and the deployment factors of PaaS, which include the cost and SLA for CCS deployment strategy making, are analyzed.
The remainder of the paper is organized as follows. Background knowledge and relevant technologies are pre-sented inSection 2. InSection 3, an analytic framework of a deployment strategy is proposed to analyze the cost of services and SLA, and those services are compared between the PaaS platform and a traditional local server. InSection 4, the parameters of the model affecting the cost and SLA are examined. An analysis of network behavior is also included to assess the platforms that are suitable for CCS deployment. Actual data are gathered from the IFM and the log files of NCTU websites. Finally, conclusions and recommendations for future work are offered inSection 5.
2. Literature Review
Necessary research background and relevant technologies include(1) CCS, (2) network behaviors, and (3) deployment strategy.
2.1. Cloud Computing Service. The current CCS venders (e.g.,
Google, Microsoft, and Amazon) provide different architec-tures to CCS requesters for their service deployment.
Table 1 shows the characteristics of major computing vendors including the types of services providing and billing models that they offer [8]. First, most CCS vendors provide
a PaaS platform for users to deploy their services and use various programming languages. Second, all vendors support a pay-per-use billing model. Because the website is suitable to be deployed on PaaS platform and the deployment cost of GAE is cheaper than that of Microsoft Windows Azure, a deployment strategy using GAE is discussed and analyzed in this study.
The costs of the GAE PaaS platform include requests, outgoing bandwidth, incoming bandwidth, and CPU time, as shown inTable 2. The default quota is divided into free quota and billing-enabled quota. For example, when the outgoing bandwidth is less than 1 GB, GAE does not charge a fee. However, when the bandwidth is higher than this amount, GAE charges customers, and the fees are based on the amount exceeding the free default quota.
Cloud computing involves scalability and availability. The SBR of the PaaS platform may occur because of the limits of the billing-enabled default quota. These daily limits or the maximal rate per minute affects the risk of building services on a cloud. This study explores the costs of CCSs and the billing-enabled default quota to derive SBR models for SLAs.
Table 3 shows the cost for computing resources. In
Section 4, these costs are adopted to determine the deploy-ment cost for a CCS.
2.2. Network Behaviors. Certain network behaviors have
been defined, these include network path, interarrival terns, and transmission control protocol (TCP) behavior pat-terns. Mogul used interarrival patterns which include packet arrivals, request arrivals, and per-client request arrivals to analyze HTTP server logs. Then the interarrival distribution was obtained for several categories of events [9]. Inter-arrival patterns are suitable to be used in generating a probability density function for the analyzing of a web server. Therefore,
Table 3: Billable quota unit cost [6].
Resource Unit Unit cost
Outgoing bandwidth Gigabytes $0.12
Incoming bandwidth Gigabytes $0.10
CPU time CPU hours $0.10
Stored data Gigabytes per month $0.15
High replication storage Gigabytes per month $0.45
Recipients emailed Recipients $0.0001
Always on N/A (daily) $0.30
interarrival patterns are used to collect the server logs and obtain the interarrival distribution for analyzing the cost and SLA of a CCS.
2.3. Deployment Strategy. Few studies have addressed the
deployment strategy for a CCS. Therefore, this section first presents previous studies concerning the deployment strategy for a CCS. Then AHP which is a popular multiple-attribute decision-making method is described and discussed for use in the deployment strategy.
2.3.1. Deployment Strategy for a Cloud Computing Service.
Kang and Sim proposed a multicriteria cloud service search engine in which cloud ontology and the similarity reasoning method are considered to support matching algorithms by using three types of requirements. These requirements are (1) the functional requirement, (2) the technical requirement, and(3) the cost requirement [10]. Although their simulation results indicate that this engine can be used to search the adapter private cloud framework, the weight of each require-ment is subjectively defined in the engine which is unsuitable for a public cloud.
Some researchers have used the Amazon cloud fee struc-ture and a real-life astronomy application. They considered the tradeoffs of different execution and resource provisioning plans in the simulation. When used for long term application data archival, they also studied the tradeoffs in the context of the storage and communication fees of Amazon S3. Their results show that cost can be markedly reduced without a substantial impact on application performance by providing the suitable amount of storage and computing resources [11]. However, they only focused on the resource deployment of Amazon, and the differences in deployment between local servers and the cloud platform were not compared.
2.3.2. Analytical Hierarchy Process. The AHP, which was
pro-posed by Saaty, is typically used to model multiple-attribute decision making in a hierarchical system [12]. Therefore, the AHP is used to analyze and calculate the weight of each factor for decision making. The main steps of the AHP are described as follows [13].
The evaluative criteria are defined and the hierarchical system is established in Step 1.
The comparative weight between the attributes of the decision elements is calculated to generate the reciprocal matrix in Step 2. For example, a set of𝑛 compared attributes
are denoted by 𝑎1, 𝑎2, . . . , 𝑎𝑛 and the weights are defined as𝑤1, 𝑤2, . . . , 𝑤𝑛. They are shown in (1), and𝑤𝑖 is defined as∑𝑛𝑦=1(𝑎𝑖𝑦/ ∑𝑛𝑥=1𝑎𝑥𝑦)/𝑛. For consistency measurement, the consistency index (CI), which is defined in (2), was proposed by Saaty, who suggested that the value of the CI should not exceed 0.1 for a confident result [13,14].
Consider 𝐴 = [ [ [ [ [ [ [ [ 𝑎11 ⋅ ⋅ ⋅ 𝑎1𝑗 ⋅ ⋅ ⋅ 𝑎1𝑛 .. . ... ... 𝑎𝑖1 ⋅ ⋅ ⋅ 𝑎𝑖𝑗 ⋅ ⋅ ⋅ 𝑎𝑖𝑛 .. . ... ... 𝑎𝑛1 ⋅ ⋅ ⋅ 𝑎𝑛𝑗 ⋅ ⋅ ⋅ 𝑎𝑛𝑛 ] ] ] ] ] ] ] ] ≅ [ [ [ [ [ [ [ [ [ [ [ [ [ [ 𝑤1 𝑤1 ⋅ ⋅ ⋅ 𝑤1 𝑤𝑗 ⋅ ⋅ ⋅ 𝑤1 𝑤𝑛 .. . ... ... 𝑤𝑖 𝑤1 ⋅ ⋅ ⋅ 𝑤𝑖 𝑤𝑗 ⋅ ⋅ ⋅ 𝑤𝑖 𝑤𝑛 .. . ... ... 𝑤𝑛 𝑤1 ⋅ ⋅ ⋅ 𝑤𝑛 𝑤𝑗 ⋅ ⋅ ⋅ 𝑤𝑛 𝑤𝑛 ] ] ] ] ] ] ] ] ] ] ] ] ] ] = 𝑊, (1) where𝑎𝑖𝑗> 0, 𝑎𝑖𝑗= 1/𝑎𝑗𝑖, and𝑤𝑖= ∑𝑛𝑦=1(𝑎𝑖𝑦/ ∑𝑛𝑥=1𝑎𝑥𝑦)/𝑛. Consider CI= 𝜆 − 𝑛 𝑛 − 1, (2) where𝜆 = ∑𝑛𝑖=1((∑𝑛𝑗=1𝑤𝑗𝑎𝑖𝑗)/𝑤𝑖)/𝑛.
The hierarchy weight at each level is calculated to deter-mine the optimal strategy in Step 3.
3. An Analytic Framework of the Deployment
Strategy for a Cloud Computing Service
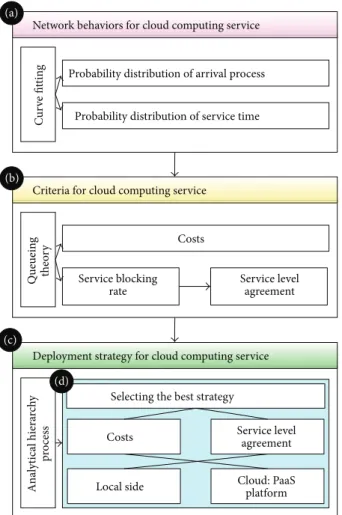
This section proposes an analytic framework based on net-work behavior for the deployment strategy of a CCS (shown inFigure 1). First, this study uses the curve-fitting method [15] which was used to determine the probability distribution for interarrival patterns (Figure 1(a)). The queueing theory is then used to measure the considered criteria which include costs and the SLA in accordance with network behaviors (Figure 1(b)). Finally, this study uses these criteria, and the AHP to set up the hierarchy system for decision making (Figure 1(c)).3.1. Network Behaviors for a Cloud Computing Service. Two
network behaviors are considered in this study: they are the probability distribution of the request arrival process and ser-vice time. First, the request logs are collected from the web server to generate the probability distribution. Then the curve-fitting method is used based on the chi-square test to assume and verify whether the probability distribution fits the assumed probability density function (e.g., Poisson distribution and exponential distribution).
Network behaviors for cloud computing service
Probability distribution of arrival process
Probability distribution of service time
Cu
rv
e fitt
in
g
Criteria for cloud computing service
Costs Service blocking rate Queuein g th eo ry Service level agreement
Deployment strategy for cloud computing service
Selecting the best strategy
Costs Service levelagreement
Local side Cloud: PaaSplatform
(a) (b) (c) (d) Ana lyt ica l hiera rc h y pro ce ss
Figure 1: The proposed analytic framework of deployment strategy for CCS.
3.2. Criteria for a Cloud Computing Service. The proposed
analytic framework of the deployment strategy includes two criteria. For the first criterion, the costs associated with the PaaS platform versus those associated with a traditional local server are calculated. For the second criterion, the SLA is measured based on the SBRs of the PaaS platform and a traditional local server.
3.2.1. Criterion 1: Analysis of Costs. The analysis of service
costs for the PaaS platform versus those of a local server is divided into two parts, the first for the PaaS platform and the second for the local server.
(1) Local Side. The costs associated with a traditional local server include network costs (𝐶𝑁), electricity (𝐶𝐸), server depreciation expenses (𝐶SDE), and personnel costs (𝐶𝑃).
Equation (3) is assumed to be the total cost (𝐶𝐿) of the traditional local server.Table 4lists the parameters of (3).
Consider
𝐶𝐿= 𝐶𝑁+ 𝐶𝐸+ 𝐶SDE+ 𝐶𝑃. (3)
(2) Cloud: PaaS Platform. A probability density function Pr(𝑘) is assumed in which the number of requests is equal to 𝑘 for a one-day period. The average amount of data per request
Table 4: Cost parameters for a traditional local server.
Parameter Description
𝐶𝐿 Total cost of a traditional local server
𝐶𝑁 Network costs
𝐶𝐸 Electricity costs
𝐶SDE Server depreciation expenses
𝐶𝑃 Personnel costs
Table 5: Cost parameters for CCS.
Parameter Description
𝑘 (request) Number of requests per day
Pr(𝑘) Probability density function when the
number of requests is equal to𝑘
𝜉 Average amount of data per request
𝑟 Maximum number of requests per day
𝐶𝐺 Cost per gigabyte
𝐶𝐶 Total bandwidth cost per day
is defined as𝜉, and the cost per gigabyte is defined as 𝐶𝐺. In the case of GAE, for example, there is a free daily throughput of 1 GB. The CCS cost (𝐶𝐶) can be calculated using (4).Table 5
lists the parameters of (4). Consider
𝐶𝐶= (⌈𝜉 ×∑𝑟
𝑘=0
𝑘 × Pr (𝑘)⌉ − 1) × 𝐶𝐺. (4)
3.2.2. Criterion 2: Analysis of the Service Level Agreement.
Because local servers have limited computing power com-pared to high-capacity cloud computing services, this section proposes a SLA model based on the SBR for comparing the traditional local server with the PaaS platform.
(1) Local Side. There is a ceiling on the number of users a local server can service simultaneously; thus, the SBR is assumed using (5) to represent the probability Pr𝑙(𝑐) that the number of requests for service exceeds the maximal online capacity. The SLA is defined in (6).Table 6lists the parameters of (5) and (6).
Consider
𝐵𝐿= Pr𝑙(𝑐) , (5)
𝑆𝐿= 1 − 𝐵𝐿. (6)
(2) Cloud: PaaS Platform. PaaS vendors typically limit the number of acceptable requests (𝑛) per minute or per day. Therefore, a probability density function Pr(𝑘) is assumed in which the number of requests is equal to𝑘 for a 1 minute or 1 day period; the SBR(𝐵𝐶) in the PaaS platform is defined in (7), and the SLA is defined in (8).Table 7lists the parameters of (7) and (8).
Table 6: SLA parameters for a traditional local server.
Parameter Description
𝐵𝐿, Pr𝑙(𝑐) Probability function when the maximum
service limit𝑐 is reached
𝑆𝐿 SLA of a traditional local server
Table 7: SLA parameters for CCS.
Parameter Description
𝐵𝐶 Probability of the SBR on a PaaS platform
𝑘 Number of requests per minute or day
Pr(𝑘) Probability density function when the
number of requests is equal to𝑘
𝑛 The maximum allowable number of
accumulated requests per minute or day
𝑆𝐶 SLA on a PaaS platform
Consider 𝐵𝐶= ∑∞ 𝑘=𝑛+1 Pr(𝑘) , (7) 𝑆𝐶= 1 − 𝐵𝐶= 1 − ∑∞ 𝑘=𝑛+1 Pr(𝑘) . (8)
3.3. The Deployment Strategy for a Cloud Computing Service.
In this study, the AHP is used to analyze the comparative weight between the attributes of the decision elements in a hierarchical system (Figure 1(d)). The criteria include costs and the SLA, and the strategies include local side and the CCS. Therefore, six matrices can be calculated by using (1) as follows:
(1) matrices𝐴𝑅and𝑊𝑅(shown in (9)) for the weight of the criteria divided by the given cost weight𝑤𝑐 and SLA weight𝑤𝑠,
(2) matrices𝐴𝐶and 𝑊𝐶(shown in (10)) for the weight of strategy based on costs in accordance with (3) and (4),
(3) matrices𝐴𝑆and𝑊𝑆(shown in (11)) for the weight of the strategy based on the SLA in accordance with (6) and (8). One has 𝐴𝑅= Cost SLA Cost SLA [ [ 1 𝑤𝑆 𝑤𝐶 𝑤𝐶 𝑤𝑆 1 ]] = 𝑊𝑅, (9) where 𝑤𝐶> 0, 𝑤𝑆> 0. One has 𝐴𝐶= Local Cloud Local Cloud [ [ 1 𝑎𝐶,𝐶𝐿= 𝐶𝐿 𝐶𝐶 𝑎𝐶,𝐿𝐶= 𝐶𝐶 𝐶𝐿 1 ] ] ≅ Local Cloud Local Cloud [ [ 1 𝑤𝐶,𝐶 𝑤𝐶,𝐿 𝑤𝐶,𝐿 𝑤𝐶,𝐶 1 ] ] = 𝑊𝐶, (10) where 𝑤𝐶,𝐿= 𝐶𝐶/(𝐶𝐿+ 𝐶𝐶) and 𝑤𝐶,𝐶= 𝐶𝐿/(𝐶𝐿+ 𝐶𝐶). One has 𝐴𝑆= Local Cloud Local Cloud [ [ 1 𝑎𝑆,𝐶𝐿=𝑆𝐶 𝑆𝐿 𝑎𝑆,𝐿𝐶= 𝑆𝐿 𝑆𝐶 1 ] ] ≅ Local Cloud Local Cloud [ [ 1 𝑤𝑆,𝐶 𝑤𝑆,𝐿 𝑤𝑆,𝐿 𝑤𝑆,𝐶 1 ] ] = 𝑊𝑆, (11) where𝑤𝑆,𝐿= 𝑆𝐿/(𝑆𝐿+ 𝑆𝐶) and 𝑤𝑆,𝐶= 𝑆𝐶/(𝑆𝐿+ 𝑆𝐶).
For consistency measurement, (2) is used to test (9), (10), and (11). Because all CIs (shown in (12)) are equal to 0, the results are valid.
Consider CI for𝐴𝑅:𝜆 − 2 2 − 1 = 2 − 2 1 = 0, where𝜆 = (𝑤𝐶+ 𝑤𝑆× (𝑤𝐶/𝑤𝑆)) /𝑤𝐶 2 +(𝑤𝐶× (𝑤𝑆/𝑤𝐶) + 𝑤𝑆) /𝑤𝑆 2 =(𝑤𝐶+ 𝑤𝐶) /𝑤𝐶2+ (𝑤𝑆+ 𝑤𝑆) /𝑤𝑆 = 2, CI for𝐴𝐶:𝜆 − 2 2 − 1 = 2 − 2 1 = 0, where𝜆 = (𝑤𝐶,𝐿+ 𝑤𝐶,𝐶× (𝐶𝐶/𝐶𝐿)) /𝑤𝐶,𝐿 2 +(𝑤𝐶,𝐿× (𝐶𝐿/𝐶𝐶2) + 𝑤𝐶,𝐶) /𝑤𝐶,𝐶 = (𝐶𝐶+ 𝐶𝐶) /𝐶𝐶+ (𝐶𝐿+ 𝐶𝐿) /𝐶𝐿 2 = 2, CI for𝐴𝑆:𝜆 − 2 2 − 1 = 2 − 2 1 = 0, where 𝜆 = (𝑤𝑆,𝐿+ 𝑤𝑆,𝐶× (𝑆𝐿/𝑆𝐶)) /𝑤𝑆,𝐿 2 +(𝑤𝑆,𝐿× (𝑆𝐶/𝑆𝐿2) + 𝑤𝑆,𝐶) /𝑤𝑆,𝐶 = (𝑆𝐿+ 𝑆𝐿) /𝑆𝐿+ (𝑆𝐶+ 𝑆𝐶) /𝑆𝐶 2 = 2. (12)
Table 8: Equipment and support.
Demand content Description
Equipment Hardware
Notebook with Intel Core 2 Duo CPU P7450 and 4 G RAM
Software
Microsoft Windows 7, Microsoft Office 2007, Microsoft Visual Studio 2008, Mathematica, and Eclipse Support Information and Finance of Management National Chiao Tung University website
Web server log files and server price lists National Chiao Tung
University website
Web server log files and server price lists
For decision making, the final CCS weight (𝑤𝐶× 𝑤𝐶,𝐶+
𝑤𝑆× 𝑤𝑆,𝐶) and local side weight (𝑤𝐶× 𝑤𝐶,𝐿+ 𝑤𝑆× 𝑤𝑆,𝐿) are
compared. Furthermore, Armbrust et al. [7] indicated that the SLA should be higher than 99%; therefore, the strategy is considered when its SLA is higher than 0.99. For example, when the value of𝑤𝐶/𝑤𝑆is larger than the threshold value, 𝛿 and 𝑆𝐶are higher than 0.99 (shown in (13)); the website is suitable to be deployed using CCS.
Consider 𝑤𝐶× 𝑤𝐶,𝐶+ 𝑤𝑆× 𝑤𝑆,𝐶> 𝑤𝐶× 𝑤𝐶,𝐿+ 𝑤𝑆× 𝑤𝑆,𝐿 ⇒ 𝑤𝐶× (𝑤𝐶,𝐶− 𝑤𝐶,𝐿) > 𝑤𝑆× (𝑤𝑆,𝐿− 𝑤𝑆,𝐶) ⇒ 𝑤𝐶 𝑤𝑆 > 𝑤𝑆,𝐿− 𝑤𝑆,𝐶 𝑤𝐶,𝐶− 𝑤𝐶,𝐿 = 𝑆𝐿/ (𝑆𝐿+ 𝑆𝐶) − 𝑆𝐶/ (𝑆𝐿+ 𝑆𝐶) 𝐶𝐿/ (𝐶𝐿+ 𝐶𝐶) − 𝐶𝐶/ (𝐶𝐿+ 𝐶𝐶) = (𝐶𝐿+ 𝐶𝐶) (𝑆𝐿− 𝑆𝐶) (𝐶𝐿− 𝐶𝐶) (𝑆𝐿+ 𝑆𝐶) = 𝛿, (13) where𝑆𝐶> 0.99.
4. Experimental Results and Discussion
Actual data from the IFM and NCTU website log files were used to analyze network behavior to assess the viability of cloud computing service deployment; this was followed by a numerical analysis of various parameters of cost and SLA for a deployment strategy.
4.1. Experimental Environment. The testing and analysis
programs were written primarily in the Java programming language, and numerical analysis was performed using Math-ematica software. Data were gathered with the assistance of the IFM and NCTU website administrators, who provided log files and server price lists for analyses of network behavior, criteria, and deployment strategy.Table 8shows the equip-ment and support materials used for the experiequip-ments.
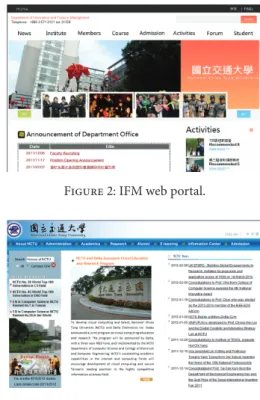
Figure 2: IFM web portal.
Figure 3: NCTU web portal.
4.1.1. Case 1: Information and Finance of Management at the National Chiao Tung University Website. The first case
involved the Information and Finance of Management web-site. IFM is a department of NCTU; therefore, its website has fewer users than the NCTU website. Its web portal is shown inFigure 2. The main services provided by the IFM website include department news, institute and member introduc-tions, course outlines, admission information, event listings, discussion forums, and information for enrolled students.
4.1.2. Case 2: The National Chiao Tung University Website.
The second case involved the NCTU website; its web portal is shown inFigure 3. The university currently enrolls approx-imately 140,000 students. The main services provided by the NCTU website include an introduction to the institution, links to departmental overviews and websites, administrative functions, alumni services, e-learning, and campus informa-tion.
4.2. Experimental Results. The network behavior was
ana-lyzed and tested using the curve-fitting method. Based on the network behaviors, the cost and SLA were calculated using the proposed models inSection 3to generate the criterion weights. Finally, this study used AHP to analyze the weight of each strategy for decision making.
4.2.1. Collection and Analysis of Network Behavior. This study
analyzed the network behaviors to obtain the probability distribution of request arrival process and service time. The queueing model was used with these probability distributions for criterion analyses.
(1) Request Arrival Process. For the IFM case, this study used the user access records from the IFM web server for the
Average RIAT= 60.6 s/request 100 90 80 70 60 50 40 30 20 ED 10 0 PD F (%) (0, 60] (60, 120] (120, 180] (180, 240] (240, 300] (300, 360] (360, 420] (420, 480] (480, 540] (540, 600] (600, 660] (660, 720] (720, infini te ) RIAT (s/request) RD
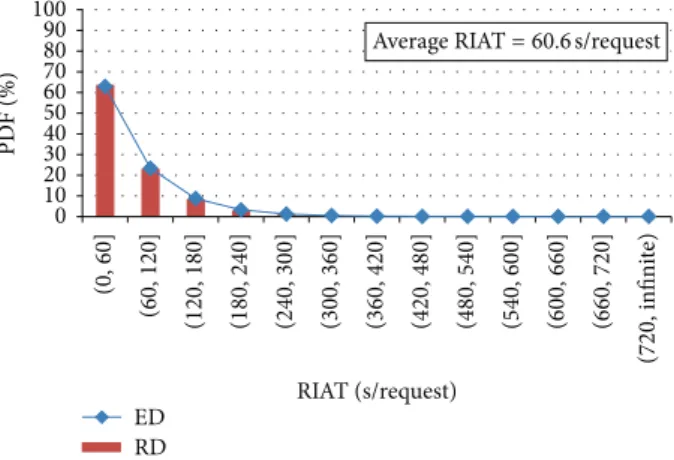
Figure 4: The PDF of RIAT obtained from IFM records.
Average RIAT= 60.6 s/request
RD ED 100 90 80 70 60 50 40 30 20 10 0 CD F (%) RIAT (s/request) (0, 60] 0 (60, 120] (120, 180] (180, 240] (240, 300] (300, 360] (360, 420] (420, 480] (480, 540] (540, 600] (600, 660] (660, 720] (720, infini te )
Figure 5: Comparison of the measured IFM request events and their corresponding cumulative probability density using the exponential
distribution function (average RIAT1/𝜆 = 60.6 sec/request).
period from March 2009 to November 2010. Subsequently, the probability density function (PDF) and the cumulative
density function (CDF) of the request interarrival time (RIAT)
distribution were collected and analyzed. The average RIAT (1/𝜆) was 60.6 sec/request for the recorded request events. This study assumed that the probability distribution of the
real data (RD) is the exponential distribution (ED) function
with an average RIAT of 60.6 sec/request, as shown inTable 9
and Figures4and5. The PDFs of ED and RD were defined as 𝐸 and 𝑂. The chi-square test was used to test this assumption. The test results showed that 𝜒2 = 0.0005 < 𝜒12,0.052 = 21.026 when 𝛼 = 0.05 [16], and no significant difference was observed.
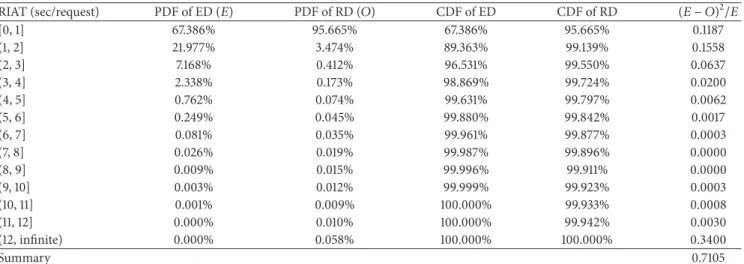
For the NCTU case, the user access records during February 2011 were collected from the NCTU web server for network behavior analyses. The average RIAT was 0.1204 sec/ request for the recorded requests events, and the probability distributions were obtained, as shown inTable 10and Figures
6and7. The test results showed that𝜒2= 0.7105 < 𝜒212,0.05= 21.026 when 𝛼 = 0.05 [16], and no significant difference was observed.
Therefore, this study assumed that the request arrival pro-cess corresponds to a Poisson propro-cess with requests arriving
Average RIAT= 0.1204 s/request
100 90 80 70 60 50 40 30 20 10 0 PD F (%) RIAT (s/request) (0, 1] (1, 2] (2, 3] (3, 4] (4, 5] (5, 6] (6, 7] (7, 8] (8, 9] (9, 10] (10, 11] (11, 12] (12, infini te ) ED RD
Figure 6: The PDF of RIAT obtained from IFM records.
Average RIAT= 0.1204 s/request
100 90 80 70 60 50 40 30 20 10 0 CD F (%) RIAT (s/request) (0, 1] 0 (1, 2] (2, 3] (3, 4] (4, 5] (5, 6] (6, 7] (7, 8] (8, 9] (9, 10] (10, 11] (11, 12] (12, infini te ) RD ED
Figure 7: Comparison of the measured NCTU request events and the corresponding cumulative probability density using the
expo-nential distribution function (average RIAT 1/𝜆 = 0.1204 sec/
request).
at rate𝜆 for network behavior analysis [17]. The probability density function can be defined as (14) which shows 𝑘 requests per day. The parameters of (14) are shown inTable 11.
Consider
Pr(𝑘) = (𝜆𝑡)
𝑘𝑒−𝜆𝑡
𝑘! . (14)
(2) Request Service Time. This study used the records men-tioned inSection 4.2.1(1) to analyze the probability
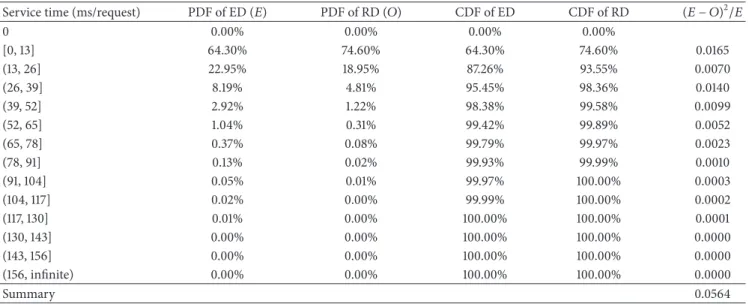
distribu-tion of request service time. For the IFM case, the average service time1/𝜇 was 12.62 ms/request. The ED function fit the cumulative probability density of the service time, the average service time was 12.62 ms/request, as shown Table 12 and Figures8and9. The test results showed that𝜒2 = 0.0564 < 𝜒2
12,0.05 = 21.026 when 𝛼 = 0.05 [16], and no significant
difference was observed.
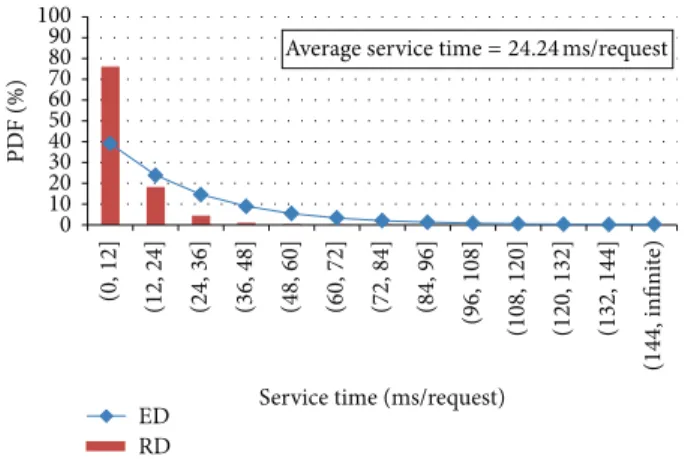
For the NCTU case, the average service time 1/𝜇 was 24.24 ms/request. This study assumed that the probability of request service time is distributed as an ED. The probability distributions of request service time obtained from the NCTU records are shown inTable 13and Figures10and11.
Table 9: The probability distributions of RIAT obtained from IFM records. RIAT (sec/request) PDF of ED (𝐸) PDF of RD (𝑂) CDF of ED CDF of RD (𝐸 − 𝑂)2/𝐸 [0, 60] 62.846% 63.715% 62.846% 63.715% 0.0001 (60, 120] 23.350% 23.119% 86.196% 86.834% 0.0000 (120, 180] 8.675% 8.389% 94.871% 95.223% 0.0001 (180, 240] 3.223% 3.044% 98.094% 98.267% 0.0001 (240, 300] 1.198% 1.104% 99.292% 99.371% 0.0001 (300, 360] 0.445% 0.401% 99.737% 99.772% 0.0000 (360, 420] 0.165% 0.145% 99.902% 99.917% 0.0000 (420, 480] 0.061% 0.053% 99.964% 99.970% 0.0000 (480, 540] 0.023% 0.019% 99.987% 99.989% 0.0000 (540, 600] 0.008% 0.007% 99.995% 99.996% 0.0000 (600, 660] 0.003% 0.003% 99.998% 99.999% 0.0000 (660, 720] 0.001% 0.001% 99.999% 100.000% 0.0000 (720, infinite) 0.001% 0.000% 100.000% 100.000% 0.0000 Summary 0.0005
Table 10: The probability distributions of RIAT obtained from NCTU records.
RIAT (sec/request) PDF of ED (𝐸) PDF of RD (𝑂) CDF of ED CDF of RD (𝐸 − 𝑂)2/𝐸 [0, 1] 67.386% 95.665% 67.386% 95.665% 0.1187 (1, 2] 21.977% 3.474% 89.363% 99.139% 0.1558 (2, 3] 7.168% 0.412% 96.531% 99.550% 0.0637 (3, 4] 2.338% 0.173% 98.869% 99.724% 0.0200 (4, 5] 0.762% 0.074% 99.631% 99.797% 0.0062 (5, 6] 0.249% 0.045% 99.880% 99.842% 0.0017 (6, 7] 0.081% 0.035% 99.961% 99.877% 0.0003 (7, 8] 0.026% 0.019% 99.987% 99.896% 0.0000 (8, 9] 0.009% 0.015% 99.996% 99.911% 0.0000 (9, 10] 0.003% 0.012% 99.999% 99.923% 0.0003 (10, 11] 0.001% 0.009% 100.000% 99.933% 0.0008 (11, 12] 0.000% 0.010% 100.000% 99.942% 0.0030 (12, infinite) 0.000% 0.058% 100.000% 100.000% 0.3400 Summary 0.7105
Average service time= 12.62 ms/request
100 90 80 70 60 50 40 30 20 10 0 PD F (%) (0, 13] (13, 26] (26, 39] (39, 52] (52, 65] (65, 78] (78, 91] (91, 104] (104, 117] (117, 130] (130, 143] (143, 156] (156, infini te )
Service time (ms/request) ED
RD
Figure 8: The PDF of request service time obtained from IFM rec-ords.
The test results showed that 𝜒2 = 0.6354 < 𝜒12,0.052 = 21.026 when 𝛼 = 0.05 [16], and no significant difference was observed.
Table 11: Parameters of the request arrival process.
Parameter Description
Pr(𝑘) Probability for a number of requests arriving
in a cycle𝑡
𝜆 (request/min) Average request arrival rate
𝑡 (min) Request cycle time
𝑘 (requests) Number of arriving requests per current
cycle time
(3) Summary. This study showed that the request arrival process is a Poisson process and the service time is distributed as ED. Therefore, the service process can be modeled using a simple M/M/c/c queue with the parameters𝜆 and 1/𝜇 [18].
Figure 12shows a state transition rate diagram of the service process, where state𝑐 denotes that there are 𝑐 clients in the server, and𝑃𝑖denotes the probability of state𝑖. The SBR Pr𝑙(𝑐) in (5) was derived in (15), where𝑐 denotes the maximum number of connections that are simultaneously processed by a traditional local server.
Table 12: The probability distributions of request service time obtained from IFM records.
Service time (ms/request) PDF of ED (𝐸) PDF of RD (𝑂) CDF of ED CDF of RD (𝐸 − 𝑂)2/𝐸
0 0.00% 0.00% 0.00% 0.00% [0, 13] 64.30% 74.60% 64.30% 74.60% 0.0165 (13, 26] 22.95% 18.95% 87.26% 93.55% 0.0070 (26, 39] 8.19% 4.81% 95.45% 98.36% 0.0140 (39, 52] 2.92% 1.22% 98.38% 99.58% 0.0099 (52, 65] 1.04% 0.31% 99.42% 99.89% 0.0052 (65, 78] 0.37% 0.08% 99.79% 99.97% 0.0023 (78, 91] 0.13% 0.02% 99.93% 99.99% 0.0010 (91, 104] 0.05% 0.01% 99.97% 100.00% 0.0003 (104, 117] 0.02% 0.00% 99.99% 100.00% 0.0002 (117, 130] 0.01% 0.00% 100.00% 100.00% 0.0001 (130, 143] 0.00% 0.00% 100.00% 100.00% 0.0000 (143, 156] 0.00% 0.00% 100.00% 100.00% 0.0000 (156, infinite) 0.00% 0.00% 100.00% 100.00% 0.0000 Summary 0.0564
Table 13: The probability distributions of request service time obtained from NCTU records.
Service time (ms/request) PDF of ED (𝐸) PDF of RD (𝑂) CDF of ED CDF of RD (𝐸 − 𝑂)2/𝐸
[0, 12] 39.046% 76.060% 39.046% 76.060% 0.3509 (12, 24] 23.800% 18.210% 62.846% 94.270% 0.0131 (24, 36] 14.507% 4.360% 77.353% 98.630% 0.0710 (36, 48] 8.843% 1.040% 86.196% 99.670% 0.0688 (48, 60] 5.390% 0.250% 91.586% 99.920% 0.0490 (60, 72] 3.285% 0.060% 94.871% 99.980% 0.0317 (72, 84] 2.003% 0.020% 96.874% 100.000% 0.0196 (84, 96] 1.221% 0.000% 98.094% 100.000% 0.0122 (96, 108] 0.744% 0.000% 98.838% 100.000% 0.0074 (108, 120] 0.454% 0.000% 99.292% 100.000% 0.0045 (120, 132] 0.276% 0.000% 99.568% 100.000% 0.0028 (132, 144] 0.169% 0.000% 99.737% 100.000% 0.0017 (144, infinite) 0.263% 0.000% 100.000% 100.000% 0.0026 Summary 0.6354
Average service time= 12.62 ms/request
100 90 80 70 60 50 40 30 20 10 0 CD F (%) 0 (13, 26] (0, 13] (26, 39] (39, 52] (52, 65] (65, 78] (78, 91] (91, 104] (104, 117] (117, 130] (130, 143] (143, 156] (156, infini te )
Service time (ms/request) RD
ED
Figure 9: Comparison of the measured IFM service time and its corresponding cumulative probability density using the exponential
distribution function (average service time1/𝜇 = 12.62 ms).
Consider Let 𝑐 ∑ 𝑖=0 𝑃𝑖= 1 ⇒ 𝑃𝑘= 1 𝑘!( 𝜆 𝜇) 𝑘 𝑃0 ∀𝜌 = 𝜆 𝜇 ⇒ 𝑃𝑐= 𝜌𝑐 𝑐!𝑃0= 𝜌𝑐/𝑐! ∑𝑐𝑘=0(𝜌𝑘/𝑘!)= Pr𝑙(𝑐) = 𝐵𝐿. (15)
4.2.2. Analysis of Criteria. The cost and SLA were regarded
as the criteria, and the analyzed results are presented in this section.
(1) Criterion 1: Cost. The proposed equations were used to calculate the costs of a traditional local server versus a PaaS platform. The costs were calculated using GAE, for which
Average service time= 24.24 ms/request 100 90 80 70 60 50 40 30 20 10 0 PD F (%) (0, 12] (12, 24] (24, 36] (36, 48] (48, 60] (60, 72] (72, 84] (84, 96] (96, 108] (108, 120] (120, 132] (132, 144] (144, infini te )
Service time (ms/request) ED
RD
Figure 10: The PDF of request service time obtained from NCTU records.
Average service time= 24.24 ms/request
100 90 80 70 60 50 40 30 20 10 0 CD F (%) 0 (0, 12] (12, 24] (24, 36] (36, 48] (48, 60] (60, 72] (72, 84] (84, 96] (96, 108] (108, 120] (120, 132] (132, 144] (144, infini te )
Service time (ms/request) RD
ED
Figure 11: Comparison of the measured NCTU service time and its corresponding cumulative probability density using the exponential
distribution function (average service time1/𝜇 = 24.24 ms).
people are charged according to the billing quota, as shown in Tables2and3inSection 2.
(a) Local Server Costs. Based on (3), the costs include network
costs, electricity, server depreciation expenses, and personnel costs. The price of a server was assumed to be NT 60,000 depreciated over 5 years; therefore, the depreciation was 𝐶SDE = NT 1,000 per month. Electricity costs are based
on the Taiwan Power Company and electricity kilowatt-hour (KWH) formula, shown in (16):
KWH= electric power(watts) × hours
1,000 . (16)
Regarding power consumption, Barroso [19] indicated a typical power use of 200 Watts for low-end servers; therefore, the KWH value was calculated as200 (watts)×24×30/1,000 = 144. The electricity cost was based on the Electricity Tariffs Table [20] and calculated on a per-month basis using (17):
𝐶𝐸= 144 × 2.68 = 385.92 (NT/month) . (17) The network costs were omitted because both websites are in the university network. A student was hired to maintain
Table 14: Cost parameter data for CCS.
Parameter Real data
𝜉 11793 × 2−30GB 𝑟 43,200,000 (requests) 𝑘 0∼43,200,000 (requests) 𝜆 0.7635 (requests/sec) in IFM 8.3 (requests/sec) in NCTU 𝑡 86400 (sec) 𝐶𝐺 $0.12
this web server at a salary of 3000 (NT/month). The total cost of a traditional local server is shown in (18):
𝐶𝐿= 𝐶𝑁+ 𝐶𝐸+ 𝐶SDE+ 𝐶𝑃
= 0 + 386 + 1,000 + 3,000 = 4,386 (NT) . (18)
(b) PaaS Platform Costs. The probability density functions for
the NCTU and IFM websites are shown in (14). Thus, (19) is derived to calculate the costs of both (𝐶𝐶) in accordance with (4) if they operate on a PaaS platform.
Consider
𝐶𝐶= (⌈𝜉 ×∑𝑟
𝑘=0
𝑘 × (𝜆𝑡)𝑘!𝑘𝑒−𝜆𝑡⌉ − 1) × 𝐶𝐺. (19) This study used actual data from the NCTU and IFM websites to calculate the cost for the GAE PaaS platform. The incoming bandwidth cost effects were ignored because the incoming bandwidth requirements were low. The actual data shown inTable 14were substituted for the parameters.
The bandwidth cost per day of the NCTU website on the PaaS platform was calculated using (20):
𝐶𝐶= (⌈𝜉 ×∑𝑟 𝑘=0 𝑘 × (𝜆𝑡)𝑘!𝑘𝑒−𝜆𝑡⌉ − 1) × 𝐶𝐺 = (⌈11,793 × 2−30×43,200,000∑ 𝑘=0 𝑘 ×(8.3 × 86,400)𝑘!𝑘× 𝑒−8.3×86,400⌉ − 1) × $0.12 = $0.84. (20)
Based on the spot exchange rate of the US dollar to approximately 29 Taiwan dollars, the monthly cost of the NCTU website is0.84 × 29 × 30 = 730.8 (NT). A comparison of𝐶𝐶and 𝐶𝐿indicates that if the NCTU website is deployed in the cloud, the NCTU can save 83.34% of its current costs.
(c) Numerical Analysis. Sensitivity analyses of two
parame-ters,𝐶𝐶 and𝐶𝐿, and their rates of change with the change parameters were investigated as follows.
Effect of 𝜉 on 𝐶𝐶and𝐶𝐿.Figure 13shows the cost𝐶𝐶against
𝜆 𝜆 𝜆 𝜆 0 1 2 · · · c 1𝜇 2𝜇 3𝜇 c𝜇
Figure 12: State transition rate diagram for the service scheme.
0 10000 20000 30000 40000 50000
Data size per request (bytes) PaaS platform
Traditional local server 0 500 1000 1500 2000 2500 3000 3500 C o st (NT) 1/𝜇 = 24.24 (ms) 𝜆 = 8.3 (request/s)
Figure 13: Effect of𝜉 on 𝐶𝐶and𝐶𝐿.
0 1000 2000 3000 4000 5000 6000 0 10 20 30 40 50 60 C o st (NT) PaaS platform Traditional local server
1/𝜇 = 24.24 (ms)
𝜆 (request/s)
Figure 14: Effect of𝜆 on 𝐶𝐶and𝐶𝐿.
request𝜉 increases. This phenomenon is explained as follows: when the amount of data per request increases, the cost𝐶𝐶 is higher in the PaaS platform. Regardless of the amount of data per request changes, the cost𝐶𝐿for a traditional local server is not influenced.Figure 13shows the importance of accounting for the amount of data per request when seeking cost reductions on a PaaS platform.
Effect of 𝜆 on 𝐶𝐶and𝐶𝐿.Figure 14shows the cost𝐶𝐶against
𝜆, which indicates that 𝐶𝐶 increases as the average request arrival rate𝜆 increases. This phenomenon is explained as follows: as the average request arrival rate𝜆 increases, the cost 𝐶𝐶in the PaaS platform increases. Conversely, regardless of whether the average request arrival rate𝜆 changes, the cost 𝐶𝐿 is not influenced in a traditional local server setup.Figure 14
shows the importance of the average request arrival rate𝜆 in reducing costs on the PaaS platform.
Table 15: SLA parameter data for a traditional local server.
Parameter Real data
𝜆 0.0165 (requests/sec) for IFM
8.3 (requests/sec) for NCTU
1/𝜇 12.62 (ms) for IFM
24.24 (ms) for NCTU
𝜌 0.00021 for IFM
0.201 for NCTU
𝑐 256 maximum clients
(2) Criterion 2: Service Level Agreement. This study also examined the SLA in accordance with SBR. When a service provider cannot manage a large number of simultaneous users, service errors or an inability to complete the services occur, which may result in a loss of customers. Therefore, the SBR for traditional local servers and the PaaS platform was calculated based on the previously derived equations.
(a) SLA for Local Servers. The majority of website developers
use the Apache HTTP Server to build their websites. In the Apache HTTP Server, the directive sets the limit on the number of simultaneous requests that can be served, with a default value of 256. Therefore, it is assumed that𝑐 is equal to 256, which is the maximum number of connections that can be processed simultaneously.
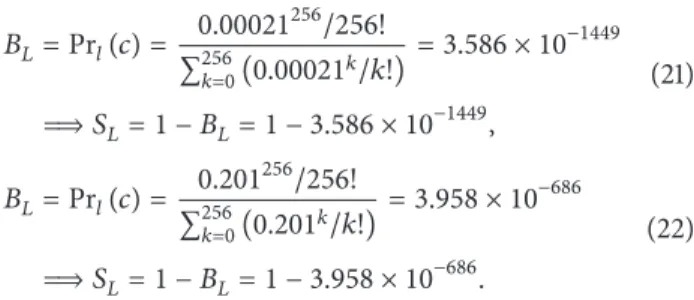
In accordance with the analytic models, the service process can be modeled using a simple M/M/c/c queue with the parameters 𝜆 and 1/𝜇, as shown in (15). The SLA can be calculated using (6) and (15). The parameters obtained from real data for the IFM and NCTU websites are shown inTable 15. Therefore, (21) and (22) are used to calculate the SLAs of the IFM and NCTU websites, respectively, for a local server. Consider 𝐵𝐿= Pr𝑙(𝑐) = 0.00021 256/256! ∑256𝑘=0(0.00021𝑘/𝑘!)= 3.586 × 10 −1449 ⇒ 𝑆𝐿= 1 − 𝐵𝐿= 1 − 3.586 × 10−1449, (21) 𝐵𝐿= Pr𝑙(𝑐) = 0.201 256/256! ∑256𝑘=0(0.201𝑘/𝑘!) = 3.958 × 10 −686 ⇒ 𝑆𝐿= 1 − 𝐵𝐿= 1 − 3.958 × 10−686. (22)
(b) SLA for PaaS Platforms. For CCS, the probability that
the maxima possible requests are exceeded in 1 minute was calculated; the SLA for the PaaS platform can be obtained by using (6) and (14). The actual data parameters are shown in
Table 16: SLA parameter data for CCS.
Parameter Real data
𝜆 0.0165 (requests/sec) for IFM
8.3 (requests/sec) for NCTU
𝑡 60 (sec)
𝑛 Maximum rate of 45,200 (requests)
calculate the SLAs of the IFM and NCTU websites in the PaaS platform, respectively. Consider 𝐵𝐶= ∑∞ 𝑘=𝑛+1 (𝜆𝑡)𝑘𝑒−𝜆𝑡 𝑘! = ∑∞ 𝑘=45200+1 (0.0165 × 60)𝑘𝑒−0.0165×60 𝑘! = 1.110 × 10⁻¹⁶ ⇒ 𝑆𝐶= 1 − 𝐵𝐶= 1 − 1.110 × 10⁻¹⁶, (23) 𝐵𝐶= ∑∞ 𝑘=𝑛+1 (𝜆𝑡)𝑘𝑒−𝜆𝑡 𝑘! = ∑∞ 𝑘=45200+1 (8.3 × 60)𝑘𝑒−8.3×60 𝑘! = 10−10 ⇒ 𝑆𝐶= 1 − 𝐵𝐶= 1 − 10−10. (24)
(c) Numerical Analysis. A numerical analysis of the models
was used to investigate the network behavior of the RAIT, amount of data, and service time. It was assumed that the arrival rate has an ED with a mean of𝜆 and the service time has an ED with a mean of1/𝜇. The change in 𝐵𝐶 and𝐵𝐿 was examined using the change parameters. The effects of the input parameters were examined as follows.
Effect of 𝜆 on 𝑆𝐶 and𝑆𝐿.Figure 15shows the SLA𝑆𝐶 and
𝑆𝐿 against 𝜆, and indicates that 𝑆𝐶 and 𝑆𝐿 increase as the average request arrival rate𝜆 increases. This phenomenon is explained as follows: as the average request arrival rate 𝜆 increases, the SLA 𝑆𝐶 and𝑆𝐿 for both the PaaS platform and the local server increases. The effect of𝜆 on 𝑆𝐶is more important than the effect of𝜆 on 𝑆𝐿. For an average arrival rate of𝜆 = 750 request/sec, the SLA decreases rapidly in the PaaS platform. By contrast, on a traditional local server, the SLA decreases slowly until an average arrival rate of 𝜆 = 8000 request/sec is achieved. Although cloud computing has an infinite capacity, the PaaS platform is limited by its maximum rate quota.Figure 15, shows the importance of the average arrival rate𝜆 in understanding the SLA on the PaaS platform versus a local server.
Effect of1/𝜇 on 𝑆𝐶and𝑆𝐿.Figure 16shows the SLA𝑆𝐶against
1/𝜇, which indicates that 𝑆𝐿decreases as the average service
time1/𝜇 increases. This phenomenon is explained as follows:
0 10 20 30 40 50 60 70 80 90 100 0 1500 3000 4500 6000 7500 9000 10500 SL A (%) PaaS platform Traditional local server
𝜆 (request/s)
1/𝜇 = 24.24 (ms)
Figure 15: Effect of𝜆 on 𝑆𝐶and𝑆𝐿.
0 10 20 30 40 50 60 70 80 90 100 0 0.5 1 1.5 2 2.5 3 3.5 SL A (%) 𝜆 = 200 (request/s) Service time1/𝜇 (s) PaaS platform
Traditional local server
Figure 16: Effect of1/𝜇 on 𝑆𝐶and𝑆𝐿.
as the average service time1/𝜇 increases, the SBR 𝑆𝐿decreases in the traditional local server. Conversely, regardless of the manner in which the average service time1/𝜇 changes, the SLA𝑆𝐶has no effect in the PaaS platform.Figure 16shows that the average service time1/𝜇 is a crucial factor in reducing the SLA on a local server. When the average service time is long, moving to a service that deploys on a PaaS platform may mitigate or avoid the SBR problem.
4.2.3. Analysis of Deployment Strategy. For deployment
strat-egy decision making, AHP is used to calculate the score of each strategy in this section. In accordance with (19), (20), (22), and (24), this study used (13) and a number of parameters to calculate the value of𝛿 as (25) for the NCTU website deployment. The parameters were as follows:𝐶𝐿 = 4386, 𝐶𝐶 = 730.8, 𝑆𝐿 = 1 − 3.958 × 10−686, and 𝑆
𝐶 =
1 − 10−10. The results show that the value of𝛿 is equal to
6.99934 × 10⁻¹¹ and 𝑆𝐶 is larger than 0.99. Therefore, the NCTU website would be suitable for deployment as a CCS in the PaaS platform if the website administrator assumes that the weight of cost 𝑤𝐶 is equal to the weight of SLA 𝑤𝑆 (26). Because 𝑆𝐿 is similar to𝑆𝐶, the SLA has a small effect on strategy decision making. It is possible to deploy in a traditional local server when 𝑤𝑆 must be larger than (𝑤𝐶 × 1011)/6.99934 (see (27)). For the IFM case, the value
of𝛿 was smaller than that in the NCTU case because the cost of IFM website was lower than that of the NCTU website and the SLA of the IFM website is higher than that of the
NCTU website. Therefore, the IFM website was also suitable for deployment as a CCS in the PaaS platform.
Consider 𝛿 =(𝐶𝐿+ 𝐶𝐶) (𝑆𝐿− 𝑆𝐶) (𝐶𝐿− 𝐶𝐶) (𝑆𝐿+ 𝑆𝐶) = (4386 + 730.8) [(1 − 3.958 × 10 −686) − (1 − 10−10)] (4386 − 730.8) [(1 − 3.958 × 10−686) + (1 − 10−10)] = 6.99934 × 10⁻¹¹, (25) 𝑤𝐶 𝑤𝑆 = 1 > 𝛿 = 6.99934 × 10⁻¹¹, (26) 𝑤𝐶 𝑤𝑆 < 𝛿 = 6.99934 × 10⁻¹¹ ⇒ 𝑤𝑆> 𝑤𝐶× 10 11 6.99934 . (27)
4.3. Discussion. This study used two websites to simulate
and analyze the cost and SLA of deploying services using GAE. The mathematical models based on AHP presented in Section 3 were used to analyze the cost and SLA for the PaaS platform and a traditional local server. The results show that if the NCTU website is deployed using GAE, the university would save over 83.34% of its current expenditures compared to deploying on a traditional local server; this also has a negligible low effect on the SLA. This shows that the NCTU web service is appropriate for cloud computing, and its subsidiary website is suitable for IFM.
A simulation analysis from a cost perspective shows that when the amount of data per request and average request arrival rate 𝜆 increase, the cost 𝐶𝐶 in the PaaS platform is higher. Conversely, variations in the amount of data per request or𝜆 have no influence on the cost 𝐶𝐿in a traditional local server. The results also show that as user demand on the network increases, the importance of SLA decreases, and deployment in the cloud may help to reduce average service times.
5. Conclusions and Future Work
This paper proposes an analytical framework that uses the curve-fitting method and analyzes user access records from the web server to generate the network behavior patterns for analyses of cost and SLA. Furthermore, this framework uses AHP to calculate the score of deploying on the PaaS platform and deploying on a traditional local server for decision making. When user demands are low, deploying services in the cloud costs less than deploying them on a traditional local server. Because it is more difficult to collect the records from business websites, academic websites which including the IFM and NCTU websites were selected as test cases and used to simulate and analyze the costs and SLA of deploying services in GAE. The results show that if the NCTU website is deployed using GAE, the university would save over 83.34% of its current expenditures than by deploying in a traditional local server; this also has a negligible effect on the SLA. However, the simulation analysis showed that,
as user demand on the network increases, the importance of SLA decreases, and deploying in the cloud can help to reduce the average service time.
In future studies, the authors plan to broaden their research criteria and analyze the uses of CPU time and time spent on accessing databases; for example, various types of services have various probability density functions. These services must be further investigated in subsequent studies. In addition, the business website administrators can use the proposed framework to analyze their website records and select an optimal strategy for CCS deployments.
Acknowledgment
This study was supported by the National Science Council of Taiwan under Grants nos. NSC 100-2410-H009-039-SS2, NSC 101-2420-H-009-004-DR, and NSC 102-2410-H-009-052-MY3.
References
[1] L. M. Vaquero, L. Rodero-Merino, J. Cceres, and M. Lindner, “A break in the clouds: towards a cloud definition,” ACM
SIG-COMM Computer Communication Review, vol. 39, no. 1, pp. 50–
55, 2009.
[2] C. H. Chen, B. Y. Lin, H. C. Chang, and C. C. Lo, “The novel positioning algorithm based on cloud computing—a case study of intelligent transportation systems,” Information, vol. 15, pp. 4519–4524, 2012.
[3] P. Mell and T. Grance, The NIST Definition of Cloud Computing, National Institute of Standards and Technology Special Publi-cation 800-145, 2011.
[4] S. Subashini and V. Kavitha, “A survey on security issues in ser-vice delivery models of cloud computing,” Journal of Network
and Computer Applications, vol. 34, no. 1, pp. 1–11, 2011.
[5] G. Lawton, “Developing software online with platform-as-a-service technology,” Computer, vol. 41, no. 6, pp. 13–15, 2008. [6] Google App Engine, “What is google app engine,” Google Inc.,
2012, http://code.google.com/intl/en/appengine/docs/whatis
-googleappengine.html.
[7] M. Armbrust, A. Fox, R. Griffith et al., “A view of cloud com-puting,” Communications of the ACM, vol. 53, no. 4, pp. 50–58, 2010.
[8] A. Bisong and S. M. Rahman, “An overview of the security concerns in enterprise network security,” International Journal
of Network Security and Its Applications, vol. 3, pp. 30–45, 2011.
[9] J. C. Mogul, “Network Behavior of a Busy Web Server and its Clients,” Tech. Rep. 95/5, Digital Equipment Corporation, Western Research Laboratory, 1995.
[10] J. Kang and K. M. Sim, “Cloudle: a multi-criteria cloud service search engine,” in Proceedings of the IEEE Asia-Pacific Services
Computing Conference (APSCC ’10), pp. 339–346, Hangzhou,
China, December 2010.
[11] E. Deelman, G. Singh, M. Livny, B. Berriman, and J. Good, “The cost of doing science on the cloud: the montage example,” in
Proceedings of the International Conference for High Performance Computing, Networking, Storage and Analysis (SC ’08), pp. 1–12,
Austin, Tex, USA, November 2008.
[12] T. L. Saaty, “A scaling method for priorities in hierarchical structures,” Journal of Mathematical Psychology, vol. 15, no. 3, pp. 234–281, 1977.
[13] G. H. Tzeng and J. J. Huang, Multiple Attribute Decision Making:
Methods and Applications, CRC Press, Taylor & Francis Group,
New York, NY, USA, 2011.
[14] T. L. Saaty, “How to make a decision: the analytic hierarchy process,” European Journal of Operational Research, vol. 48, no. 1, pp. 9–26, 1990.
[15] C. H. Chen, H. C. Chang, C. Y. Su, C. C. Lo, and H. F. Lin, “Traf-fic speed estimation based on normal location updates and call arrivals from cellular networks,” Simulation Modelling Practice
and Theory, vol. 35, pp. 26–33, 2013.
[16] H. C. Chang, C. H. Chen, B. Y. Lin, H. Y. Kung, and C. C. Lo, “Traffic information estimation using periodic location update events,” International Journal of Innovative Computing,
Informa-tion and Control, vol. 9, pp. 2031–2041, 2013.
[17] B. Y. Lin, C. H. Chen, H. C. Chang, and C. C. Lo, “A network behavior analysis system for cloud computing service,”
Informa-tion, vol. 14, pp. 931–938, 2011.
[18] Y. B. Lin, M. H. Tsai, H. W. Dai, and Y. K. Chen, “Bearer reser-vation with preemption for voice call continuity,” IEEE
Transac-tions on Wireless CommunicaTransac-tions, vol. 8, no. 5, pp. 2716–2725,
2009.
[19] L. A. Barroso, “The price of performance: an economic case for chip multiprocessing,” ACM Queue, vol. 3, pp. 49–53, 2005. [20] Taiwan Power Company, “The electricity tariffs table,” 2012,
http://www.taipower.com.tw/content/q service/images/main 3 6 3.pdf.
Submit your manuscripts at
http://www.hindawi.com
Hindawi Publishing Corporation
http://www.hindawi.com Volume 2014
Mathematics
Journal ofHindawi Publishing Corporation
http://www.hindawi.com Volume 2014
Hindawi Publishing Corporation http://www.hindawi.com
Differential Equations
International Journal of Volume 2014
Applied MathematicsJournal of
Hindawi Publishing Corporation
http://www.hindawi.com Volume 2014
Hindawi Publishing Corporation
http://www.hindawi.com Volume 2014
Hindawi Publishing Corporation
http://www.hindawi.com Volume 2014
Mathematical PhysicsAdvances in
Complex Analysis
Journal ofHindawi Publishing Corporation
http://www.hindawi.com Volume 2014
Optimization
Journal ofHindawi Publishing Corporation
http://www.hindawi.com Volume 2014
Combinatorics
Hindawi Publishing Corporation
http://www.hindawi.com Volume 2014
International Journal of Hindawi Publishing Corporation
http://www.hindawi.com Volume 2014
Journal of Hindawi Publishing Corporation
http://www.hindawi.com Volume 2014
Function Spaces
Abstract and Applied Analysis
Hindawi Publishing Corporation
http://www.hindawi.com Volume 2014 International Journal of Mathematics and Mathematical Sciences
Hindawi Publishing Corporation http://www.hindawi.com Volume 2014
The Scientific
World Journal
Hindawi Publishing Corporationhttp://www.hindawi.com Volume 2014
Hindawi Publishing Corporation
http://www.hindawi.com Volume 2014
Discrete Dynamics in Nature and Society
Hindawi Publishing Corporation
http://www.hindawi.com Volume 2014
Hindawi Publishing Corporation
http://www.hindawi.com Volume 2014
Discrete Mathematics
Journal ofHindawi Publishing Corporation
http://www.hindawi.com Volume 2014
Hindawi Publishing Corporation
http://www.hindawi.com Volume 2014
![Table 1: The competitive matrix diagrams of CCS vendors [ 8 ].](https://thumb-ap.123doks.com/thumbv2/9libinfo/7502571.116578/2.900.84.826.134.249/table-competitive-matrix-diagrams-ccs-vendors.webp)
![Table 3: Billable quota unit cost [ 6 ].](https://thumb-ap.123doks.com/thumbv2/9libinfo/7502571.116578/3.900.77.437.131.288/table-billable-quota-unit-cost.webp)