利用氧電漿增進網版印刷碳膠電極之電化學特性
80
0
0
全文
(2) 利用氧電漿增進網版印刷碳膠電極之電化學特性. Improvement of Electrochemical Properties of Screen-printed Carbon Paste Electrode by Oxygen Plasma 研 究 生:王世昌. Student:Shih-Chang Wang. 指導教授:袁俊傑 博士. Advisor:Dr. Chiun-Jye Yuan. 國 立 交 通 大 學 生 物 科 技 系 所 碩 士 論 文. A Thesis Submitted to Department of Biological Science and Technology National Chiao Tung University in partial Fulfillment of the Requirements for the Degree of Master in Biological Science and Technology July 2005 Hsinchu, Taiwan, Republic of China. 中華民國九十五年七月.
(3) 利用氧電漿增進網版印刷碳膠電極之電化學特性 學生:王世昌. 指導教授:袁俊傑 博士. 國立交通大學生物科技系暨研究所碩士班. 中文摘要 網版印刷碳膠電極近年來被廣泛的應用在電化學感測器中,它有 著低成本、製造簡單、可圖案化等的優點,適合用在拋棄式的感測系 統,本研究中針對氧電漿處理網版印刷碳膠電極做了詳盡的研究。 我們發現修飾後電極對偵測過氧化氫的氧化電流有明顯的大幅 提升,連續使用的再現性良好 (R.S.D= 6.9%, n= 75),效果可維持超 過3各月,接著將葡萄糖氧化酶固定在電極表面上,進行葡萄糖感測, 修飾後電極能比未修飾電極的最低偵測濃度的要低10倍,大幅提升了 感測的靈敏度,同時顯示出修飾後電極應用在以氧化酶為主的電化學 感測器的潛力。 從多巴胺、鐵氰化鉀、鄰苯二酚的循環伏安圖中,我們發現電漿 處理大幅提升了氧化還原物質與電極間的電子轉移速率,從電顯圖推 測電漿處理能清除掉碳膠電極表層及表層縫隙間不利於電子轉移的 黏膠,同時暴露出較多擁有良好電子轉移特性的石墨結晶區域,以達 到增進氧化還原物質與電極間的電子轉移速率的效果。最後在尿酸/ 維他命C複合式感測系統中,修飾過後電極因為具有良好的電子轉移 I.
(4) 特性,能大幅排除兩氧化還原物質者間的相互干擾,提高了感測的準 確度,同時也顯示出修飾後電極應用到複合式感測器的潛力。. II.
(5) Improvement of Electrochemical Properties of Screen-printed Carbon Paste Electrode by Oxygen Plasma Student:Shih-Chang Wang. Advisor:Dr. Chiun-Jye Yuan. Department of Biological Science and Technology National Chiao Tung University. Abstract Screen-printed carbon paste electrode (SPCE) is widely used in electrochemical sensors in recent years. SPCE exhibits a great potential in the generation of disposable sensing system because it is cost effective, easily mass-produced and easily patterned. In this study, the modification of SPCE by oxygen plasma was thoroughly investigated. Interestingly, the response of oxidative current of hydrogen peroxide was greatly improved at plasma-treated SPCE. It had a good reproducibility in duplicate test (CV=6.9%, n=75) and storage test (over 3 months). The glucose sensor fabricated on the plasma-treated SPCE has a much lower detection limit for glucose than that fabricated on the untreated SPCE. These results indicate that plasma-treated SPCE has the potential for enhancing the sensitivity of oxidase-based electrochemical sensor. The rate of electron transfer between the redox couple and the electrode of SPCE is also greatly enhanced by the oxygen plasma treatment, as demonstrated by the cyclic voltammograms of dopamine, ferricyanide, and catechol. The electrochemical properties of SPCE is improved by the reduction of the separation between oxidative and reductive peak potentials, and approaching to the approximately unit of peak currents for redox compounds. The improvement of the III.
(6) electrochemical properties of SPCE allows the detection of multiple analytes, such as uric acid and ascorbic acid, on SPCE at the same time. Microscopic images of SPCE under the reflective microscope reveal that the surface of SPCE is flattened by oxygen plasma, suggesting the removal of substances from the surface of SPCE. The microscopic images under the scanning electronic microscope further demonstrate that pasting binder, an adhesive material to glue graphite particles to each other and to the surface of solid substrate, is removed. The removal of the pasting binder on the surface of electrode exposes graphite particles and their edge-plane, which facilitates the rate of electron transfer.. IV.
(7) Acknowledgment 首先感謝 袁俊傑老師ㄧ直以來的細心指導與照料,以及 張谷昇 老師在碩士期間的指導與協助,感謝口試委員 楊裕雄老師、 梁勝富 老師給的寶貴意見,感謝 彭慧玲老師對我生活上的關心。 感謝實驗室的成員 俊炫、君璇、威震、弘毅、佳穎、奕榮、詩 穎、彥棋、偉志、雯世、俊能,以及已畢業的學長姐 宗翰、柏文、 欣怡、岳晉、元碩,有了你們,讓我的研究生生活更加充實。 最後感謝我的家人、朋友和女友的一路支持與陪伴,謝謝你們。. V.
(8) Content 中文摘要..................................................................................................... I Abstract .....................................................................................................III Acknowlegement .......................................................................................V Content..................................................................................................... VI Content of Table ..................................................................................... VII Content of Figures .................................................................................VIII Introduction.................................................................................................1 Material and Methodology........................................................................11 Result and Discussion...............................................................................16 Reference ..................................................................................................29 Appendix 1 The apparatus of electrochemical experiment ......................67 Appendix 2 The apparatus of plasma modification..................................68 Appendix 3 The crystal structure of graphite…………………………...69. VI.
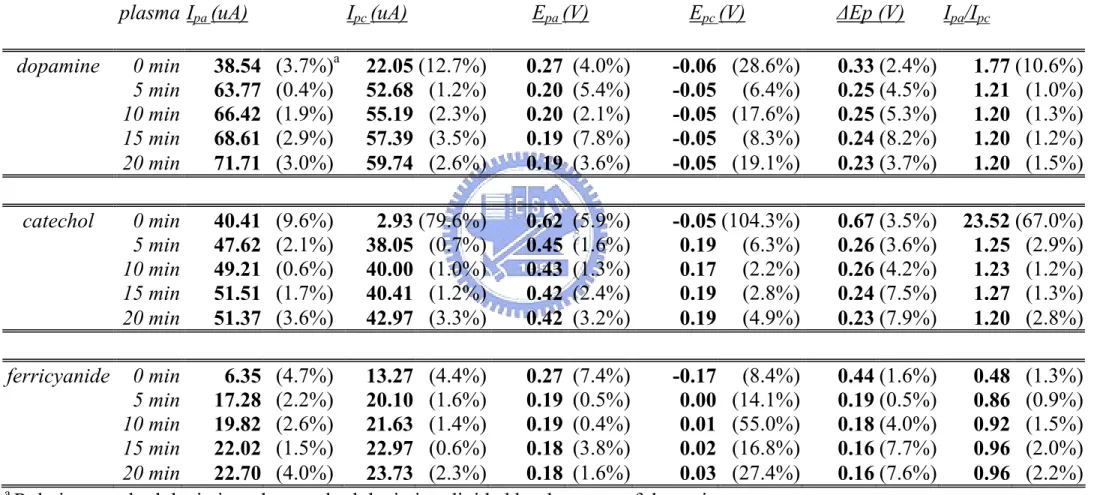
(9) Content of Table Table 1.. data of Ipa, Ipc, Epa, Epc, ∆Ep and Ipa/Ipc from CV of dopamine, catechol and ferricyanide at plasma-treated SPCE …………38. VII.
(10) Content of Figures Figure 1. Amperometric response of 1 mM H2O2 for SPCE treated with oxygen plasma with different power ................................... 39 Figure 2. Stability of SPCE treated with oxygen plasma at different power…...………………………………………………….40 Figure 3. Light micrographs of the surface of SPCE after treating with plasma of different power .................................................... 41 Figure 4. Amperometric response of SPCE treated with oxygen plasma for different treating times to 1 mM H2O2 ........................... 42 Figure 5. Light micrograph of the surface of SPCE treated with oxygen plasma .................................................................................. 43 Figure 6. CV of untreated and treated SPCE………………………….44 Figure 7. CV of (A) dopamine, (B) catechol and (C) ferricyanide at SPCE. treated. with. oxygen. plasma…………..……..………45 Figure 8. Scanning Electron Micrograph of the surface of SPCE treated with oxygen plasma………………………………………..48 Figure 9. Scanning Electron Micrograph of the bump of SPCE treated with oxygen plasma ............................................................. 49 Figure 10. Scanning Electron Micrograph of the flat of SPCE treated with oxygen plasma……………………..………..50 Figure 11. The mechanism proposed for improvement of electrochemical properties of SPCE by oxygen plasma.....51 Figure 12. Contact angle test of plasma-treated SPCE………………..52 Figure 13. Amperometric response of SPCEs with different treatments VIII.
(11) to 1 mM H2O2 at different applied voltages……………...53 Figure 14. Reproducibility of SPCE treated with 100 W oxygen plasma for 15 min………………………………………………...54 Figure 15. Stability of SPCE treated with 100 W oxygen plasma for 15 min after long term storage …….………………………...55 Figure 16. Step responses of glucose biosensor to sequentially added 100 uM glucose…………………………………………..56 Figure 17. Linear dynamic range of glucose of the glucose biosensor.57 Figure 18.. Lowest detection limit of fabricated glucose biosensors .... 59. Figure 19. CV of ascorbic acid and uric acid………..………………..60 Figure 20. CV of mixture of ascorbic acid and uric acid……………..62 Figure 21. Detecting dynamic range of ascorbic acid and uric acid….64 Figure 22. The effect of 100 uM interference for detection of uric acid and ascorbic acid…………………………………………66. IX.
(12) Introduction 1-1. Electrochemical biosensor Electrochemical biosensors are based on the measurement of the electrochemical species involved in a biological or chemical reaction. It is commonly used in monitoring pollutants, food additives and clinical diagnosis [1]. Based on the electrochemical property, the detective systems can be divided into conductometric, potentiometric, and amperometric biosensors [2]. Conductometric biosensors measure the changes in conductance between a pair of electrodes in a bulk solution [3]. Potentiometric biosensors measure the potential at the working electrode, and detect the accumulation of charge created by selective binding at the electrode surface [4]. Amperometric biosensors measure the changes of the redox current at the working electrode in the biochemical reactions [5].. 1-1-1. Amperometric biosensors Two major electrochemical measurements can be performed in the amperometric biosensors, amperometry and voltammetry. Amperometric measurement records the current flow under a fixed applied potential. Voltammeteric measurement records the change of current relative to a functional potential. The basic set up of the electrochemical biosensors is composed of an electrochemical analyzer and a reaction cell consisting of two/three electrodes immerse in a suitable electrolyte. For a careful measurement, a 1.
(13) three-electrode cell is usually adapted in the set up. The working and conducting electrodes, at which the oxidation/reduction reaction occurs, provide a conductive pathway for redox current. Metals, such as gold [6], platinum [7], silver [8], copper [9], nickel [10] and etc, carbon (carbon paste [11], glassy carbon [12] ) and transparent conductive oxide (ITO) [13] are widely used as the working electrodes. Chemical inert conducting materials, such as gold and platinum, are usually used as counter electrode. The reference electrodes, including Ag/AgCl and Hg/Hg2Cl2, provide a stable potential compared to the working electrode. A supporting electrolyte is required to eliminate the electro-migration effect, decrease the resistance of the solution and maintain the ionic strength constant [14].. 1-1-2. Screen-printed Carbon Paste Electrode (SPCE) Screen-printing is one of the thick film techniques suited for mass production in industry. This technique allows paste material to be printed onto a substrate directly through a mask-net with a designed pattern. Carbon paste, a mixture of carbon powder and liquid binder, was first proposed in 1958 to be used in the preparation of a solid electrode, called carbon paste electrode [15]. Liquid binder, such as mineral oil [16] and silicone oil [17], is responsible for the adhering of carbon particles. Screen-printed carbon paste electrodes (SPCE) exhibit a great potential in the generation of disposable sensing system because it is cost effective, easily mass-production and capable of generating various patterns [18].. 2.
(14) 1-2. Surface modification of SPCE Although SPCE is broadly used in the production of electrochemical biosensors, it suffers from low sensitivity, slow response time and high applied potential for redox reactions. Several techniques, such as metallization, activation, selective membrane coating and surface modification, have been employed to improve the electrochemical properties of SPCE to improve its sensitivity or selectivity of electrochemical biosensors.. 1-2-1. Metallized electrode Detection of hydrogen peroxide (H2O2), produced in the enzyme reaction, is a routine for an oxides-based electrochemical biosensor. The concentration of H2O2 can be measured by a directly electrochemical oxidation. However, a high applied potential (≧0.6V versus Ag/AgCl ) is required to generate a significant electrochemical response. With this high applied potential, many electrochemical active species, such as urate and ascorbate, may also be oxidized and then influence the accuracy of the measurement [19, 20]. Therefore, it is necessary to reduce the applied potential to hydrogen peroxide to eliminate the effect of unwanted electrochemical active species. Metals, such as palladium, platinum, Ruthenium, Rubidium, gold, copper and iridium had been demonstrated to reduce the over-potential of hydrogen peroxide oxidation/reduction due to their excellent catalytic effect [21-25]. The mechanism is illustrated below [26, 27]. The modification of electrode by palladium and platinum can 3.
(15) effective reduce the over-potential of hydrogen peroxide (< 0.2V versus Ag/AgCl), which prevents urate and ascorbate in serum from co-oxidation. The metallization of electrode can be done by electrochemical deposition, sputtering or mixing the metal particles with carbon paste [23-25]. Catalytic metal has great efficacy in enhancing the sensitivity and selectivity of electrode. M (OH)2 + H2O2 Æ M + 2H2O + O2 M + H2O Æ M(OH)2 + 2e- + 2H+. (M=Pt or Pd). [26, 27]. 1-2-1. Carbon nanotube (CNT)-modification The carbon nanotube (CNT) was first discovered by Iijima in 1991[28]. CNTs exhibits an unique combination of excellent mechanical, electrical and electrochemical properties [29]. CNT is capable of accelerating rate of electron transfer due to its porous structure on surface and better wetting property. Moreover, CNT facilitate electron transfer by acting as a nano electric connecter between the active site of enzyme and electrode [30-32]. CNT-modified electrode have been shown to improve the electrochemical response of many compounds, such as H2O2, NADH, catechol, ascorbic acid, dopamine, epinephrine and nitric oxide [33-38]. However, whether CNT exhibits an electrocatalytic activity is controversial. Compton and colleagues suggested that the eletrochemical property of CNT is similar to that of graphite in electrochemical reactions [39-41]. 1-2-3. Redox Mediator Redox mediators, such as hexacyanoferrate, Prussian blue, 4.
(16) methylene blue (PB), and quinine-hydroquinone, make redox reaction at relative low potential [42-45]. These mediators can reduce the over-potential by coupling redox reaction with analyst, and then it measures the redox current from mediator in place of analyst at relative low potential [46]. PB is one of the most commonly used mediators that are widely used in the biosensors recently. The film of PB on the electrode can be easily generated by electrochemical deposition in a mixture of FeCl3 and K2Fe(CN)6- [47]. It has been reported that PB-mediated electrode can reduce the applied potential at around 0 V versus Ag/AgCl [48].. 1-2-4. Selective Membrane The existence of highly electrochemical active agents may interfere the measurement of normal biological analyte. On way to reduce the interfering effect is to lower the working potential, while blocking the access of interfering agents to the surface of electrode is another. Modification of the surface of electrode with a selective membrane is effective in reducing the interference of electrochemical active agents. Uric acid and vitamin C are two commonly encountered interfering 5.
(17) agents in the serum. They become negative charged in neutral solution. Nafion, a perflurosulfonated derivative of Teflon, is permeable to cations but almost impermeable to anions. Several lines of evidence indicate that electrodes modified with nafion can effectively eliminate the interference of uric acid and ascorbic acid [49-51]. Modifications with poly{pyrrole-co-[3-(pyrrol-1-yl)propanesulfonate]} and poly(2-picolinic acid) exhibit the similar effect to the interference [52, 53].. 1-2-5. Activated by pretreatment Electrochemical pretreatment, e.q. anodization, has been shown to enhance the electrochemical properties of SPCE. A short pre-anodization treatment may improve the reversibility of redox reaction of the electrode due to increase of the functionalities and roughness of the surface or removal of surface contaminants [54]. The effect of different cleaning solutions in the pre-anodization of SPCE has been tested. Pretreatment of SPCE using saturated Na2CO3 at 1.2 V for 5 min proves to be an effective condition to activate SPCE. The electrochemical pretreatment may effectively remove the organic binders, mineral oil and/or other organic substances from the surface of electrode [55]. Anodization is a simple method to improve the performance of SPCE.. 1-3. Plasma Plasma is often described as the fourth state of matter; whereas other three universally recognized states of matter are solid, liquid, and gas states. For instance, adding energy to ice in the form of heat, the ice becomes liquid water. The ice absorbs the heat energy subsequently in a 6.
(18) higher energy state as liquid. If continuing to heat the water, it will boil to be gas. Gas is the highest energy state among theses three. If continuing to add energy to the gas, under the right conditions, the plasma would form. Plasma is a partially ionized gas that is electromagnetically controllable. Plasma consists of ions, electrons, free radicals, and other neutral species. The electrons are the negative components of an atom moving constantly in an orbit around the nucleus. In the gas state, a few electrons in an atom may be free when exposed to an energy source resulting in the formation of plasma. The escaping electrons gain speed and collide into other atoms. With enough energy, the collision may free electrons from these atoms and cause a chain reaction. A positive ion is formed when an electron is released from an atom or molecule, of which the number of electrons is less than that of protons in the nucleus. It is also possible that a free electron may allow atoms to separate from a molecule without knocking off or adding any electrons to the atoms. Atoms at this state are called free radicals, which contain one or more unpaired electrons. Since ions and free radicals created in the plasma are unstable and continuously reverting back to normal, neutral gas state via reaction, recombination or emission of a proton. When they give off energy in the form of light and heat, the species emits a photon. The visible light is sometimes a characteristic of plasma. The ultraviolet photons carry energy that breaks bonds. Therefore, plasma is composed of many chemically reactive species, including electrons, positive ions, negative ions, free radicals and photons. This makes plasma useful for the surface modification of materials. 7.
(19) Ionization. e- + A2 Æ 2e- + A2+. Attachment. e- + A2 Æ A2-. Dissociation. e- + A2 Æ e- + 2A‧. Recombinant. A- + B+ Æ AB + hν. Excitation. e- + A2 Æ A2*. A + B Æ AB + hν A2*Æ A2 + hν. 1-3-1. Generaton of functional groups by plasma modification Plasma modification can give the surface new properties by forming some functional groups. This technique was broadly used in many studies, such as biomolecule immobilization, tissue engineering and biomolecule adsorption. Cross-link via covalent bond is one of the popular techniques to immobilize biomolecules. Gold metal provides an excellent Au-S covalent bond with biomolecules. However, for most of materials surface modification is needed to obtain specific functional groups, including hydroxyl-, carbonyl-, carboxyl- and amino-based functional groups, to allow a covalent bond to form between biomolecule and solid substrate. Apparently, plasma modification by using various gases should be very useful in the immobilization of biomolecules [56, 57]. Plasma can also improve the efficiency of tissue culturing by modifying the surface of cultural vessels, such as membrane, Petri dish, cultural plate and cultural flask. The cell adhesion and cell growth on the surface of the cultural vessels can be markedly improved by the modification of plasma[58-61]. The commercial polystyrene(PS) Petri dish, cultural plate and cultural flask may gain alcohol-, acid- and 8.
(20) amino-based functional groups upon the plasma treatment.. 1-3-2. Modification by film deposition Plasma can be used to coat the surface of solid substrate with metal thin layer or organic polymer. The process that coats the surface of a solid substrate with a metal by physical ion-bombardment of plasma is called the “sputtering”, which is commonly used in the semiconductor industry. Gold film, which could be produced by sputtering, is also adapted by many types of biosensor, such as QCM, electrochemical biosensors and surface plasmon resonance (SPR) [62, 63]. Plasma polymerization is a dry process to deposit a polymer film on a solid surface at a low temperature. A plasma-polymerized film (PPF) of Dimethylaminomethylferrocene (DMAMF), acting as a mediator, can be coated on a electrode for the fabrication of glucose biosensor [64]. A hexamethyldisiloxane layer can be generated by plasma polymerization on the glass substrate for adhesion of platinum layer [65]. Amino groups can be grafted on the surface of substrates by PPF of thylenediamine, which allows glucose oxidase to be immobilized on the surface via glutaraldehyde [66].. 1-3-3. Modification of surface by plasma etching Plasma has the ability to etch the surface of a substrate resulting in a roughness surface by chemical reaction. In the field of environment engineering, plasma can be used as a tool to decompose the organic wastes and pollutant. For example, Liao and colleagues used oxygen plasma to decompose (C2H5)2O to CO2 and H2O [67]. A silicon substrate 9.
(21) can be etched by the dry-etching process using the CF4 plasma and generates SiF4 gas. The surface area of a humidity sensor was increased by the treatment of oxygen plasma due to the increase of surface roughness [68] . The plasma generated from a mixture of Cl2, O2 and CF4 was used to increase the roughness of the silicon surface to improve the adhesion of cells [69].. 1-4. Purpose of experiment Screen-printed carbon paste electrodes are widely used in the electrochemical research and the fabrication of commercial biosensors. However, the industrial application of SPCE is restricted due to its slow rate of electron transfer and low electrocatalytic activity. Hence, the improvement of electrochemical properties of SPCE is important. In this study, the modification of SPCE by oxygen plasma was investigated. We found that oxygen plasma can greatly improve the electrochemical properties of SPCE. Apparently, oxygen plasma is a useful tool to modify the carbon paste electrode and provide a new concept in the future for electrochemical research and the fabrication of biosensors.. 10.
(22) Material and Methodology Reagent Glucose oxidase (EC 1.1.3.4) was puchased from Fluka. L-ascorbic acid, uric acid, potassium hexacyano-ferrate(III), glucose anhydrous and catechol were from Sigma. Sodium dihydrogenphosphate, disodium hydrogenphosphate and potasium dihydrogenphosphate were from Showa. Sodium chloride was from Amresco. Potasium chloride was from ICN. Potassium phosphate, dibasic was from Riedel-de Haën. Poly vinyl alcohol functionalized with pyridinium methyl sulfate (PVA-SbQ) was from Toyo Gosei Kogyo Co. Ltd., Japan. All solution was prepared by de-ionized distilled water. Screen-printed carbon paste electrode (SPCE) was from ApexBio (Hsinchu, Taiwan). Palladium electrode was from Roche.. Apparatus All electrochemical experiments were performed using CHI 440 instrument (CH Instruments) connected to a personal computer. Electrochemical measurement was performed using SPCE as working electrode, Au as counter electrode and Ag/AgCl as reference electrode in a beaker containing 10 mL buffer solution (Appendix 1). The solution in the beaker was stirred at a fixed rate. DC Plasma instrument consists of plasma chamber, plasma controller, pressure/heat sensor, flow controller, and vacuum pump (Appendix 2). Micrographs with 50X magnification were performed using Olympus BX51 microscope with DP12 digital camera. Electronic Microscope (Hitachi S-2400) was performed in the 11.
(23) College of Science of Nation Taiwan University.. Oxygen Plasma treatment SPCEs were placed in the chamber of plasma reactor. The chamber was evacuated at a pressure less than 50 mTorr. Then, pure oxygen (purity > 99%) was injected into the chamber at the rate of 10 sccm (standard cubic centimeter per minute). The air pressure in chamber was adjusted to around 400 mTorr, before plasma generator was started. The plasma treatment was performed at a power of 100, 200 or 300 W for the time indicated in each experiment. When plasma treatment is done, the plasma generator and air input are turned off sequentially, following returning the pressure of chamber to atmospheric pressure. The modified electrodes were kept in the dark and at room temperature before use.. Amperometric response of hydrogen peroxide (H2O2) Stock 1 M and 100 mM H2O2 solutions were fresh prepared in each experiment and kept on the ice before use. The electrolyte was with stirring at a fixed rate. The experimental set up for electrochemical reaction is a conventional three-electrode system with the working, counter and reference electrodes of SPCE, gold and Ag/AgCl, respectively. The working potential was set at 0.5 V versus Ag/AgCl. Once the background current reached a steady state, the electrochemical reaction was started by adding stock H2O2 solution into a reaction chamber containing 10 mL 1X phosphate buffer saline (PBS; 137 mM NaCl, 2.7 mM KCl, 10 mM Na2HPO4 and 2 mM KH2PO4) buffer with a constant stirring. The volume of H2O2 added was kept below 0.1 % (v/v) 12.
(24) of that of electrolyte to avoid miscalculation of the concentration of H2O2. The measurement was stop when the oxidative current reaches a steady state. The response was estimated by subtracting the background current from steady state oxidative current.. Glucose sensor Glucose sensor strip was fabricated by immobilizing glucose oxidase on the surface of SPCE via PVA-SbQ. The encapsulating of enzyme in the photo-sensitive emulation PVA-SbQ has been demonstrated in several reports [49, 70]. Enzyme solution was prepared by dissolving glucose oxidase powder in de-ionized water with a ratio of 1:12 (w/w). Enzyme solution was then mixed with PVA-SbQ in the ratio of 1:1 (v/v). A mixture of enzyme and PVA-SbQ (1.5 µL) was evenly spread on the active area of the SPCE. The electrode was placed on ice and under the exposure of visible light for 2 h. After 2 h incubation, the electrode was stored in 4ºC refrigerator for overnight. Stock solutions of 1 M, 100 mM and 10 mM glucose were fresh prepared before the electrochemical experiments. The electrolyte was 1X PBS and the working potential was set at 0.7 V versus Ag/AgCl. The amperometric response to glucose was determined as described in previous section.. Cyclic voltammetry of dopamine, catechol and ferrocynide Working, counter, and reference electrodes used in this experiment were SPCE, gold, and Ag/AgCl, respectively. The electrolyte was 1X 13.
(25) PBS, pH 7.4 (137 mM NaCl, 2.7 mM KCl, 10 mM Na2HPO4 and 2 mM KH2PO4). Before the measurement, SPCE was pretreated by CV 5 times from 0 to 1 V in 1X PBS. The background CV response was performed in 1X PBS only. Stock solution of 1 M H2O2, dopamine, catechol and ferricyanide(III) were fresh prepared to avoid oxidation in each experiment. The cyclic voltammograms of 5 mM H2O2, 1 mM dopamine, 1 mM catechol and 1 mM ferricyanide(III) were performed within potentials of -0.4~0.9 V, -0.3~0.5 V, -0.2~0.8 V and -0.4~0.6 V, respectively. The scanning rate of CV was set at 0.1 V/s. The Epa, Epc, Ipa, and Ipc were calculated by the software of CHI 440.. Uric acid (UA)/Ascorbic acid (AA) sensor The cyclic voltammograms of UA and AA were carried out in 50 mM potassium phosphate buffer, pH 7. Stock solution of 100 mM AA was fresh prepared in ddH2O. Due to the low solubility, 200 µM UA was fresh prepared in 50 mM potassium sodium phosphate buffer, pH 7. The CV was performed within potentials between -0.3 and 0.7 V with a scanning rate of 0.05 V/s. The CV of various concentration UA (0, 25, 50, 75, 100, 150 and 200 µM) and AA (0, 25, 50, 75, 100, 150, 200, 300 µM) were determined. The interference of various concentrations of AA (0, 25, 50, 75, 100, 150 and 200 µM) in the CV of 100 µM UA or various concentrations of UA (0, 25, 50, 75, 100, 150 and 200 µM) in the CV of 100 µM AA was also investigated. The oxidative or reductive current was calculated by subtracting the background current from the current at peak potential. Background current can be directly determined. However, the 14.
(26) background current of UA under the influence of AA at modified SPCE needs to be determined by curve fitting. The curve between peaks of UA and AA was fitted (single exponential decay, three parameters) by Sigma Plot software. The corresponding oxidative currents were calculated herein.. 15.
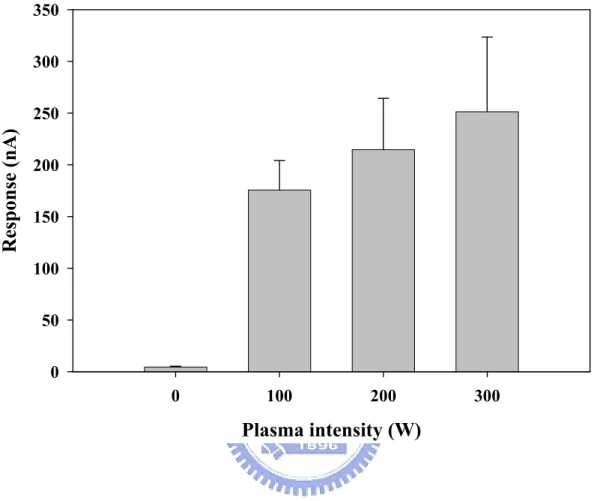
(27) Result and Discussion Surface treatment of SPCE by oxygen plasma Carbon paste electrode use graphite powder mixed with various organic binders. The organic binders are non-conducting, minimally volatile, immiscible with aqueous solutions, and exhibit a high chemical and electrochemical inertness. Therefore, the rate of electron transfer of SPCE may be blocked by pasting binder [71]. However, other organic oil and pollutants may also provide an interference to the electrochemical properties of SPCE.. Effect of plasma power Power is one of the parameters that determine the working efficiency of plasma. To find out the optimal condition to improve the electrochemical properties of SPCE three different powers of oxygen plasma (100 W, 200 W, 300 W) were used. The oxidative current of hydrogen peroxide, which is a common reactive species in oxidase-base electrochemical biosensors, on the SPCEs before and after plasma treatment was measured. As shown in figure 1, SPCEs treated with oxygen plasma exhibited 40~57-fold higher electrochemical responses to 1 mM H2O2 than that of untreated SPCE. The oxidative current of untreated SPCE to 1 mM H2O2 is 4.4 nA; whereas it is about 176, 215 and 251 nA/1mM H2O2 for the SPCEs treated with 100 W, 200 W and 300 W oxygen plasma, respectively. This result indicates that oxygen plasma is useful in improving the electro-catalytic property of SPCE. Next, the reproducibility of plasma-treated SPCE was studied by 16.
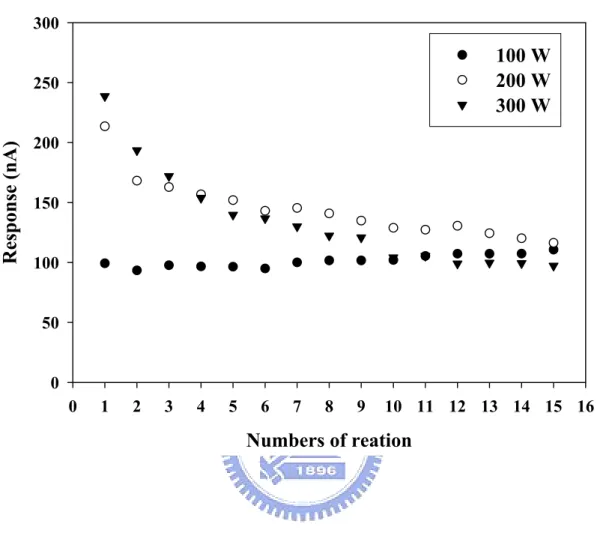
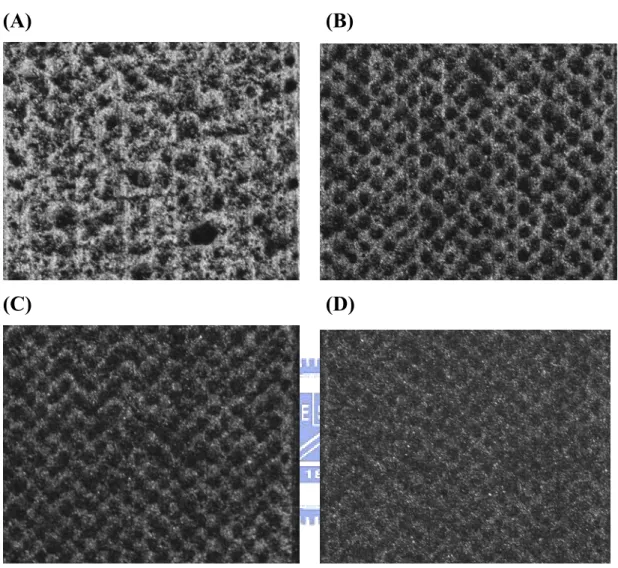
(28) repetitively determining the electrochemical response of SPCE to 1 mM H2O2 (Fig. 2). The reproducibility test shows that SPCE treated with 100 W oxygen plasma exhibits a stable reactivity toward 1mM H2O2 over 15 tests compared with those treated with 200 W and 300 W plasmas. Though SPCEs treated with 200 W and 300 W plasma exhibited higher electrochemical responses than that treated with 100 W plasma initially, the oxidative current rapidly decrease to the level similar to that of SPCE treated with 100 W plasma (Fig. 2). Under the light microscope, we found that the surface of electrode became flattened with plasma treatment (Fig. 3). This effect increases with increasing the power for oxygen plasma. One possibility is that graphite particles may come off the surface due to the decomposition of pasting binder by plasma. Although plasma has been shown to make defect on the graphite surface [72, 73], it is hard to decompose the bulk graphite particle entirely [74]. Pasting binder is usually an organic oil to stick carbon particles together. The bond strength of C-C and C-H in the organic oil was weaker than the C=C bond in the graphite. Therefore, pasting binder may be decomposed prior to graphite particles under the condition used in this study. Graphite particles may come off due to the over-etching of pasting binder by plasma of high power, e.g., 200~300 W. This postulation was verified by the observation that the free graphite particles came off the surface of electrodes modified with 200 W and 300 W plasma during the experiment. These results indicate that plasma treatment can improve the electro-catalytic activity of SPCE to H2O2. Effect of plasma treating time 17.
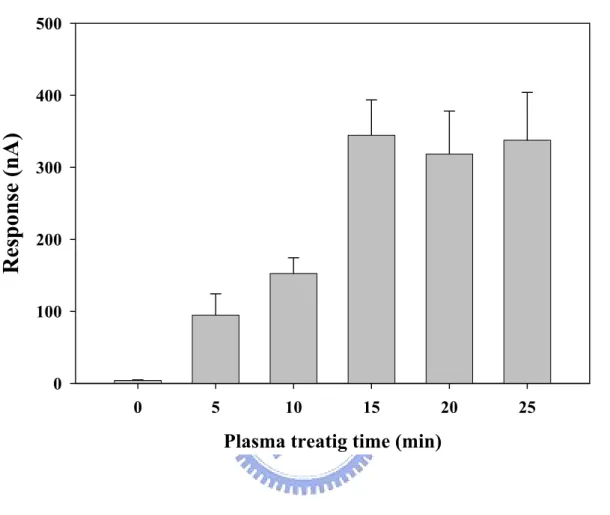
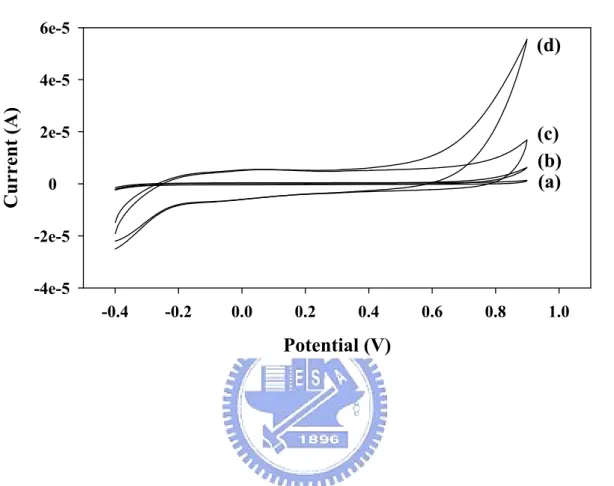
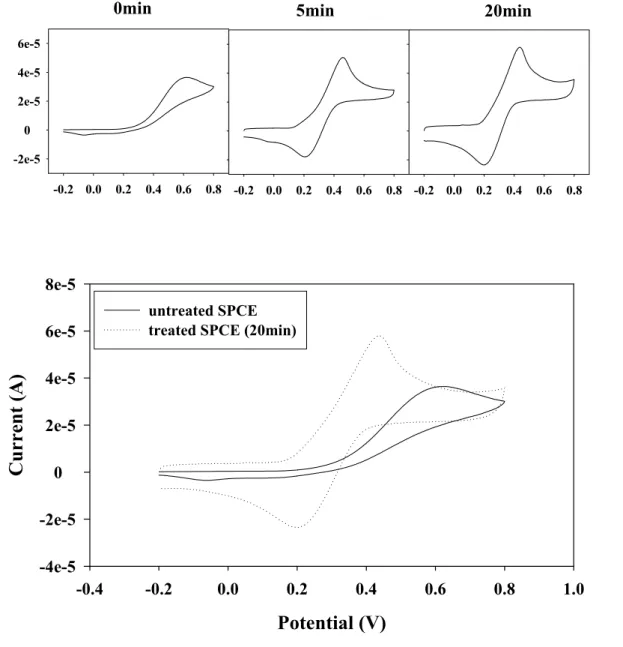
(29) Previous data have shown that 100 W oxygen plasma is suitable to modify SPCE. Next, we want to know the effect of treating time of plasma on the electrochemical responses of SPCE. We found that the electrochemical response of SPCE to 1 mM H2O2 changed from 4.1 nA to 95, 153, 344, 318 and 338 nA following the treatment of 100 W oxygen plasma under 400 mTorr for 5 min, 10 min, 15 min, 20 min and 25 min, respectively. It appears that the electrochemical response of SPCE to H2O2 increased with the length of the time of plasma treatment (Fig. 4). The electrochemical response of SPCE reached maximum after plasma treatment for 15 min. The microscopic images reveal that various sizes of aggregates appear on the surface of untreated SPCE (Fig. 5). As the treating time of plasma increased, the hillock-like aggregates became uniform and regular in size. A low level destruction on the surface of SPCE was also observed after 25 min treatment with 100 W plasma. This result was also observed on the surface of the SPCE treated with high power of plasma, e.g., 200 W or 300 W. Accordingly, an optimal condition for surface treatment of SPCE is proposed as 100 W oxygen plasma under 400 mTorr for 15~20 min.. CV of plasma-treated SPCE The CV of untreated and plasma-treated SPCEs was performed within the potential range of -0.4 V~0.9 V with a scanning rate of 100 mV/s in the presence or absence of 5 mM H2O2 (Fig. 6). The result shows that the plasma-treated SPCE exhibits a significant enhancement in the redox currents than that of untreated electrode. The plasma-treated SPCE also exhibits a high basal level of cyclic voltammogram. High 18.
(30) background current may be disadvantageous for biosensor because it may reduce the sensitivity of signals.. Cyclic Voltammograms of redox couples on the plasma-treated SPCE Cyclic voltammetry is the widely used technique for acquiring qualitative information about electrochemical reactions[76]. It can be used for the kinetic studies of electron transfer reaction. Electrochemical reactions bascially follow the Nernst equation as following: E = Eo + RT/nF*ln(O/R). Where R is the gas constant (8.31 J mole-1 K-1), T is the absolute temperature (K), F is the faraday constant (9.65*104 C mol-1), n is the number of electrons transferred during the reaction, E is the observed potential difference given in Volt, E0 is the standardized reodx potential (referring to the hydrogen electrode), O is the concentration of the reduced species, R is the concentration of the oxidized species. M+n +e-. M+(n-1) (Eq. 1). In an electrochemical reaction, a reactant (M+n) may be converted to product (M+(n-1)) under the applied voltage. During cyclic voltammetric scanning, when the applied voltage changes from V1 to V2, the equilibrium position of Eq. 1 shift from no conversion V1 to partially conversion V2 of the reactant (M+n) at the electrode surface. The current rises as the voltage is swept further from its initial value as the equilibrium position is shifted further to the right hand side of the Eq. 1, thus converting more reactant. The redox current reaches the peak, when the flux of reactant to the electrode is not fast enough to satisfy that required by the Nernst equation. If an electron transfer between the 19.
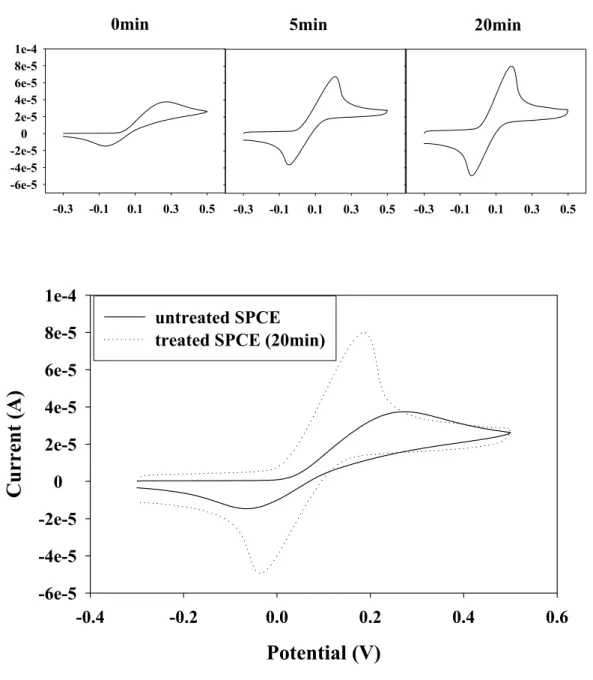
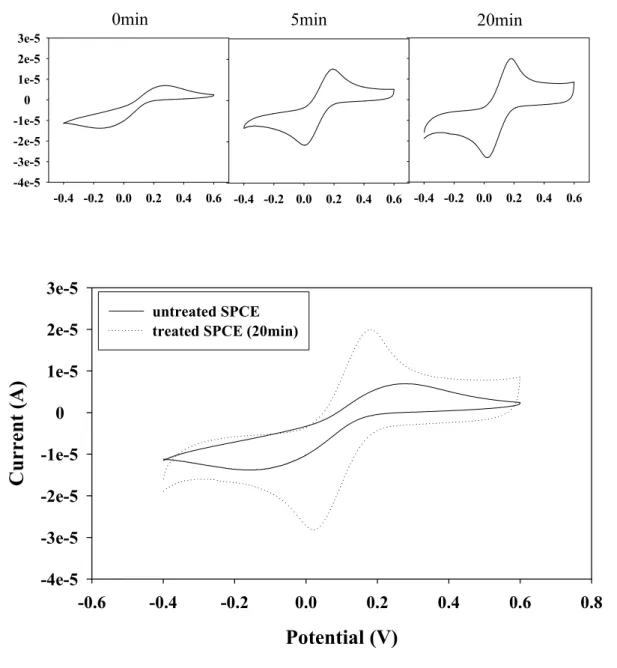
(31) electrode and redox compound is slow, the equilibrium will not be established rapidly. In cyclic voltammetry, when the rate of equilibrium of conversion is slower than scan rate, it will cause the voltage applied not result in the generation of the concentrations at the electrode surface predicted by the Nernst equation. Hence, the maximum equilibrium current will shift to the higher anodic/cathodic potential. This is called the quasi-reversible reaction. The irreversible reaction occurs when electron transfer of reduction or oxidation is blocked [76]. For a reversible reaction of a redox couple at electrode, the separation between Epa (oxidative peak potential) and Epc (reductive peak potential) is 57/n mV (n is the mole of electrons transferred per mole of electroactive species). The ratio of peak current (Ipa/Ipc) is equal to one. The separation of Epa and Epc and the ratio of peak current reflects the kinetics of electron transfer reaction at the electrode. Oxygen plasma was proved to be useful to improve the electro-catalytic activity of SPCE to H2O2. Other electrochemical property, such as rate of electron transfer at the treated SPCE was investigated. Three electrochemical active agents, including catechol, dopamine and ferricyanide were used in this study. Catechol and dopamine are important biological substances in human. Ferricyanide is a mediator, which is commonly used in the fabrication of biosensors. The CVs of these three substances on the untreated and plasma-treated electrodes were shown in Fig. 7. The oxidative peak potential (Epa), reductive peak potential (Epc), difference between Epa and Epc (∆Ep), peak of oxidative current (Ipa), peak of reductive current (Ipc) and the ratio of Ipa to Ipc (e.g., Ipa/Ipc) of this study were shown in Table 1. The ∆Ep of 20.
(32) dopamine, catechol and ferricyanide were 0.331 V, 0.665 V and 0.440 V in untreated SPCE, but 0.232 V, 0.233 V and 0.156 V in treated SPCE with 100 W plasma for 20 min. The ∆Ep was greatly reduced in modified SPCE compared to unmodified SPCE. The Ipa/Ipc of dopamine, catechol and ferricyanide were 1.768, 23.517 and 0.478, respectively, in untreated SPCE, but they were 1.20, 1.196 and 0.957 in plasma-treated SPCE (after treatment of 100 W plasma for 20 min). The Ipa/Ipc ratio tends to be 1 in SPCEs after plasma treatment. These results indicate that electron transfer between the electrode and redox couple at the surface is enhanced after plasma treatment. The treatment of 100 W oxygen plasma of SPCE for only 5 min causes dramatic effect in the rate of electron transfer of SPCE.. Scanning Electron Micrograph of plasma-treated SPCE To further study local structural change of the surface of SPCE before and after plasma treatment scanning electron micrographs (SEM) was performed. The untreated SPCE, SPCE treated with 300 W oxygen plasma for 10 min, and SPCE treated with 100 W plasma for 5 or 15 min were monitored under the electron microscope with a magnification power of 500 X (Fig. 8). Two different types of micro-structures on SPCE, flat and hillock-like bumps surface (Fig. 3 and 5), were observed and studied. The electron micrographs of rough and flat surface under 7000 X magnification were displayed in Figures 9 and 10. A smooth and smeared-like surface structure was observed on the untreated SPCE (Fig. 9a, 10a). It may be due to the covering of the pasting binder on the surface. Upon the plasma treatment for 5 min, many small granular particles on the surface of SPCE were seen (Fig. 9b and 10b). It was 21.
(33) proposed that pasting binder undergoes decomposition by the treatment of plasma to form granular particles with the graphite. With increasing the treating time or power of plasma, the decomposition of pasting binder would reach to the chink between two contiguous graphite particles (Fig. 9c, 9d, 10c and 10d). It made the graphite particles exposed to the air without coverage of pasting binder. We know that pasting binder is essential for the fabrication of carbon paste electrode and forms a layer on the electrode surface. However the pasting binder was usually miner oil without conductivity, it forms a barrier for electron transfer between the graphite and redox couple. This may be partially explained the slow electron transfer kinetics in the untreated SPCE. Oxygen plasma treatment was shown to remove the pasting binder on the surface and eliminate the barrier for the electron transfer between the electrode and redox couple. Graphite crystal structure consists of two planes, basal- and edge-planes. The basal-plane is the plane parallel to the graphite layer, and the edge-plane is the plane perpendicular to graphite layer (Appendix 3). Edge-plane has a faster electron transfer kinetics than the basal-plane for a range of redox couple [41, 75]. With the coverage of pasting binder, the edge plane may be shielded. The removal of pasting binder by oxygen plasma may greatly expose the edge plane of graphite particles. Furthermore, the treatment of oxygen plasma may cause defect on the basal-plane of graphite particle [72, 73]. Therefore, the edge-plane of graphite particles may be greatly increased by not only the removal of pasting binder on the surface, but also the existence of defects on the basal-plane. 22.
(34) It was shown that plasma modification can facilitate the electron transfer kinetics between the SPCE and redox couple (Fig. 7). We proposed it may be due to the removal of pasting binder and increase of edge-plane. A model was proposed to explain the cleaning effect of oxygen plasma on the surface of SPCE (Fig. 11), by which the pasting binder on the surface of SPCE was decomposed or removed due to the oxygen plasma treatment.. Contact angle test of plasma-treated SPCE Contact angle is a measurement of the surface tensions of the liquid on a solid phase. Oxygen plasma has been shown previously to modify the surface of a solid with hydroxyl (-OH) and/or carbonyl (C=O) groups [77], which may change the hydrophilicity of the surface of the SPCE. Therefore, the contact angel of the water droplet on the surface of SPCE before and after the treatment of oxygen plasma was studied. As shown in Fig. 12, the contact angle of untreated SPCE was 94°. However, after oxygen plasma treatment for 5, 10, 15 and 20 min the contact angles reduced to 46º, 43º, 39º and 35º, respectively. This result suggests that the surface of SPCE becomes more hydrophilic after plasma modification, suggesting the removal of hydrophobic pasting binder or other pollutents. However, the possibility that hydroxyl, carbonyl or carboxyl groups are generated on the carbon surface after oxygen plasma treatment can not be ruled out. Hydrophilic surface of electrode is important for the immobilization of biological elements on the electrode. The adhesion of other hydrophilic materials, such as gelatin and silica sol-gel, on the SPCE can be benefited by a hydrophilic surface. Preliminary study has 23.
(35) shown that silica sol-gel could be easily coated on the plasma-treated SPCE, but not on the untreated SPCE.. Comparison. of. untreated. SPCE,. plasma-treated. SPCE. and. commercialized Pd electrode The commercial Pd-covered strip from Roche has been proved to catalyze the oxidation of hydrogen peroxide. Although the performance of palladium electrode is better than carbon paste electrode in electro-catalytic activity of hydrogen peroxide, the cost of palladium electrode is much higher. In previous study, we have shown that the electro-catalytic activity of SPCE to hydrogen peroxide was greatly enhanced by the treatment of oxygen plasma. Therefore, the anodic current to 1 mM H2O2 of untreated, 100 W oxygen plasma-treated electrodes and commercial Pd strip at different working potential (0.2, 0.3, 0.4, 0.5, 0.6, 0.7 and 0.8 V) was determined (Fig. 13). The commercial Pd strip has the ability to catalyze the oxidation of H2O2 at about 0.2 V. Compared with untreated SPCE, the over-potential that needs to drive the oxidation of H2O2 reduced from 0.7 V to 0.5 V. Although there is still a gap between the modified SPCE and commercial Pd electrode, it had reduced the gap substantially between the unmodified SPCE and Roche’s electrode.. Reproducibility of plasma-treated SPCE The effect of oxygen plasma on the reproducibility of electrode was studied by repetitively determine the response of SPCE to 300 µM H2O2. The average response of oxygen plasma-treated SPCE to 300 µM H2O2 is 24.
(36) 92 nA with a relative standard derivation of 6.9 % (Fig. 14). The average response of the first 10 reactions is 103 nA. The response reduced slightly after 35 measurements. The average response of the last 10 reactions is 89 nA. The signal lost from the first 10 reactions to last 10 reactions is about 14 %. This result indicates that the plasma-treated SPCE exhibits a good reproducibility for repetitive usage.. Stability of plasma-treated SPCE after long-term storage The stability of SPCE after long-term storage is important for the commercial purpose. The storage test was performed by randomly choosing two electrodes from a batch of plasma-treated SPCEs (100 W plasma for 15 min) after storage for 1, 7, 10, 15, 30, 45 and 99 days. The electrochemical response of these plasma-treated SPCEs to 1 mM H2O2 was determined in 1X PBS, pH 7.4 (Fig. 15). The plasma-treated electrode exhibits a good stability over 3 months. The response to 1 mM H2O2 is 239.7 nA with a relative standard derivation of 6.9 %. This result reveals that oxygen plasma exerts a long term effect on the SPCE.. Application of plasma-treated SPCE in the fabrication of glucose biosensor The application of plasma-treated SPCE in the fabrication of oxidase-base biosensors was investigated. The glucose biosensor was fabricated by entrapping the glucose oxidase (GOx) on the surface of treated SPCE (100 W plasma for 15 min) by polyvinal alcohol functionalized. with. pyridinium. methyl. sulfate. (PVA-SbQ),. a. photo-crosslinkable polymer. In the catalytic reaction of glucose oxidase, 25.
(37) glucose was converted into gluconic acid and H2O2 in the presence of oxygen. Thus, the step response of fabricated glucose biosensor to repetitively added 100 µM glucose was determined (Fig. 16). The result shows that the average response to 100 µM glucose is 1.27 nA for unmodified SPCE; whereas it is 17.31 nA for plasma-treated SPCE. The linear calibration range is between 50 µM to 1000 µM for unmodified SPCE, but it is 5 µM to 1000 µM for treated electrode (Fig. 17). The detection limit for plasma-treated SPCE is 10-fold lower than that of untreated SPCE. The lowest detection limit for glucose on the biosensor fabricated by plasma-treated SPCE was demonstrated in Fig. 18 with a signal-to-noise ratio > 3. This result demonstrates that the glucose biosensor fabricated by a plasma-treated SPCE exhibits a high sensitivity and low detection limit. Apparently, oxygen plasma exhibits a potential to improve the electrochemical properties of SPCE for the fabrication of oxidase-based potable biosensing system with high sensitivity.. Application of plasma-treated SPCE in the simultaneously detection of Uric acid and ascorbic acid Previous data have shown that plasma modification can facilitate the electron transfer between the SPCE and redox couple. It made the peak of CV sharper and clearer. It seems to be a general effect to other redox substances. Many analytic samples, such as blood, urine and waste water, contain a lot of compounds that contains more than one redox compound. When the transfer of electron between the redox substances and electrode is slow, the redox peaks of CV are broad and unclear. When such two 26.
(38) redox compounds present in the same solution, the CV of these two compounds will probably interfere with each other due to broad and unclear peaks. This will affect the accuracy of analysis. With the sharp and clear redox peaks of CV is important to separate the redox peaks of multiple redox couples in a complex solution. Several lines of evidence also demonstrate the necessary of separating the redox peaks of CV of redox couples in reducing the interference in the measurement of electrochemical biosensors [78-80]. Uric acid (UA) and ascorbic acid (AA) are present in biological fluids such as blood and urine. It is important to detect them selectively and conveniently. It can directly measure the response due to their electrochemical activity. However UA and AA can be oxidized at a very similarly potential, which results in rather poor selectivity. Here, the analysis of UA and AA was used as a model to demonstrate the potential of plasma treatment in the analysis of complex redox analytes. As presented in the Fig. 19a and 19b, the response of various concentrations of UA (25, 50, 75, 100, 150, 200 µM) and AA (25, 50, 75, 100, 150, 200, 300 µM) by cyclic voltammetry at unmodified SPCE. The oxidative peaks of UA and AA were broad and unclear with a relatively high over-potential of around 0.4 V. However, the cyclic voltammograms of UA and AA on plasma-modified SPCE demonstrate that the oxidative peaks for UA and AA were sharp and clear with a relatively low over-potential of around 0.3 V and 0.1 V, respectively (Fig. 19c and 19d). The responses of 100 µM UA or AA in the presence of various concentrations of AA (25, 50, 75, 100, 150, 200, 300 µM) or various concentrations of UA (25, 50, 75, 100, 150, 200 µM) on untreated and 27.
(39) plasma-treated SPCE were studied. As shown in Fig. 20a and 20b, the oxidative peaks of UA and AA could not be separated from that of AA and UA on the untreated SPCE. However, the CV for mixture of UA and AA showed two separate oxidative peaks (Fig. 20c and 20d). The calibration curves of UA (Fig. 21a) and AA (Fig. 21b) clearly showed a linear response within the concentrations tested. However, the entire calibration curve shifted to a higher level under the interference of AA and UA, respectively, on the unmodified SPCE. It means that the concentration of UA or AA determined in the presence of AA or UA, respectively, should be higher than that of without interference. Hence, the actual concentration of analyte can not be determined, especially with high concentration of interfere agents (Fig. 22). Interestingly, the plasma-treated SPCE has ability to reduce the interference of other redox couples in the same solution (Fig. 21c, 21d and Fig. 22). Therefore, the concentration of analyte in a complex solution can be accurately determined with plasma-treated SPCE. The model of sensing UA and AA was improved successfully at modified SPCE. It has great potential for applying the plasma-modified SPCE to the fabrication of biosensors for multiple analytes.. 28.
(40) Reference 1.. E Bakker (2004): Electrochemical sensors. Analytical Chemistry 76:3285.. 2.. DR Theavenot, K Toth, RA Durst, GS Wilson (1999): Electrochemical biosensors: definitions and classification. International Union of Pure and Applied Chemistry 71:2333.. 3.. WO Ho, S Krause, CJ McNeil, JA Pritchard, RD Armstrong, D Athey, K Rawson (1999): Electrochemical sensor for measurement of urea and creatinine in serum based on ac impedance measurement of enzyme-catalyzed polymer transformation. Analytical Chemistry 71:1940.. 4.. M Shamsipur, F Jalali, S Ershad (2005): Preparation of a diclofenac potentiometric sensor and its application to pharmaceutical analysis and to drug recovery from biological fluids. Journal of Pharmaceutical and Biomedical Analysis 37:943.. 5.. MH Yang, YH Yang, YL Liu, GL Shen, RQ Yu (2006): Platinum nanoparticles-doped sol-gel/carbon nanotubes composite electrochemical sensors and biosensors. Biosensors & Bioelectronics 21:1125.. 6.. GD Liu, YH Lin (2005): Electrochemical sensor for organophosphate pesticides and nerve agents using zirconia nanoparticles as selective sorbents. Analytical Chemistry 77:5894.. 7.. SL Mu (2006): Catechol sensor using poly(aniline-co-o-aminophenol) as an electron transfer mediator. Biosensors & Bioelectronics 21:1237.. 8.. R Kizek, L Trnkova, S Sevcikova, J Smarda, F Jelen (2002): Silver electrode as a sensor for determination of zinc in cell cultivation medium. Analytical Biochemistry 301:8.. 9.. D Corbo, M Bertotti (2002): Use of a copper electrode in alkaline medium as an amperometric sensor for sulphite in a flow-through configuration. 29.
(41) Analytical and Bioanalytical Chemistry 374:416. 10.. S Lin, CC Liu, TC Chou (2004): Amperometric acetylcholine sensor catalyzed by nickel anode electrode. Biosensors & Bioelectronics 20:9.. 11.. S Serban, N El Murr (2004): Synergetic effect for NADH oxidation of ferrocene and zeolite in modified carbon paste electrodes - New approach for dehydrogenase based biosensors. Biosensors & Bioelectronics 20:161.. 12.. YT Kong, M Boopathi, YB Shim (2003): Direct electrochemistry of horseradish peroxidase bonded on a conducting polymer modified glassy carbon electrode. Biosensors & Bioelectronics 19:227.. 13.. JD Zhang, M Oyama (2004): A hydrogen peroxide sensor based on the peroxidase activity of hemoglobin immobilized on gold nanoparticles-modified ITO electrode. Electrochimica Acta 50:85.. 14.. NR Stradiotto, H Yamanaka, MVB Zanoni (2003): Electrochemical sensors: A powerful tool in analytical chemistry. Journal of the Brazilian Chemical Society 14:159.. 15.. RN Adams (1958): Carbon paste electrodes. Analytical Chemistry 28:1576.. 16.. RG Evans, CE Banks, RG Compton (2004): Amperometric detection of glucose using self-catalytic carbon paste electrodes. Analyst 129:428.. 17.. KR Rogers, JY Becker, J Cembrano (2000): Improved selective electrocatalytic oxidation of phenols by tyrosinase-based carbon paste electrode biosensor. Electrochimica Acta 45:4373.. 18.. JP Hart, A Crew, E Crouch, KC Honeychurch, RM Pemberton (2004): Some recent designs and developments of screen-printed carbon electrochemical sensors/biosensors for biomedical, environmental, and industrial analyses. Analytical Letters 37:789.. 30.
(42) 19.. F Palmisano, PG Zambonin (1993): Ascorbic-Acid Interferences in Hydrogen-Peroxide Detecting Biosensors Based on Electrochemically Immobilized Enzymes. Analytical Chemistry 65:2690.. 20.. JP Lowry, RD O'Neill (1992): Homogeneous mechanism of ascorbic acid interference in hydrogen peroxide detection at enzyme-modif ied electrodes. Analytical Chemistry 64:453.. 21.. JD Newman, SF White, IE Tothill, APF Turner (1995): Catalytic Materials, Membranes, and Fabrication Technologies Suitable for the Construction of Amperometric Biosensors. Analytical Chemistry 67:4594.. 22.. J Wang, J Liu, L Chen, F Lu (1994): Highly Selective Membrane-Free, Mediator-Free Glucose Biosensor. Analytical Chemistry 66:3600.. 23.. H Sakslund, J Wang, O Hammerich (1996): Analysis of the factors determining the sensitivity of a miniaturized glucose biosensor made by codeposition of palladium and glucose oxidase onto an 8 mu m carbon fiber. Journal of Electroanalytical Chemistry 402:149.. 24.. J Liu, F Lu, J Wang (1999): Metal-alloy-dispersed carbon-paste enzyme electrodes for amperometric biosensing of glucose. Electrochemistry Communications 1:341.. 25.. KS Chang, WL Hsu, HY Chen, CK Chang, CY Chen (2003): Determination of glutamate pyruvate transaminase activity in clinical specimens using a biosensor composed of immobilized L-glutamate oxidase in a photo-crosslinkable polymer membrane on a palladium-deposited screen-printed carbon electrode. Analytica Chimica Acta 481:199.. 26.. SB Hall, EA Khudaish, AL Hart (1998): Electrochemical oxidation of hydrogen peroxide at platinum electrodes. Part 1. An adsorption-controlled mechanism. Electrochimica Acta 43:579.. 27.. SB Hall, EA Khudaish, AL Hart (1998): Electrochemical oxidation of hydrogen peroxide at platinum electrodes. Part II: effect of potential. 31.
(43) Electrochimica Acta 43:2015. 28.. S Iijima (1991): Helical microtubules of grapfitic carbon. Nature 354:56.. 29.. A Merkoci (2006): Carbon nanotubes in analytical sciences. Microchimica Acta 152:157.. 30.. JM Nugent, KSV Santhanam, A Rubio, PM Ajayan (2001): Fast electron transfer kinetics on multiwalled carbon nnotube microbundle electrodes. Nano Letters 1:87.. 31.. PJ Britto, KSV Santhanam, PM Ajayan (1996): Carbon nanotube electrode for oxidation of dopamine. Bioelectrochemistry and Bioenergetics 41:121.. 32.. F Patolsky, Y Weizmann, I Willner (2004): Long-range electrical contacting of redox enzymes by SWCNT connectors. Angewandte Chemie-International Edition 43:2113.. 33.. J Wang, M Musameh (2003): Carbon nanotube/teflon composite electrochemical sensors and biosensors. Analytical Chemistry 75:2075.. 34.. Z Xu, X Chen, XH Qu, SJ Dong (2004): Electrocatalytic oxidation of catechol at multi-walled carbon nanotubes modified electrode. Electroanalysis 16:684.. 35.. KP Gong, MN Zhang, YM Yan, L Su, LQ Mao, ZX Xiong, Y Chen (2004): Sol-gel-derived ceramic-carbon nanotube nanocomposite electrodes: Tunable electrode dimension and potential electrochemical applications. Analytical Chemistry 76:6500.. 36.. MD Rubianes, GA Rivas (2003): Carbon nanotubes paste electrode. Electrochemistry Communications 5:689.. 37.. HM Zhang, XB Wang, LJ Wan, YQ Liu, CL Bai (2004): Electrochemical behavior of multi-wall carbon nanotubes and electrocatalysis of toluene-filled nanotube film on gold electrode. Electrochimica Acta 49:715. 32.
(44) 38.. FH Wu, GC Zhao, XW Wei (2002): Electrocatalytic oxidation of nitric oxide at multi-walled carbon nanotubes modified electrode. Electrochemistry Communications 4:690.. 39.. RR Moore, CE Banks, RG Compton (2004): Basal plane pyrolytic graphite modified electrodes: Comparison of carbon nanotubes and graphite powder as electrocatalysts. Analytical Chemistry 76:2677.. 40.. CE Banks, RR Moore, TJ Davies, RG Compton (2004): Investigation of modified basal plane pyrolytic graphite electrodes: definitive evidence for the electrocatalytic properties of the ends of carbon nanotubes. Chemical Communications:1804.. 41.. CE Banks, TJ Davies, GG Wildgoose, RG Compton (2005): Electrocatalysis at graphite and carbon nanotube modified electrodes: edge-plane sites and tube ends are the reactive sites. Chemical Communications:829.. 42.. J Li, SN Tan, HL Ge (1996): Silica sol-gel immobilized amperometric biosensor for hydrogen peroxide. Analytica Chimica Acta 335:137.. 43.. D Moscone, D D'Ottavi, D Compagnone, G Palleschi, A Amine (2001): Construction and analytical characterization of Prussian Blue-based carbon paste electrodes and their assembly as oxidase enzyme sensors. Analytical Chemistry 73:2529.. 44.. M Arvand, S Sohrabnezhad, MF Mousavi, M Shamsipur, MA Zanjanchi (2003): Electrochemical study of methylene blue incorporated into mordenite type zeolite and its application for amperometric determination of ascorbic acid in real samples. Analytica Chimica Acta 491:193.. 45.. M Shamsipur, A Salimi, SM Golabi, H Sharghi, MF Mousayi (2001): Electrochemical properties of modified carbon paste electrodes containing some amino derivatives of 9,10-anthraquinone. Journal of Solid State Electrochemistry 5:68.. 46.. SA Wring, JP Hart (1992): Chemically modified, carbon-based electrodes and 33.
(45) their application as electrochemical sensors for the analysis of biologically important compounds. A review. Aanlyst 117:1215. 47.. K Itaya, T Ataka, S Toshima (1982): Spectroelectrochemistry and electrochemical preparation method of prussian blue modified electrodes. Journal of American Chemical Society 104:4767.. 48.. F Ricci, G Palleschi (2005): Sensor and biosensor preparation, optimisation and applications of Prussian Blue modified electrodes. Biosensors & Bioelectronics 21:389.. 49.. CJ Yuan, CL Hsu, SC Wang, KS Chang (2005): Eliminating the interference of ascorbic acid and uric acid to the amperometric glucose biosensor by cation exchangers membrane and size exclusion membrane. Electroanalysis 24:2239.. 50.. R Vaidya, P Atanasov, E Wilkins (1995): Effect of interference on the performance of glucose enzyme electrodes using Nafion coatings. Medical Engineering & Physics 17:416.. 51.. J Wang, H Wu (1995): Highly Selective Biosensing of Glucose Utilizing a Glucose-Oxidase Plus Rhodium Plus Nafion(R) Biocatalytic Electrocatalytic Permselective Surface Microstructure. Journal of Electroanalytical Chemistry 395:287.. 52.. J Wang, PVA Pamidi, G Cepria, S Basak, K Rajeshwar (1997): Overoxidized poly{pyrrole-co-[3-(pyrrol-1-yl)propanesulfonate]}-coated platinum electrodes for selective detection of catecholamine neurotransmitters. Analyst 122:981.. 53.. H Zhao, YZ Zhang, ZB Yuan (2001): Electrochemical determination of dopamine using a poly(2-picolinic acid) modified glassy carbon electrode. Analyst 126:358.. 54.. J Wang, M Pedrero, H Sakslund, O Hammerich, J Pingarron (1996): Electrochemical activation of screen-printed carbon strips. Analyst 121:345.. 34.
(46) 55.. G Cui, JH Yoo, JS Lee, J Yoo, JH Uhm, GS Cha, H Nam (2001): Effect of pre-treatment on the surface and electrochemical properties of screen-printed carbon paste electrodes. Analyst 126:1399.. 56.. YJ Kim, IK Kang, MW Huh, SC Yoon (2000): Surface characterization and in vitro blood compatibility of poly(ethylene terephthalate) immobilized with insulin and/or heparin using plasma glow discharge. Biomaterials 21:121.. 57.. DA Puleo, RA Kissling, MS Sheu (2002): A technique to immobilize bioactive proteins, including bone morphogenetic protein-4 (BMP-4), on titanium alloy. Biomaterials 23:2079.. 58.. P Hamerli, T Weigel, T Groth, D Paul (2003): Surface properties of and cell adhesion onto allylamine-plasma-coated polyethylenterephtalat membranes. Biomaterials 24:3989.. 59.. M Chen, PO Zamora, P Som, LA Pena, S Osaki (2003): Cell attachment and biocompatibility of polytetrafluoroethylene (PTFE) treated with glow-discharge plasma of mixed ammonia and oxygen. Journal of Biomaterials Science-Polymer Edition 14:917.. 60.. SW Rhee, AM Taylor, CH Tu, DH Cribbs, CW Cotman, NL Jeon (2005): Patterned cell culture inside microfluidic devices. Lab on a Chip 5:102.. 61.. MB Claase, MB de Riekerink, JD de Bruijn, DW Grijpma, GHM Engbers, J Feijen (2003): Enhanced bone marrow stromal cell adhesion and growth on segmented poly(ether ester)s based on poly(ethylene oxide) and poly(butylene terephthalate). Biomacromolecules 4:57.. 62.. M Castano-Alvarez, MT Fernandez-Abedul, A Costa-Garcia (2004): Gold electrodes for detection of enzyme assays with 3-indoxylphosphate as substrate. Electroanalysis 16:1487.. 63.. YC Kim, S Banerji, JF Masson, W Peng, KS Booksh (2005): Fiber-optic surface plasmon resonance for vapor phase analyses. Analyst 130:838.. 35.
(47) 64.. H Muguruma, Y Kase, H Uehara (2005): Nanothin ferrocene film plasma polymerized over physisorbed glucose oxidase: High-throughput fabrication of bioelectronic devices without chemical modifications. Analytical Chemistry 77:6557.. 65.. H Muguruma, A Hiratsuka, I Karube (2000): Thin-film glucose biosensor based on plasma-polymerized film: Simple design for mass production. Analytical Chemistry 72:2671.. 66.. A Hiratsuka, H Muguruma, S Sasaki, K Ikebukuro, I Karube (1999): A glucose sensor with a plasma-polymerized thin film fabricated by dry processes. Electroanalysis 11:1098.. 67.. WT Liao, WJ Lee, CY Chen, LT Hsieh, CC Lai (2000): Decomposition of ethoxyethane in the cold plasma environment. Journal of Chemical Technology and Biotechnology 75:817.. 68.. T Suzuki, P Tanner, DV Thiel (2002): O-2 plasma treated polyimide-based humidity sensors. Analyst 127:1342.. 69.. H Craighead, SW Turner, RC Davis, C James, AM Perez, PMS John, MS Isaacson, L Kam, W Shain, JN Turner, G Banker (1998): Chemical and topographical surface modification for control of central nervous system cell adhesion. Biomedical Microdevice 1:49.. 70.. J L.I., X WEI, T PENG (2005): Fabrication of Herbicide Biosensors Based on the Inhibition of Enzyme Activity That Catalyzes the Scavenging of Hydrogen Peroxide in a Thylakoid Membrane. Analytical Science 21:1217.. 71.. ME R., Z Galus, RN Adams (1983): Graphite paste electrodes effects of paste composition and surface states on electron-transfer rates Journal of Electroanalytical Chemistry 143:89.. 72.. E Bourelle, H Konno, M Inagaki (1999): Structural defects created on natural graphite surface by slight treatment of oxygen plasma: – STM observations –. Carbon 37:2041. 36.
(48) 73.. JI Paredes, A Martínez-Alonso, JMD Tascón (2000): Comparative study of the air and oxygen plasma oxidation of highly oriented pyrolytic graphite: a scanning tunneling and atomic force microscopy investigation Carbon 38:1183.. 74.. d Torre, LE Cascarinia, EJ Bottani, A Martínez-Alonso, A Cuesta, AB García, JMD Tascón (1998): Effects of oxygen plasma treatment on the surface of graphitized carbon black 1998 36:277.. 75.. B C.E., C R.G. (2005): Edge Plane Pyrolytic Graphite Electrodes in Electroanalysis: An Overview. Analytical Science 21:1263.. 76.. http://www.cheng.cam.ac.uk/research/groups/electrochem/teaching.html.. 77.. T Takada, M Nakahara, H Kumagai, Y Sanada (1996): Surface modification and characterization of carbon black with oxygen plasma Carbon 34:1087.. 78.. W Ren, HQ Luo, NB Li (2006): Simultaneous voltammetric measurement of ascorbic acid, epinephrine and uric acid at a glassy carbon electrode modified with caffeic acid. Biosensors & Bioelectronics 21:1086.. 79.. L Zhang, XQ Lin (2001): Covalent modification of glassy carbon electrode with glutamic acid for simultaneous determination of uric acid and ascorbic acid. Analyst 126:367.. 80.. LP Lu, XQ Lin (2004): Glassy carbon electrode modified with gold nanoparticles and DNA for the simultaneous determination of uric acid and norepinephrine under coexistence of ascorbic acid. Analytical Sciences 20:527.. 37.
(49) Table 1 data of Ipa, Ipc, Epa, Epc, ∆Ep and Ipa/Ipc from CV of dopamine, catechol and ferricyanide at plasma-treated SPCE plasma Ipa (uA). Ipc (uA). Epa (V). Epc (V). ∆Ep (V). Ipa/Ipc. dopamine. 0 min 5 min 10 min 15 min 20 min. 38.54 63.77 66.42 68.61 71.71. (3.7%)a (0.4%) (1.9%) (2.9%) (3.0%). 22.05 (12.7%) 52.68 (1.2%) 55.19 (2.3%) 57.39 (3.5%) 59.74 (2.6%). 0.27 0.20 0.20 0.19 0.19. (4.0%) (5.4%) (2.1%) (7.8%) (3.6%). -0.06 (28.6%) -0.05 (6.4%) -0.05 (17.6%) -0.05 (8.3%) -0.05 (19.1%). 0.33 (2.4%) 0.25 (4.5%) 0.25 (5.3%) 0.24 (8.2%) 0.23 (3.7%). 1.77 (10.6%) 1.21 (1.0%) 1.20 (1.3%) 1.20 (1.2%) 1.20 (1.5%). catechol. 0 min 5 min 10 min 15 min 20 min. 40.41 47.62 49.21 51.51 51.37. (9.6%) (2.1%) (0.6%) (1.7%) (3.6%). 2.93 (79.6%) 38.05 (0.7%) 40.00 (1.0%) 40.41 (1.2%) 42.97 (3.3%). 0.62 0.45 0.43 0.42 0.42. (5.9%) (1.6%) (1.3%) (2.4%) (3.2%). -0.05 (104.3%) 0.19 (6.3%) 0.17 (2.2%) 0.19 (2.8%) 0.19 (4.9%). 0.67 (3.5%) 0.26 (3.6%) 0.26 (4.2%) 0.24 (7.5%) 0.23 (7.9%). 23.52 (67.0%) 1.25 (2.9%) 1.23 (1.2%) 1.27 (1.3%) 1.20 (2.8%). 0 min 6.35 (4.7%) 13.27 (4.4%) 0.27 (7.4%) -0.17 (8.4%) 5 min 17.28 (2.2%) 20.10 (1.6%) 0.19 (0.5%) 0.00 (14.1%) 10 min 19.82 (2.6%) 21.63 (1.4%) 0.19 (0.4%) 0.01 (55.0%) 15 min 22.02 (1.5%) 22.97 (0.6%) 0.18 (3.8%) 0.02 (16.8%) 20 min 22.70 (4.0%) 23.73 (2.3%) 0.18 (1.6%) 0.03 (27.4%) a Relative standard deviation: the standard deviation divided by the mean of the series.. 0.44 (1.6%) 0.19 (0.5%) 0.18 (4.0%) 0.16 (7.7%) 0.16 (7.6%). ferricyanide. 38. 0.48 0.86 0.92 0.96 0.96. (1.3%) (0.9%) (1.5%) (2.0%) (2.2%).
(50) 350 300. Response (nA). 250 200 150 100 50 0 0. 100. 200. 300. Plasma intensity (W). Figure 1. Amperometric response of 1 mM H2O2 for SPCE treated with oxygen plasma with different power The SPCE oxygen plasma was set for 10 min, 400 mTorr. The electrode was treated with 1 mM H2O2 in PBS at 0.5 V versus Ag/AgCl.. 39.
(51) 300. 100 W 200 W 300 W. Response (nA). 250 200 150 100 50 0 0. 1. 2. 3. 4. 5. 6. 7. 8. 9. 10 11 12 13 14 15 16. Numbers of reation. Figure 2. Stability of SPCE treated with oxygen plasma at different power SPCE was treated with 100 W (●), 200 W (○) or 300 W (▼) oxygen. plasma. for. 10. min. and. 400. mTorr.. The. electrochemical response of plasma-treated electrode to 1 mM H2O2 was determined in PBS, pH 7.4. The working potential was 0.5 V versus Ag/AgCl. Fifteen reactions were recorded.. 40.
(52) (A). (B). (C). (D). Figure 3. Light micrographs of the surface of SPCE after treating with plasma of different power SPCEs were untreated (A) or treated oxygen plasma with (B) 100 W, (C) 200 W (D) and 300 W oxygen plasma for 10 min under 400 mTorr. The magnification power was 50-X.. 41.
(53) 500. Response (nA). 400. 300. 200. 100. 0 0. 5. 10. 15. 20. 25. Plasma treatig time (min). Figure 4. Amperometric response of SPCE treated with oxygen plasma for different treating times to 1 mM H2O2 The oxygen plasma was set for 100 W, 400 mTorr. The electrochemical response to 1 mM H2O2 of modified electrodes was done in PBS, pH 7.4 at room temperature. The working potential was set 0.5 V versus Ag/AgCl.. 42.
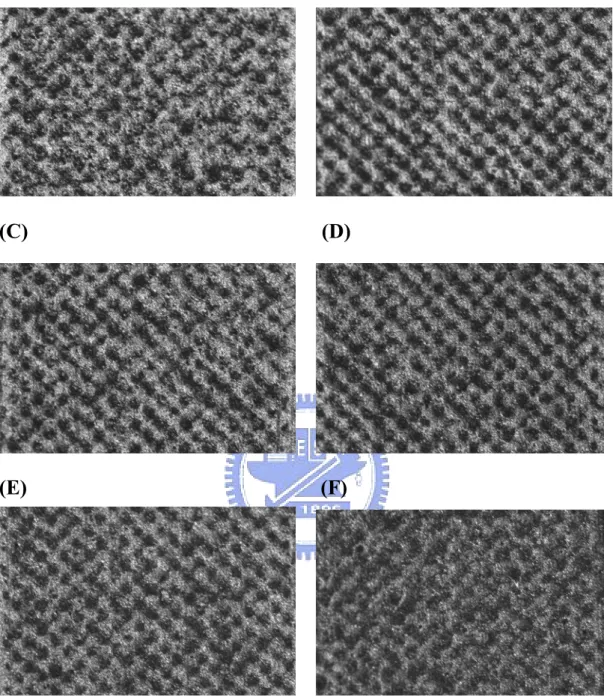
(54) (A). (B). (C). (D). (E). (F). Figure 5. Light micrograph of the surface of SPCE treated with oxygen plasma SPCE was untreated (A) or treated with 100 W oxygen plasma under 400 mTorr for (B) 5 min, (C) 10 min, (D) 15 min, (E) 20 min and (F) 25 min. The magnification power was 50-X.. 43.
(55) 6e-5. (d). Current (A). 4e-5. (c) (b) (a). 2e-5 0 -2e-5 -4e-5 -0.4. -0.2. 0.0. 0.2. 0.4. 0.6. 0.8. 1.0. Potential (V). Figure 6. CV of untreated and treated SPCE The electrochemical response of SPCE untreated (a,b) and treated with 100 W oxygen plasma (c,d) for 15 min to 0 mM (a,c) and 5 mM H2O2 (b,d) was performed. CV was set for -0.4 V~0.9 V versus Ag/AgCl with a scanning rate of 50 mV/s. Electrolyte used was 1X PBS, pH 7.4.. 44.
(56) (A) dopamine 0min. 5min. 20min. 1e-4 8e-5 6e-5 4e-5 2e-5 0 -2e-5 -4e-5 -6e-5 -0.3. -0.1. 0.1. 0.3. 0.5. -0.3. -0.1. 0.1. 0.3. 0.5. -0.3. -0.1. 0.1. 0.3. 0.5. 1e-4 untreated SPCE treated SPCE (20min). 8e-5. Current (A). 6e-5 4e-5 2e-5 0 -2e-5 -4e-5 -6e-5 -0.4. -0.2. 0.0. 0.2. 0.4. 0.6. Potential (V). Figure 7. CV of (A) dopamine, (B) catechol and (C) ferricyanide at SPCE treated with oxygen plasma SPCE was treated with 100 W oxygen plasma at 400 mTorr. CV was set for -0.2 V~0.8 V in 1 mM dopamine in a PBS, pH 7.4 versus Ag/AgCl, 100 mV/s.. 45.
(57) (B) catechol 0min. 5min. 20min. 6e-5 4e-5 2e-5 0 -2e-5 -0.2 0.0. 0.2. 0.4. 0.6. 0.8 -0.2 0.0. 0.2. 0.4. 0.6. 0.8 -0.2 0.0. 0.2. 0.4. 0.6. 0.8. 8e-5 untreated SPCE treated SPCE (20min). Current (A). 6e-5 4e-5 2e-5 0 -2e-5 -4e-5 -0.4. -0.2. 0.0. 0.2. 0.4. 0.6. 0.8. 1.0. Potential (V). Figure 7. CV of (A) dopamine, (B) catechol and (C) ferricyanide at SPCE treated with oxygen plasma SPCE was treated with 100 W oxygen plasma at 400 mTorr. CV was set for -0.2 V~0.8 V in 1 mM catechol in a PBS, pH 7.4 versus Ag/AgCl, 100 mV/s.. 46.
(58) (C) ferricyanide 0min. 5min. 20min. 3e-5 2e-5 1e-5 0 -1e-5 -2e-5 -3e-5 -4e-5 -0.4 -0.2 0.0. 0.2. 0.4. 0.6 -0.4 -0.2 0.0. 0.2. 0.4. 0.6 -0.4 -0.2 0.0. 0.2. 0.4. 0.6. 3e-5 untreated SPCE treated SPCE (20min). Current (A). 2e-5 1e-5 0 -1e-5 -2e-5 -3e-5 -4e-5 -0.6. -0.4. -0.2. 0.0. 0.2. 0.4. 0.6. 0.8. Potential (V). Figure 7. CV of (A) dopamine, (B) catechol and (C) ferricyanide at SPCE treated with oxygen plasma SPCE was treated with 100 W oxygen plasma at 400 mTorr. CV was set for -0.2 V~0.8 V in 1 mM ferricyanide in a PBS, pH 7.4 versus Ag/AgCl, 100 mV/s.. 47.
(59) (A) Untreated SPCE. (B) Treated SPCE: 100 W 5 min. (C) Treated SPCE: 100 W 15 min (D) Treated SPCE: 300 W 10 min. Figure 8. Scanning Electron Micrograph of the surface of SPCE treated with oxygen plasma SPCE was untreated (A), treated with 100 W oxygen plasma for (B) 5 min, (C) 15 min, or treated with 300 W oxygen plasma for (D) 10 min under 400 mTorr. Magnification power: 500X. 48.
(60) (A) Untreated SPCE. (B) Treated SPCE: 100 W 5 min. (C) Treated SPCE: 100W 15min (D) Treated SPCE: 300W 10min. Figure 9. Scanning Electron Micrograph of the bump of SPCE treated with oxygen plasma SPCE was untreated (A), treated with 100 W oxygen plasma for (B) 5 min, (C) 15 min, or treated with 300 W oxygen plasma for (D) 10 min under 400 mTorr. Magnification power: 7000X. 49.
(61) (A) Untreated SPCE. (B) Treated SPCE: 100W 5min. (C) Treated SPCE: 100W 15min (D) Treated SPCE: 300W 10min. Figure 10. Scanning Electron Micrograph of the flat of SPCE treated with oxygen plasma SPCE was untreated (A), treated with 100 W oxygen plasma for (B) 5 min, (C) 15 min, or treated with 300 W oxygen plasma for (D) 10 min under 400 mTorr. Magnification power: 7000X. 50.
(62) Figure 11. The mechanism proposed for improvement of electrochemical properties of SPCE by oxygen plasma. 51.
(63) (A) 0min. (B) 5min. (C) 10min. (D) 15min. (E) 20min. 120. Contact angle. 100 80 60 40 20 0 0. 5. 10. 15. 20. Plasma treating time (min). Figure 12. Contact angle test of plasma-treated SPCE The oxygen plasma was set for 100 W, 400 mTorr.. 52. 25.
(64) 40000 CPE CV-15 cycle plasma treatment Roche's Pd Pd electrodeposition. Response (nA). 30000. 20000. 10000. 0 0.2. 0.4. 0.6. 0.8. 1.0. Potential (V). Figure 13. Amperometric response of SPCEs with different treatments to 1 mM H2O2 at different applied voltages SPCE (CV-15 cycles) was treated with CV for 15 cycles, 0~2 V, 100 mV/s. SPCE (plasma treatment) was treated with 100 W oxygen plasma at 400 mTorr for 15 min. Roche’s Pd electrode. was. electro-deposition). commercial was. product.. electroplated. by. SPCE. (Pd. PdCl2.. The. electrochemical responses of SPCE with different treatments to 1 mM H2O2 at different working potential (0.2, 0.3, 0.4, 0.5, 0.6, 0.7, 0.8 and 0.9 V) were measured. The reactions were performed in PBS, pH 7.4 at different voltage versus Ag/AgCl.. 53.
(65) 140. Response (nA). 120 100 80 60 40 20 0 0. 10. 20. 30. 40. 50. 60. 70. 80. Numbers of reaction. Figure 14. Reproducibility of SPCE treated with 100 W oxygen plasma for 15 min SPCE was treated with 100 W oxygen plasma at 400 mTorr for 15 min. The electrochemical response of treated SPCE to 300 uM H2O2 was determined in PBS, pH 7.4. The working potential was 0.5 V versus Ag/AgCl. Seventy five reactions were recorded.. 54.
(66) 300. Response (nA). 250 200 150 100 50 0 0. 20. 40. 60. 80. 100. Time (day). Figure 15. Stability of SPCE treated with 100 W oxygen plasma for 15 min after long term storage SPCEs were treated with 100 W oxygen plasma at 400 mTorr for 15 min. Treated electrodes were stored at 4ºC 1~99 days. After storage, the electrode was subjected to electrochemical reaction in the presence of 1 mM H2O2 in PBS, pH 7.4 at 0.5 V versus Ag/AgCl.. 55.
數據
+7
相關文件
解答 根據圖 1.14 可知氮的陰電性(EN = 3.0)大於碳的 陰電性(EN = 2.5),故胺被極化成碳為 δ+ ,而 氮為 δ- 。.
Depending on the specified transfer protocol and data format, this action may return the InstanceID of an AVTransport service that the Control Point can use to control the flow of
In this paper, we have shown that how to construct complementarity functions for the circular cone complementarity problem, and have proposed four classes of merit func- tions for
- we can put photoresist on a wafer and then selectively expose regions to UV - then we can soak the entire thing in acid and only the parts of the photoresist that.. were exposed to
Kawa mure, “Residual Capacity Esti mation of Sealed Lead Acid Batteries for Electric Vehicles,” Power Conversion Conference, pp.. Lynch
“Big data is high-volume, high-velocity and high-variety information assets that demand cost-effective, innovative forms of information processing for enhanced?. insight and
Microphone and 600 ohm line conduits shall be mechanically and electrically connected to receptacle boxes and electrically grounded to the audio system ground point.. Lines in
等溫電漿應用於電弧熔鍊(Arc Refinement)、電漿融射(Plasma Spraying)及感應偶合電漿分光儀(Inductively Coupled Plasma Optical
