國立交通大學
經營管理研究所
碩士論文
台灣證券商分項投入效率之研究:
隨機邊界分析之應用
Disaggregate Input Efficiency of Securities Firms
in Taiwan:
An Application of the SFA Approach
研 究 生:張絡捷
指導教授:胡均立教授
台灣證券商分項投入效率之研究:隨機邊界分析之應用
Disaggregate Input Efficiency of Securities Firms in Taiwan:An
Application of the SFA Approach
研 究 生:張絡捷 Student : Lo Chieh Chang
指導教授:胡均立 Advisor:Jin Li Hu
國立交通大學 經營管理研究所
碩 士 論 文
A Thesis
Submitted to Institute of Business and Management College of Management
National Chiao Tung University in Partial Fulfillment of the Requirements
for the Degree of Master in Business and Management
June 2013
Taipei, Taiwan, Republic of China
i
台灣證券商分項投入效率之研究:隨機邊界分析之應用
研究生:張絡捷 指導教授:胡均立 國立交通大學經營管理研究所碩士 中文摘要 本文利用隨機邊界分析法(SFA)來計算出台灣證券公司的效率表現,資料期間為 2005 年至 2011 年,共七年,總共收集 57 間證券公司資料。研究方法我們使用一階段的 隨機邊界分析法來估計環境變數對個別投入要素之效率值的影響。本研究的產出變數為 證券公司之經紀收入、承銷收入和自營收入的總合,投入變數包含股東權益、營業費用、 員工人數和總固定資產。本研究結果顯示,股東權益和總固定資產的平均使用效率較差, 因此即需改善。而在證券公司的特性當中,上市上櫃的證券公司相較於未公開發行的證 券公司而言,其在股東權益和勞動的使用效率較差,然而在總固定資產的使用效率較好。 金控證券商相較於非金控證券商而言,其在股東權益和勞動的使用上也是效率較差,但 在總固定資產的使用效率較好。而資本適足率對股東權益的使用效率有正面的影響,但 對勞動和總固定資產的使用效率則是產生負面的影響。公司年限對於股東權益的使用效 率上有負面的影響。 關鍵字:隨機邊界分析法、個別投入要素、效率值ii
Disaggregate Input Efficiency of Securities Firms in Taiwan:
An Application of the SFA Approach
Student: Lo-Chieh Chang Advisor: Dr. Jin-Li Hu Institute of Business and Management
National Chiao Tung University
ABSTRACT
In this paper, we apply the stochastic frontier analysis (SFA) to compute the efficiency of securities firms in Taiwan. The panel data set contains a total of 57 securities firms during 2005-2011. A one-stage stochastic frontier analysis is used to estimate the influences of environmental variables on the disaggregate inputs used by securities firms in Taiwan. The output variable in this research is the sum of brokerage revenue, underwriting revenue and proprietary revenue and the input variables are stakeholder equity, operational expenses, labor employment, and total fixed assets. Empirical results show that stakeholder equity and total fixed assets have low input efficiency scores which need to improve a lot. Compared to unpublished securities firms, listed securities firms have worse performance in using stakeholder equity and labor employment but have better performance in using total fixed assets. Compared to securities firms under financial holding companies (FHC), those who are not under a financial holding company have better performance in using stakeholder equity and labor employment but have worse performance in using total fixed assets. The risk-based capital has a positive effect on the efficiency of stakeholder equity. The age of a security firm has a negative effect on the usage efficiency of stakeholder equity.
Key words: Stochastic frontier analysis, Securities firms, Disaggregate input, Efficiency scores
iii
誌 謝
歲月如梭,兩年的研究所生涯轉眼間便要結束,想當初入學面試的畫面仍歷歷在目, 如今卻即將離開學校,邁入人生另一個階段。在交通大學的經管所,認識了許多優秀的 同學,也從老師們身上學習到許多知識和不同的人生經驗。碩士生涯能夠圓滿的結束, 真的需要感謝許多人。 首先我要感謝的是我的指導教授胡均立教授,在論文寫作的過程中,老師除了忙碌 於所長的事物之外,也不遺餘力地指導我們的論文,也多虧老師在過程當中的建議和指 導寫作方向,我的論文才能夠順利完成。而老師的幽默風趣和淵博學識也讓我學習到更 多人生的面向,做為阿立家族的一員讓我感到萬分的幸運。 另外也要感謝同為阿立家族的成員們,在論文撰寫的過程當中,成員們之間是那麼 地團結且熱心助人,大家一起討論問題,一起留守研究試寫論文的這段時光我會永遠記 得的。另外,也要感謝班上其它幫助過我的許多同學,無論是實際面的幫助還是心靈上 的陪伴,我真的很感謝有你們的存在。 此外我要感謝我的初稿審查委員丁承老師以及口試委員姜真秀教授、陳疆平教授和 陳惠國教授等給我論文的修改建議,讓我的研究更加完善。 我終於完成了研究所的學業,我想把這份榮耀獻給我最愛的家人,感謝你們在我寫 論文的這段期間默默地給予支持、包容和傾聽。 研究生 張絡捷 謹誌於交通大學經營管理所 中華民國 101 年 7 月 1 日iv
Content
中文摘要……….………i ABSTRACT……….………..ii 誌謝……….………..iii Content……….………..iv List of tables……….………...v List of figures………..v 1. Introduction………...1 2. Literature………...32.1 History of Taiwanese securities market………..3
2.2 Performance evaluation and efficiency………..6
2.3 Stochastic frontier analysis applied in efficiency evaluation……….6
3. Research method……….11
3.1 Stochastic frontier analysis, SFA. ………11
3.2 Data collection and variable definitions………...14
3.2.1 Preliminary data collection………14
3.2.2 Variable definitions………15
4. Empirical results………. 20
5. Conclusion……….. 29
5.1 Management Implications……….29
5.2 Research limitations and recommendations for future research………31
Reference……….. 32
v
List of tables
Table 1 Summary Data of Stock Market………..2
Table 2 Important Events in Taiwanese Securities Industry……….5
Table 3 Literature on efficiency evaluation using SFA………9
Table 4 Definition of input and output variables……….18
Table 5 Definition of environmental variables………20
Table 6 Description statistics of all variables………..21
Table 7 Correlation coefficient among the output and input variables………22
Table 8 Stochastic production frontier estimation results on stakeholder equity………25
Table 9 Stochastic production frontier estimation results on operational expenses……..….25
Table 10 Stochastic production frontier estimation results on labor employment……….…26
Table 11 Stochastic production frontier estimation results on total fixed assets………26
Appendix Table 1 The efficiency scores of stakeholder equity.………..…………35
Appendix Table 2 The efficiency scores of operational expenses………..…….37
Appendix Table 3 The efficiency scores of labor employment……….…….……….39
Appendix Table 4 The efficiency scores of total fixed assets……….………41
List of figures
Figure 1 Research procedure………...………10Figure 2 Efficiency scores in using stakeholder equity………...22
Figure 3 Efficiency scores in using operational expenses………...23
Figure 4 Efficiency scores in using labor employment………...23
1
1. Introduction
Securities industry plays two important roles. First, it is a platform of cash flow between the public, investment organization and enterprise. Secondly, performance and fluctuation of securities market reflect a country’s economic state, capital market condition and industry development. Securities firms are like a bridge in capital markets which provides services to meet fund supply and demand and operate in conditions that influence the corporate finance strategies, market fund flows, governmental policies, and economic growth.
The history of securities market in Taiwan has been over 50 years since the establishment of Taiwan Stock Exchange Corporation in 1962. The organization began to integrate the market regime and there were 18 listed companies and had a total value of 5.5 billion at that time. However, the worries about not gaining the help from the international finance corporation (IFC) when encountering financial crisis and the drastic fluctuation caused by a large quantity of individual investors, Taiwanese securities market has executed closed policy for a long time. After twenty years of development, Taiwan began to open its market to the rest of the world. In the 1990’s, the pace of the openness of capital market sped up. Nowadays, Taiwan securities firms have developed toward an internationalized market and Taiex is one of the international important stock market indices.
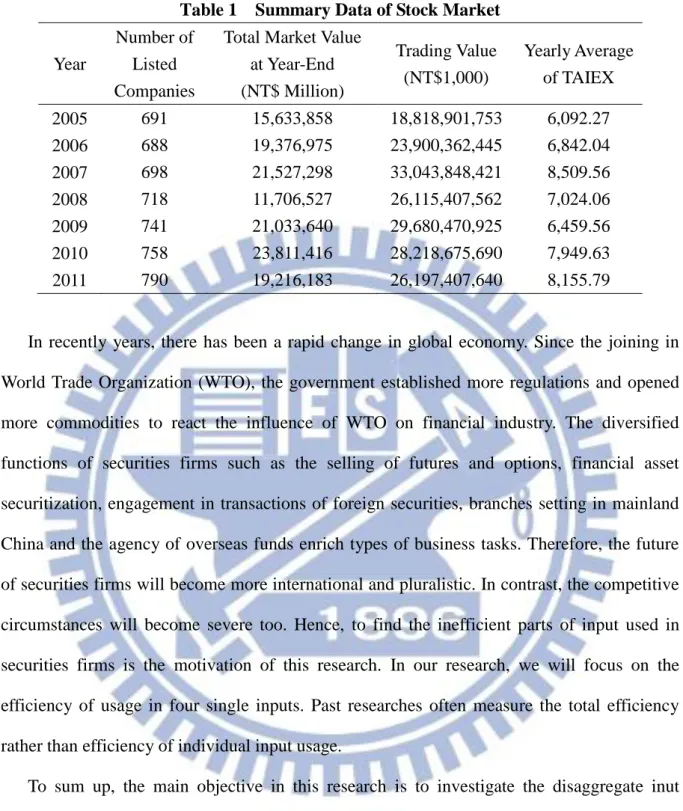
Thanks to the rapid growth of Taiwan economic, according to the information provided by Taiwan Stock Exchange there is a cumulative number of 790 listed firms and the total market value at year-end is about 19.2 trillion in 2011. Table 1 shows the summary data of stock market from 2005 to 2010.
2
Table 1 Summary Data of Stock Market
Year
Number of Listed Companies
Total Market Value at Year-End (NT$ Million) Trading Value (NT$1,000) Yearly Average of TAIEX 2005 691 15,633,858 18,818,901,753 6,092.27 2006 688 19,376,975 23,900,362,445 6,842.04 2007 698 21,527,298 33,043,848,421 8,509.56 2008 718 11,706,527 26,115,407,562 7,024.06 2009 741 21,033,640 29,680,470,925 6,459.56 2010 758 23,811,416 28,218,675,690 7,949.63 2011 790 19,216,183 26,197,407,640 8,155.79
In recently years, there has been a rapid change in global economy. Since the joining in World Trade Organization (WTO), the government established more regulations and opened more commodities to react the influence of WTO on financial industry. The diversified functions of securities firms such as the selling of futures and options, financial asset securitization, engagement in transactions of foreign securities, branches setting in mainland China and the agency of overseas funds enrich types of business tasks. Therefore, the future of securities firms will become more international and pluralistic. In contrast, the competitive circumstances will become severe too. Hence, to find the inefficient parts of input used in securities firms is the motivation of this research. In our research, we will focus on the efficiency of usage in four single inputs. Past researches often measure the total efficiency rather than efficiency of individual input usage.
To sum up, the main objective in this research is to investigate the disaggregate inut efficiency of stakeholder equity, operational expenses, labor employment, and total fixed assets of securities firms in Taiwan. The research will adopt stochastic frontier analysis (SFA) to explore the environmental influences on the performance of securities firms in Taiwan. However, companies who did not provide complete information or those had been closed will not be included in our research.
3
motivation and the brief background of securities market in Taiwan. Section 2 contains the history of securities market in Taiwan, introduction of performance and past literature referring to the application of SFA method. Section 3 contains methodology and variables selection. Section 4 includes the empirical results and the analysis of environmental effect on the performance of securities firms. Section 5 contains conclusions and managerial implications.
2. Literature
2.1 History of Taiwanese Securities Market
The course of change and development of Taiwanese securities market should be tracked back to Taiwan security firms. In 1949, the government published government bonds to gather financial resources. In 1953, the government implanted a policy named “land to the tiller” to change the identity of landlord to sharecropper and compensate landlords with four public-operated stocks, like Taiwan Cement, Taiwan Pulp & Paper, agriculture & forestry, and industrial & mining. The above circulation of government bonds and stock started the formation of over-the-counter (OTC) market.
To motivate the establishment of security markets, the government founded Taiwan Stock Exchange Corporation which was subordinated to Ministry of Economic Affairs. In 1968, the government announced Securities Exchange Act to be the legal basis in security market. In 1983, four security investment companies established and begun to launch common fund. Latter in 1988, because of the promulgation of “Standard of Security Dealers” and “Rules for Security Dealers”, the limitations about setting security dealers was thoroughly released which initiated a rapid growth in Taiwan securities industry. Until 2008, there were 718 securities firms which its growth rate was about 92% compared to the amount of 373 in 1988.
4
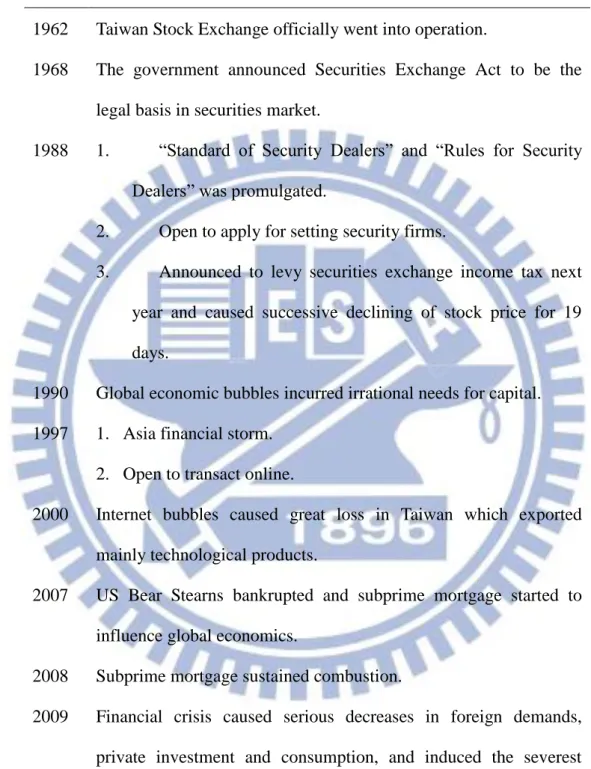
Taiwan stock once achieved the market quotations of over ten thousand which separately happened in 1990 (12682 point), 1997 (10256 point) and in 2000 (10393 point). However, Taiwan also experienced three times of short selling. In 1980, because of the asset bubbles, the index of weighted stock price fell from 12682 point to 2485 point for the first time. Latter in 1990, the internet bubble induced grievous damage in Taiwan, a country mainly exported information technology products. The last time was triggered by the storm of derivative bubbles in 2008 which was caused by subprime mortgage; therefore, Taiwan stock dropped 9859 point to 4110 point. While facing these crises, Taiwan securities market might have greater ability to manage crises than other emerging markets. Table 2 shows records of important events in Taiwanese securities industry.
5
Table 2 Important Events in Taiwanese Securities Industry
Time Event
1962 Taiwan Stock Exchange officially went into operation.
1968 The government announced Securities Exchange Act to be the legal basis in securities market.
1988 1. “Standard of Security Dealers” and “Rules for Security Dealers” was promulgated.
2. Open to apply for setting security firms.
3. Announced to levy securities exchange income tax next year and caused successive declining of stock price for 19 days.
1990 Global economic bubbles incurred irrational needs for capital. 1997 1. Asia financial storm.
2. Open to transact online.
2000 Internet bubbles caused great loss in Taiwan which exported mainly technological products.
2007 US Bear Stearns bankrupted and subprime mortgage started to influence global economics.
2008 Subprime mortgage sustained combustion.
2009 Financial crisis caused serious decreases in foreign demands, private investment and consumption, and induced the severest recession in recent 60 years.
6
2.2 Performance Evaluation and Efficiency
Glueck (1979) has defined that performance evaluation is a human resource work which is useful for enterprise to know the efficiency of every employee. Performance evaluation is a method used by an organization to measure an employee’s job performance during a period of time and a process to help an employee to grow mature. The results of performance evaluation can be used as a foundation to tune up the salary, job content, rewards, training needs, and career plan; in addition, it can help managers understand his/her employees. Companies can use performance evaluation to diagnose the relationship between employees and enterprise and then solve the potential problems in the organization to enhance employee’s promise. The definition of efficiency in Economics is a level of performance that describes a process that uses the lowest amount of inputs to create the greatest amount of outputs. Efficiency relates to the use of all inputs in producing any given output, including personal time and energy.
2.3 Stochastic Frontier Analysis Applied in Efficiency Evaluation
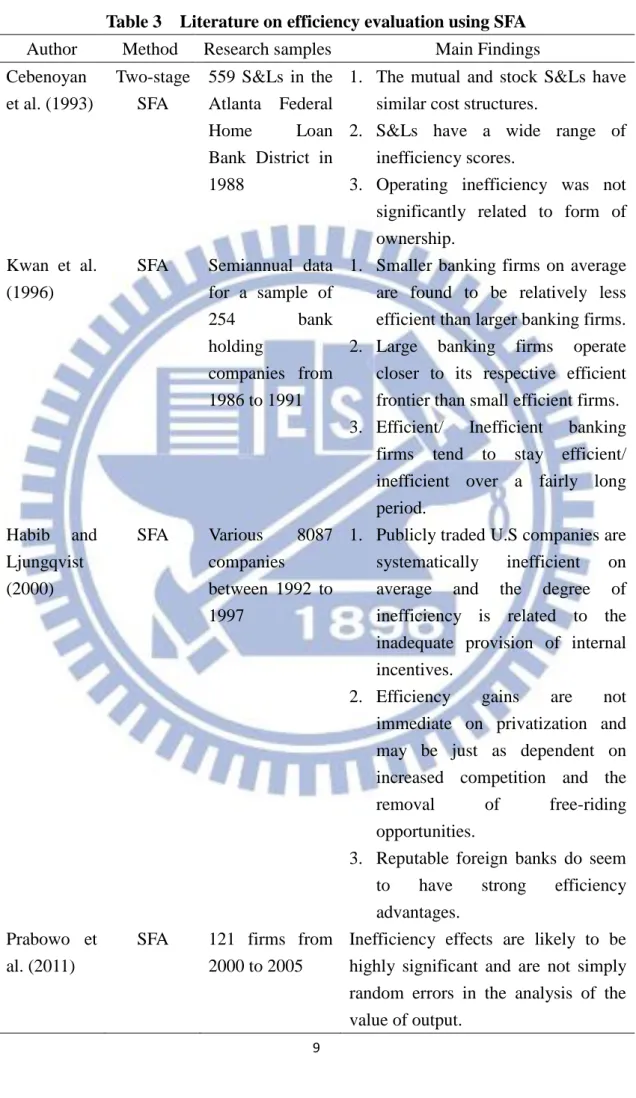
Cebenoyan et al. (1993) tried to use two-step approach to examine whether recent conversion activity of savings and loan associations (S&Ls) from mutual to stock organizations improved the overall performance of the thrift industry. Therefore, they employed a stochastic frontier methodology based on a multiproduct translog cost function to calculate the inefficiency scores for the 559 thrifts. In the study, authors used price of physical capital, price of deposits and price of labor as inputs and used construction loans, permanent mortgage loans, mortgage backed pass-through securities, other loans and other securities as outputs. The empirical results suggest that organizational form should not be a significant factor affecting an S&L’s operating efficiency.
From the policymaker and investor point of view, Kwan and Eisenbsis (1996) desired to examine the properties of X-inefficiency and the relations of X-inefficiency with risk-taking
7
and stock returns for U.S. banking firms. Therefore, they estimated a stochastic cost efficient frontier based on a multiproduct translog cost function. The outputs in this study are book value of investment securities, book value of real estate loans, book value of commercial and industrial loans, book value of consumer loans, and off-balanced sheet commitments and contingencies. And inputs are the unit price of capital, the unit cost of funds and unit price of labor. At last, under the controlling of scale differences, they discovered smaller banking firms on average are found to be relatively less efficient than larger banking firms. Moreover, smaller banking firms tend to exhibit larger variations in X-inefficiencies than larger firms. Besides, inefficient banking firms exhibit higher stock return variances, greater idiosyncratic risk in stock returns, lower capitalization, and higher loan charge-offs.
Habib and Ljungqvist (2000) desired to find out what reasons may influence the inefficiency of various companies. The authors employed a measure of relative performance which compared a firm’s actual Tobin’s Q to the Q* of a hypothetical fully-efficient firm having the same inputs and characteristics as the original firm. They investigated the performances of 8,087 firms from 1992 to 1997 by using the SFA. Their research provided evidence that publicly traded U.S companies between 1992 and 1997 are systematically inefficient on average and the degree of inefficiency is related to the inadequate provision of internal incentives.
Kraft et al. (2002) used bank balance sheet data for 1994-2000. The research estimates a Fourier-flexible frontier cost function. The authors adopted capital cost ratio, labor cost ratio and funding cost ratio as inputs and loans to enterprises, loans to households, deposits of enterprises and deposits of households as outputs. Besides, they defined an environmental variable which is the type of banks including private banks, new banks and foreign banks. The result shows efficiency gains are not immediate on privatization and may be just as dependent on increased competition and the removal of free-riding opportunities. It also reports that good management rather than cost efficiency explains the survival of more cost efficient
8
banks in the turbulent waters of transition banking. Last, reputable foreign banks do seem to have strong efficiency advantages.
Prabowo et al. (2011) attempts to model performance measurement for the firms listed on Indonesia Stock Exchange (IDX) using the stochastic frontier approach, using data of 121 firms from 2000 to 2005 and in total 726 pooled observations. The authors used four inputs which are labor, inventory, fixed assets, and capital. The output is total sales. Other z-variables used are age, size, market share, manufacturing classifications, and time period. The findings suggest that the trans-log functional form is a more general functional form, which is used as would be an appropriate model in representing the data for the sector listed. Findings also demonstrate that inefficiency effects are likely to be highly significant and are not simply random errors in the analysis of the value of output. The results also show that age and scale have a positive effect toward inefficiency. However, market share has a negative impact on technical inefficiency.
9
Table 3 Literature on efficiency evaluation using SFA
Author Method Research samples Main Findings Cebenoyan et al. (1993) Two-stage SFA 559 S&Ls in the Atlanta Federal Home Loan Bank District in 1988
1. The mutual and stock S&Ls have similar cost structures.
2. S&Ls have a wide range of inefficiency scores.
3. Operating inefficiency was not significantly related to form of ownership.
Kwan et al. (1996)
SFA Semiannual data for a sample of
254 bank
holding
companies from 1986 to 1991
1. Smaller banking firms on average are found to be relatively less efficient than larger banking firms. 2. Large banking firms operate closer to its respective efficient frontier than small efficient firms. 3. Efficient/ Inefficient banking
firms tend to stay efficient/ inefficient over a fairly long period. Habib and Ljungqvist (2000) SFA Various 8087 companies between 1992 to 1997
1. Publicly traded U.S companies are systematically inefficient on average and the degree of inefficiency is related to the inadequate provision of internal incentives.
2. Efficiency gains are not immediate on privatization and may be just as dependent on increased competition and the removal of free-riding opportunities.
3. Reputable foreign banks do seem to have strong efficiency advantages.
Prabowo et al. (2011)
SFA 121 firms from 2000 to 2005
Inefficiency effects are likely to be highly significant and are not simply random errors in the analysis of the value of output.
10
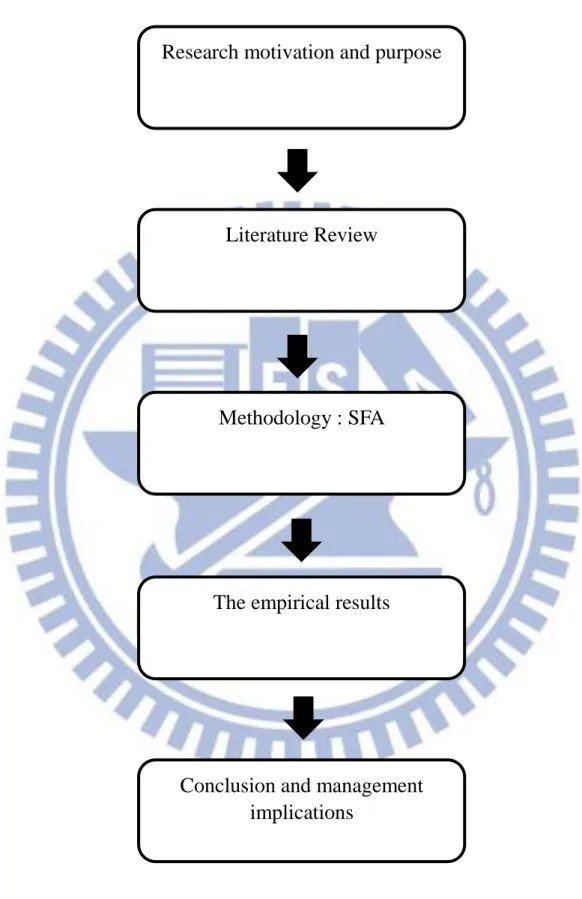
Figure 1 Research Procedure
Research motivation and purpose
The empirical results
Methodology : SFA
Conclusion and management
implications
11
3. Research Method
Our research applies the distance function approach of SFA to evaluate the efficiency of securities industry in Taiwan. The main inputs include stakeholder equity, operational expenses, labor employment and total fixed assets. The output is the sum of brokerage revenue, underwriting revenue and proprietary trading revenue. In this paper, we also examine the effects of environmental variables toward the efficiency values. The environmental variables include type of market, a dummy variable of being under financial holding company or not, risk-based capital and the year of a company’s establishment.
3.1 Stochastic Frontier Analysis (SFA)
The literature that actually aroused the development of SFA was the theoretical literature on productive efficiency. In 1951, Koopmans provided a definition of technical efficiency: A producer is technically efficient if, and only if, it is impossible to produce more of any output without producing less of some other output or using more of some input. Debreu (1951) and Shephard (1953) introduced distance function as a way of modeling multiple-output technology. The association of distance functions with technical efficiency measures played an important and leading role in the development of the efficiency measurement literature.
Farrell (1957) was the first author to measure productive efficiency empirically. He showed how to define cost efficiency and how to decompose cost efficiency into its technical and allocative components. Farrell’s work further inspired other scholars to develop the development of data envelopment analysis (DEA) and stochastic frontier analysis (SFA).
SFA is a parametric frontier approach to measure efficiency performance and includes statistical noises in efficiency analysis. SFA first appeared in two papers, proposed in Meeusen and van den Broeck (1977) and Aigner et al. (1977). The third SFA paper by Battese and Corra (1977) later appeared. These three original SFA models shared the composed error
12
structure and each was developed in a production frontier context. The model can be expressed as y = f(x;β)‧exp{ν-u}, where y is a scalar output, x is a vector of inputs, and β is a vector of technology parameters. The first error component ν ~ N(0, ) is intended to capture the effects of statistical noise, and the second error component u ≥ 0 is intended to capture the effects of technical inefficiency.
Early studies adopted a two-stage approach, in which efficiencies are estimated in the first stage, and estimates efficiencies are regressed against a vector of explanatory variables in a second stage. Recent studies, for example, Battese and Coelli (1995) have adopted a single-stage approach in which explanatory variables are incorporated directly into the inefficiency error component. In this approach either the mean or the variance of the inefficiency error component is hypothesized to be a function of the explanatory variables. Besides, Battese and Coelli defined a stochastic frontier production for panel data on firms, in which the non-negative technical inefficiency effects are assumed to be a function of firm-specific variables and time. The inefficiency effects are assumed to be independently distributed as truncations of normal distribution with constant variance, but with means which are a linear function of observable variables.
Zhou et al. (2012) adopted the single-equation, output-oriented stochastic frontier (SFA) to estimate the total-factor energy efficiency. Their proposed approach was based on cross-sectional data which analyzed the economy-wide energy efficiency performance of 21 OECD countries.
In this research, there is a sample of Taiwan whose efficiency of stakeholder equity, operational expenses, labor employment and total fixed assets in securities industry are to be compared. We follow Zhou et al. (2012) and assume that the stochastic frontier distance function is of the Cobb-Douglas functional form:
13 ln D (Eit, Oit, Lit, Cit, Yit) =
0 + E lnEit + O lnOit + L lnLit +c lnCit + Y lnYit + vit (1)
where D(Eit, Oit, Lit, Cit, Yit) is the distance function, Eit is stakeholder equity, Oit is
operational expenses, Lit is labor employment, Cit is total fixed capital, Yit is the real
economic output which is the sum of brokerage revenue, underwriting revenue and proprietary revenue, i indicates the securities company, and t refers to the time, and vit is a
random variable accounting for statistical noise and errors of approximation which follows the normal distribution. Because of the homogeneity of the distance function, the above equation can be presented as follows:
ln DE (Eit, Oit, Lit, Cit, Yit) =
lnEit + 0 + E ln1it + O lnOit + L lnLit + c lnCit + Y lnYit + vit (2)
which can also be arranged as
- lnEit = 0 + E ln1it + O lnOit + L lnLit + c lnCit
+ Y lnYit + vit - ln DE (Eit, Oit, Lit, Cit, Yit) (3)
That is,
ln(1/Eit) = 0 + O lnOit + L lnLit + c lnCit + Y lnYit + vit - uit (4)
where uit is an non-negative variable associated with stakeholder equity inefficiency. Because
of the incorporation of four environmental variables which are the type of market (TOM), financial holding company (FHC), risk-based capital (RBC) and the age of a company’s establishment (Age), the inefficiency effects are assumed to be defined by
uit = δ0 +δ1(TOMit)+δ2(FHCit)+δ3(RBCit)+δ4(Ageit)+wit (5)
and wit is defined by the truncation of the normal distribution with zero mean and variance
σ2. And v
it in equation 4 is the error component term of a stochastic production frontier. The
equation fits in the stochastic frontier model proposed by Battese and Coelli (1992) and can be applied to panel data. In application, the simultaneous estimation of production frontier and company specific inefficiency can be easily handled by the free Frontier 4.1 software package
14
developed and kindly provided by Professor Tim Coelli. The stakeholder equity efficiency of company i at time t is then
SEEit = exp(-uEit) (6) Moreover, we use disaggregate energy inputs here. Therefore, we can also change the logged inverse energy input on the left-hand side of Eq. (4) and leave other logged inputs on the right-hand side of Eq.(6), so that we can attain the efficiency scores of various inputs. The alternative predictors in our research contains not only stakeholder equity efficiency index but also operational expenses efficiency index, labor employment efficiency index and total fixed capital efficiency index. Thereafter, we apply the panel data, stochastic production frontier approach to estimate the stakeholder equity efficiency (SEE), operational expenses efficiency (OEE), labor employment efficiency (LEE), and total fixed capital efficiency (TFCE).
3.2 Data collection and variable definitions 3.2.1 Preliminary data collection
The securities firms in Taiwan are plenty. However, companies who have no complete data and those had already been closed will not be included in our study. The data from this study is collected from the database of Taiwan Economic Journal (TEJ), Taiwan Stock Exchange (TWSE) and Market Observation Post System (MOPS). The data period is from 2005 to 2011, all adding up to seven years. We take 2006 as the base period, and all the nominal variables will be converted into real variables through the GDP deflator.
In our research, we have a total number of 57 securities firms. The firms are Chinatrust Securities Co., Ltd, Yuanta Securities Co., Ltd, Jih Sun Securities Co., Ltd., Taishin Securities Co., Ltd., SinoPac Securities Corporation, E.Sun Securities Corp., Mega Securities Co., Ltd, Cathay Securities Corporation, Waterland Securities Co., LTD., First Securities Inc., Fubon Securities Co., Ltd., Hua Nan Securities Ltd. Co., Shin Kong International Securities Co., Ltd.,
15
Tachan Securities Co., Ltd., Ta Chong Securities Co., Ltd., Ta Ching Securities Co., Ltd, Horizon Securities Co., Ltd., Concord Securities Co., Ltd., Dah Chang Securities Co., Ltd., Grand Cathay Securities Corp, Da-Din Securities Co., Ltd, IBT Securities Co., Ltd., Chung Nourn Securities Co., Ltd., Jee Mach Securities Co., Ltd., Fortune Securities Co., Ltd., Pei Cheng Securities Co., Ltd., Wall Street Securities Corp., Yung Chuan Securities, Ying Shin Securities Co., Ltd, Kuang Long Securities, Chuan Tai Securities Co., Ltd., Antay Securities Co., Ltd., Oriental Securities Corporation, Hosin Securities Co., Ltd., Primasia Securities Company Limited, Chin Kang Securitis, King Fong Securities Co., Ltd., Shin Fan Securities, Ying Yi Securities, Concord International Securities Co., Ltd., Golden Gate Securities, KGI Securities Co., Ltd., Fu Hsing Securities, Full Long Securities Co., Ltd., Sunny Securities Co., Ltd., New Hundred King Securities Co., Ltd., Wan Tai Securities Co., Ltd., Vantone Securities Co., Ltd., Grand Fortune Securities Co., Ltd., Fushan Securities Co., Ltd, Feng Long Securities, Fong Shing Securities Co., Ltd., Pao Shin securities Co., Ltd., Shing Fong Securities Co., Ltd., MasterLink Securities Corporation, President Securities Corp., and Capital Securities Corp.
3.2.2 Variable Definitions
At the beginning of establishing and expanding securities firms, capital must be an important factor of the foundation of the company. Capital’s importance to financial institutions is mentioned in many articles. For example, Berger and Mester (1997) wrote that a bank’s insolvency risk depends on its financial capital available to absorb portfolio losses as well as on the portfolio risks themselves. In addition, Fukuyama and Webber (1999), Zang et al. (2006), Fang and Hu (2009) and Hu and Fang (2010) also acclaimed the role of capital. However, capital will have different values because of the difference of time of investment. Therefore, adoption of capital as an input may have a harmful effect on the research. Hence, we refer to Zang et al. (2006) and adopt stakeholder equity to be one of the inputs.
16
Prior researches often used salaries expense to measure the efficiency of managing a securities firm. However, there are two reasons that we don’t choose salaries expense as our input. First, we think salaries expense is just one of the items included in the operation fee of a company. Secondly, there is a research limitation because the item of salaries expense is seldom exposed on the financial statement of securities firms. Therefore, we follow the article of Drake and Hall (2003) and Hu and Fang (2010) and used operational expense as one of our inputs to measure efficiency. In addition, we refer to Fukuyama et al. (1999) and Wang et al. (2003) and include labor employment as one of the inputs. At last, we follow Fang and Hu (2009) and adopt total fixed assets as another input variable.
The following items are the inputs we choose: (1) stakeholder equity (x1)
(2) operation expense (x2) (3) labor employment (x3) (4) total fixed assets (x4)
Lots of companies use financial indicators, such as return on assets (ROA) and return on equity (ROE) to evaluate their financial performance; however, these performance relies on efficiency and productivity improvements and price variations (Fried et al. 2008, p.11). According to Development Report of China’s Securities Industry (2012) published by China Financial & Economic Publishing House, brokerage revenue, underwriting revenue and financial consultant fee are the main sources of revenues of securities firms. Goldberg et al. (1991) estimated the economies of scale and scope in defining the input-output variables, and used brokerage revenue, underwriting and capital positioning operations revenue and account supervision revenue as outputs. Zhang et al. (2006) used five outputs, namely, commission revenue, trade gains resulting from market creation, investment banking revenue, revenue from asset management, and total revenue. Besides, for the reference of Wang et al. (1998)
17
and Wang et al. (2003), the output in this research includes brokerage revenue and underwriting revenue. Therefore, the third output is proprietary trading revenue which is profit/loss from selling securities.
All variables in the research will be summed up to be an aggregate output. Because all the variables are nominal, we use the GDP deflator approach to deal with the effect of price change. All nominal variables in this study have been transformed into real variables through GDP deflators by using 2006 as the base year.
18
Table 4 Definition of input and output variables
Definition Units Description
Input
stakeholder equity
NTD (in thousands) in 2006
“stakeholder equity” in balance sheet
operational expenses
NTD (in thousands) in 2006
“operational expenses” in balance sheet, which is caused by selling and producing commodity labor
employment
Number of people number of employees in the “yearly finance report”
total fixed assets NTD (in thousands) in 2006
“total fixed assets” in balance sheet
Output
brokerage revenue
NTD (in thousands) in 2006
“brokerage revenue” in income statement
underwriting revenue
NTD (in thousands) in 2006
“underwriting revenue” in income statement
proprietary trading revenue
NTD (in thousands) in 2006
“proprietary trading revenue” in income statement
Note: To deal with the effect of price change on nominal variables, we use the GDP deflator approach. All the nominal variables in this research are transformed into real variables through GDP deflators by using 2006 as the base year.
19
Environmental variables are a set of dynamic named values that can affect the way running processes will behave on a computer and they cannot be influenced and controlled in the short run while they change in the long run and further impact the efficiency values.
According to Mitton (2002), better stock price performance is associated with firms that had indicators of higher disclosure quality. Therefore, we include the type of trading as an environmental variable because listed firms needs to provide their financial report while unlisted firms need not. Based on the differences of property, it’s necessary to examine whether different types of trading will have an impact on the efficiencies of securities firms.
In 1999, American pass a law called Financial Service Modernization Act of 1999. The law allows financial holding companies to do cross-industry business which means these companies can initiate different business such as banking, securities, insurance, etc. The law not only presents a significant transformation in the type of operation of financial industry in American but also stirs the world trend of consolidation of financial business. In Taiwan, there are many financial organizations who are small-sized and with high level of bad debts. According to the book of Ansoff (1965), it pointed out that business integration can lower the costs and increase the benefits. Therefore, we are interested in whether a securities firm is under a financial holding company can have a different efficiency score in using various resources. Therefore, we include the dummy variable of being under financial holding company or not as an environmental variable.
In recent years, Tecles and Tabak (2010) thinks that when there is a higher level of capitalization, there is a higher risk that a company will face which prompts that managers advance supervision on the management of the company and further have higher efficiency. Hence, the research adopts the variable of risk-based capital which shows the level of capitalization as one of the environmental variables.
Ritter (1991) finds that the age of a company’s establishment has a negative impact on the value of the company. Therefore, we want to know the influences of the age of a company
20
toward the efficiency of usage of individual inputs and incorporate the age of establishment of the company as an environmental variable. As of the financial crisis explosion on 2008, we set a dummy variable according to year. The years after 2008 are set to be one, and the years before 2008 are set to be zero. Therefore, we can see whether the financial crisis has an influence on the efficiency of inputs.
Table 5 Definition of environmental variables
Variable Definition
Type of trading The type of trading is classified into listed firms (TSE and OTC) and unlisted firms.
Financial Holding A dummy variable which describes whether a securities firm is under a financial holding company.
Risk-based
Capital Represent a company’s preference for risks. Age The year that a company establishes.
Year A dummy variable which describes the year before or after financial crisis which is set to be year 2008.
4. Empirical results
All the nominal figures in this research are adjusted to real figures on the base year of 2006. In Table 6, the descriptive statistics shows the firms’ characteristics. There are two types of trading in which 1 represents listed firms (TSE and OTC) and 0 represents unpublicized firms. In financial holding category, 1 represents that a securities firm is under a financial holding company and 0 represents that a securities firm is not under a financial holding company. In the year item, 1 means that the year measured is after 2008 and 0 means that the year measured is before 2008. In output and input data, the mean of output variable total revenues is NTD 2,141,675.04 thousand and the means of input of stakeholder equity,
21
operational expenses, labor and total fixed assets are NTD 6,306,593.35 thousand, NTD 891,644.09 thousand, 514 employees, NTD 718,712.59 respectively. Table 2 lists the correlation coefficients among input and output variables. We can see that there is high correlation between these variables.
Table 6 Description statistics of all variables
Variable N Mean S.D. Min Max
Output Total revenues (NTD thousand in 2006) 399 2141675.04 1656440.42 1.04 12559183.4 Input Stakeholder Equity (NTD thousand in 2006) 399 6306593.35 10902848.2 102149.39 72126503.3 Operational Expenses (NTD thousand in 2006) 399 891644.09 1480379.06 14044.79 8758688.25 Labor(number) 399 514 805.94 15 4500
Total fixed assets
(NTD thousand in 2006) 399 718712.59 1213258.2 199 7512274.44 Environmental Variables Type of trading 399 0.1401 0.3478 0 1 Financial holding 399 0.2281 0.4201 0 1 Risk-based Capital 399 0.5628 0.3152 0.14 2.03 Age 399 25.26 7.6426 10 53 Year 399 0.5714 0.4954 0 1
22
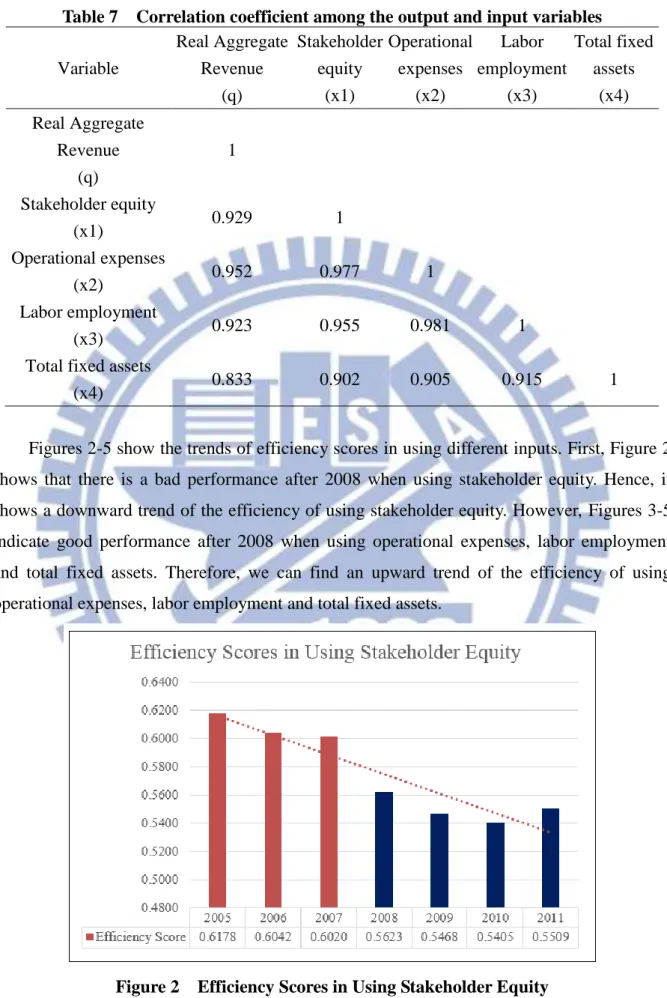
Table 7 Correlation coefficient among the output and input variables
Variable Real Aggregate Revenue (q) Stakeholder equity (x1) Operational expenses (x2) Labor employment (x3) Total fixed assets (x4) Real Aggregate Revenue (q) 1 Stakeholder equity (x1) 0.929 1 Operational expenses (x2) 0.952 0.977 1 Labor employment (x3) 0.923 0.955 0.981 1
Total fixed assets
(x4) 0.833 0.902 0.905 0.915 1
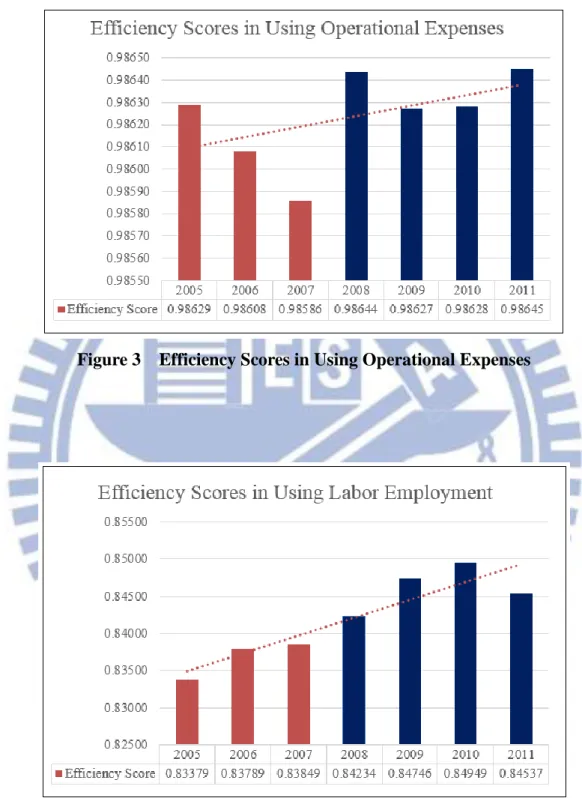
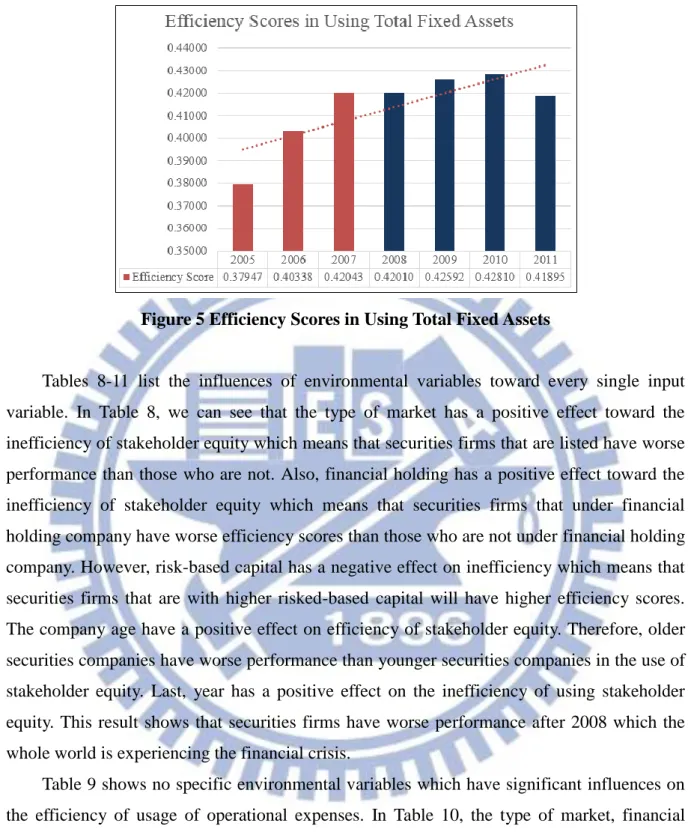
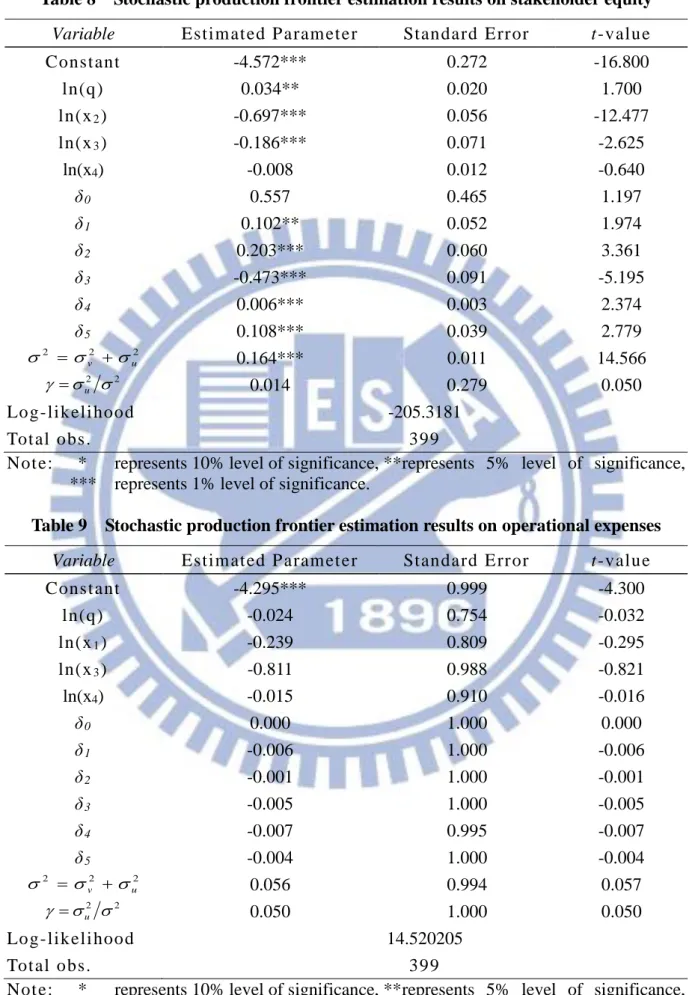
Figures 2-5 show the trends of efficiency scores in using different inputs. First, Figure 2 shows that there is a bad performance after 2008 when using stakeholder equity. Hence, it shows a downward trend of the efficiency of using stakeholder equity. However, Figures 3-5 indicate good performance after 2008 when using operational expenses, labor employment and total fixed assets. Therefore, we can find an upward trend of the efficiency of using operational expenses, labor employment and total fixed assets.
23
Figure 3 Efficiency Scores in Using Operational Expenses
24
Figure 5 Efficiency Scores in Using Total Fixed Assets
Tables 8-11 list the influences of environmental variables toward every single input variable. In Table 8, we can see that the type of market has a positive effect toward the inefficiency of stakeholder equity which means that securities firms that are listed have worse performance than those who are not. Also, financial holding has a positive effect toward the inefficiency of stakeholder equity which means that securities firms that under financial holding company have worse efficiency scores than those who are not under financial holding company. However, risk-based capital has a negative effect on inefficiency which means that securities firms that are with higher risked-based capital will have higher efficiency scores. The company age have a positive effect on efficiency of stakeholder equity. Therefore, older securities companies have worse performance than younger securities companies in the use of stakeholder equity. Last, year has a positive effect on the inefficiency of using stakeholder equity. This result shows that securities firms have worse performance after 2008 which the whole world is experiencing the financial crisis.
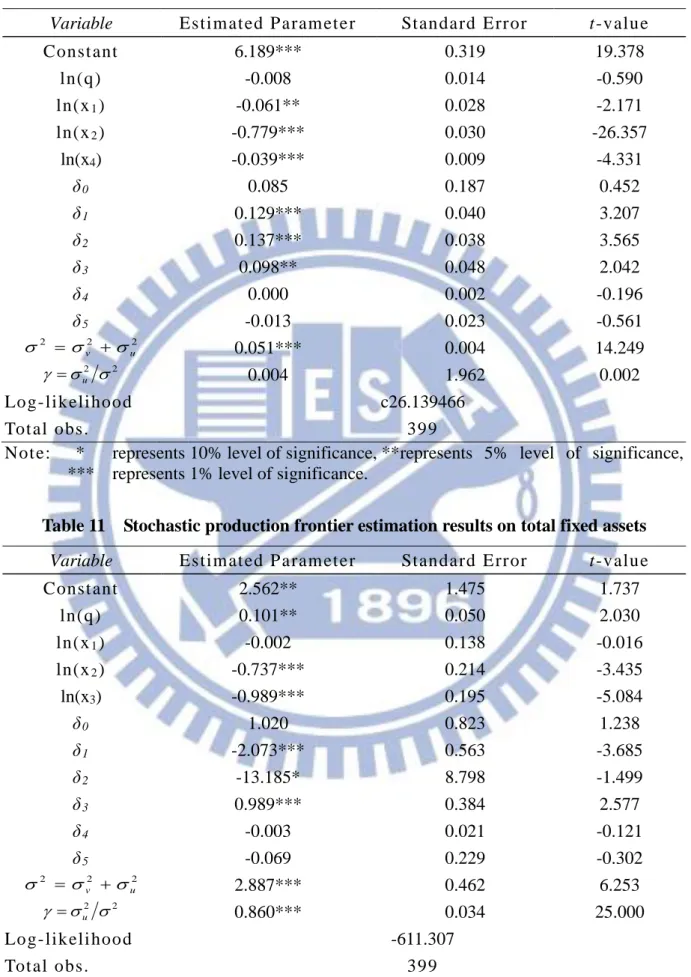
Table 9 shows no specific environmental variables which have significant influences on the efficiency of usage of operational expenses. In Table 10, the type of market, financial holding and risk-based capital have positive effects on the usage inefficiency of labor employment. However, company age and year have no significant effects on the usage inefficiency of labor employment. In Table 11, the market type, financial holding and company age have negative influences on the inefficiency of using total fixed assets. While, the risk-based ratio has a positive effect on the usage inefficiency of total fixed assets. Therefore, securities firms who have higher risk-based ratio have worse performance in using total fixed assets.
25
Table 8 Stochastic production frontier estimation results on stakeholder equity Variable Estim at ed P aram et er Standard Error t-value
Const ant -4.572*** 0.272 -16.800 ln(q) 0.034** 0.020 1.700 ln(x2) -0.697*** 0.056 -12.477 ln(x3) -0.186*** 0.071 -2.625 ln(x4) -0.008 0.012 -0.640 δ0 0.557 0.465 1.197 δ1 0.102** 0.052 1.974 δ2 0.203*** 0.060 3.361 δ3 -0.473*** 0.091 -5.195 δ4 0.006*** 0.003 2.374 δ5 0.108*** 0.039 2.779 2 2 2 u v 0.164*** 0.011 14.566 2 2 u 0.014 0.279 0.050 Log-likeli hood -205.3181 Tot al obs. 399
Not e: * represents 10% level of significance, ** represents 5% level of significance, *** represents 1% level of significance.
Table 9 Stochastic production frontier estimation results on operational expenses Variable Estim at ed P aram et er Standard Error t-value
Const ant -4.295*** 0.999 -4.300 ln(q) -0.024 0.754 -0.032 ln(x1) -0.239 0.809 -0.295 ln(x3) -0.811 0.988 -0.821 ln(x4) -0.015 0.910 -0.016 δ0 0.000 1.000 0.000 δ1 -0.006 1.000 -0.006 δ2 -0.001 1.000 -0.001 δ3 -0.005 1.000 -0.005 δ4 -0.007 0.995 -0.007 δ5 -0.004 1.000 -0.004 2 2 2 u v 0.056 0.994 0.057 2 2 u 0.050 1.000 0.050 Log-likeli hood 14.520205 Tot al obs. 399
Not e: * represents 10% level of significance, ** represents 5% level of significance, *** represents 1% level of significance.
26
Table 10 Stochastic production frontier estimation results on labor employment Variable Estim at ed P aram et er Standard Error t-value
Const ant 6.189*** 0.319 19.378 ln(q) -0.008 0.014 -0.590 ln(x1) -0.061** 0.028 -2.171 ln(x2) -0.779*** 0.030 -26.357 ln(x4) -0.039*** 0.009 -4.331 δ0 0.085 0.187 0.452 δ1 0.129*** 0.040 3.207 δ2 0.137*** 0.038 3.565 δ3 0.098** 0.048 2.042 δ4 0.000 0.002 -0.196 δ5 -0.013 0.023 -0.561 2 2 2 u v 0.051*** 0.004 14.249 2 2 u 0.004 1.962 0.002 Log-likeli hood c26.139466 Tot al obs. 399
Not e: * represents 10% level of significance, ** represents 5% level of significance, *** represents 1% level of significance.
Table 11 Stochastic production frontier estimation results on total fixed assets Variable Estim at ed P aram et er Standard Error t-value
Const ant 2.562** 1.475 1.737 ln(q) 0.101** 0.050 2.030 ln(x1) -0.002 0.138 -0.016 ln(x2) -0.737*** 0.214 -3.435 ln(x3) -0.989*** 0.195 -5.084 δ0 1.020 0.823 1.238 δ1 -2.073*** 0.563 -3.685 δ2 -13.185* 8.798 -1.499 δ3 0.989*** 0.384 2.577 δ4 -0.003 0.021 -0.121 δ5 -0.069 0.229 -0.302 2 2 2 u v 2.887*** 0.462 6.253 2 2 u 0.860*** 0.034 25.000 Log-likeli hood -611.307 Tot al obs. 399
Not e: * represents 10% level of significance, ** represents 5% level of significance, *** represents 1% level of significance.
27
The rankings in efficiency scores of the same energy source obtained from the SFA models are all stable over time. The average efficiency scores in various inputs during 2005-2011 are: stakeholder equity (0.574911), operational expenses (0.986238), labor employment (0.842117), and total fixed assets (0.413766). It is obvious that the efficiency of using stakeholder equity and total fixed assets are needed to improve very much.
The top five efficient securities firms of using stakeholder equity are Wall Street Securities Corp. (0.976), Chuan Tai Securities Co., Ltd. (0.958), Sunny Securities Co., Ltd (0.799), Vantone Securities Co., Ltd (0.772), and Full Long Securities Co., Ltd (0.756). The top five inefficient securities firms of using stakeholder equity are Jih Sun Securities Co., Ltd (0.356), Mega Securities Co., Ltd. (0.423), SinoPac Securities Corporation (0.424), Fubon Securities Co., Ltd. (0.427), and Horizon Securities Co., Ltd. (0.428). The range of efficiency score between the best and the worst securities firms is 0.62 which is quite large.
The top five efficient securities firms of using operational expenses are Jin Sun Securities Co., Ltd. (0.99293), Horizon Securities Co., Ltd. (0.99291), IBT Securities Co., Ltd. (0.99249), Oriental Securities Corporation (0.990059), and Ying Yi Securities (0.987875). The top five inefficient securities firms of using operational expenses are Cathay Securities Corporation (0.976406), Shing Fong Securities Co., Ltd (0.977166), E. Sun Securities Corp. (0.980286), Pei Cheng Securities Co., Ltd. (0.980739), and Da-Din Securities Co., Ltd (0.980959).
The top five efficient securities firms of using labor are IBT Securities Co., Ltd. (0.913), Grand Cathay Securities Corp (0.908), KGI securities Co., Ltd. (0.907), Primasia Securities Company Limited (0.9019), and Kuang Long Securities (0.9016). The top five inefficient securities firms of using labor are Taishin Securities Co., Ltd. (0.747), Cathay Securities Corporation (0.756), Chinatrust Securities Co., Ltd. (0.771), E.Sun Securities Corp. (0.772), and Yuanta Securities Co., Ltd (0.778).
28
(0.869), Taishin Securities Co., Ltd. (0.864), Fubon Securities Co., Ltd (0.862), Yuanta Securities Co., Ltd (0.861), and Jin Sun Securities Co., Ltd. (0.845). The top five inefficient securities firms of using total fixed assets are Chuan Tai Securities Co., Ltd. (0.0225), King Fong Securities Co., Ltd. (0.0278), Chung Nourn Securities Co., Ltd. (0.0312), Jee Mach Securities Co., Ltd. (0.0346), and Vantone Securities Co., Ltd. (0.035). The range of efficiency score between the best and the worst securities firms is about 0.847 which is quite large. Therefore, securities firms with lower efficiency in using total fixed assets need to consider how to reallocate their resources and catch up with those who have better performance.
29
5. Conclusion
5.1 Management Implications
In this research, we apply the panel data stochastic production frontier to estimate four different input efficiency scores for securities firms in Taiwan, and use the panel data during 2005-2011. The SFA approach extended from the cross-section SFA of Zhou et al. (2012) to a panel-data SFA. Besides, we examine the impact of five environmental variables toward the usage inefficiency of various inputs.
The average efficiency scores in using stakeholder equity, operational expenses, labor employment and total fixed assets are relatively 0.574911, 0.986238, 0.842117, and 0.413766. The results tell that most securities firms have greater use in operational expenses and labor employment. However, it is urgent for securities firms to improve the efficiency of using stakeholder equity and total fixed assets.
The figures of range between the greatest efficiency score and the least efficiency score in using stakeholder equity, operational expenses, labor employment and fixed total assets are 0.620577, 0.016533, 0.165789 and 0.846997. Therefore, we can see there is an enormous gap in the efficiency of using stakeholder equity and total fixed assets. Hence, securities firms who perform badly need to work really hard and find out the reasons to catch up with those who have great performance so that they will not be excluded from the competitive industry.
From Figures 2-5, we can see the trends in using different inputs. Stakeholder equity performs worse over time. Operational expenses, labor employment and total fixed assets have slightly increasing trends in efficiency performances.
The effects of environmental variables also reveal in this research. First, being listed securities firms and being with financial holding companies have positive impacts on the inefficiency of using stakeholder equity and labor employment. Therefore, in the aspect of using stakeholder equity and labor employment, listed securities companies have worse
30
performance than those who are not. And those securities firms who are under financial holding company also have worse efficiency scores than those who are not under financial holding company. Most of the time, subsidiaries will advance the services for their customers and hence reduce the cost of selling, management and marketing. However, pervious review and examination of finance situation and employee valuation are important. Therefore, without delicate analysis of finance circumstances and labor allocation before integration will cause decreasing performance. Hence, the research suggests these bad performing companies reexamine the division of their financial and labor resource. Referring to the positive influences of the type of market on the inefficiency, listed securities firms perform worse than unpublished securities firms, and the reason we guess might be that listed securities companies let their stakeholders bear the potential poor management.
Second, being listed securities firms and being with financial holding company have negative impact on the inefficiency of using total fixed assets. Therefore, listed securities firms have better performance than unpublished securities firms. Securities firms who are under financial holding company perform better than those who are not. The reason might be the synergy created by the integration of financial holding company.
The impact of risk-based capital has a negative impact toward the inefficiency score of using stakeholder equity. The variable represents capitalization which means the level of preference for risks. When risk-based capital is higher, the risk that a company faces is higher. Therefore, we guess the supervision on the use of stakeholder equity will be much more careful and strict when risk-based capital is higher. Hence, it might be the reason why risk-based capital has a negative influence on the inefficiency of using stakeholder equity. However, risk-based capital has positive effect on the inefficiency of using labor employment and total fixed assets. We think the reason why this happen is that higher risk-based capital reflect a higher capital as a shield so there might be a rush for excessive investment which cause improper use of labor and total fixed assets.
31
The age has a positive influence on the inefficiency score of using stakeholder equity. However, it does not have any significant influences on the efficiency of usage of other inputs. Therefore, older securities firms perform badly than younger securities firms in using stakeholder.
Last, we find year has a positive effect on the inefficiency score of using stakeholder equity. The fact means that securities firms have worse performance after 2008 which is the start of financial crisis. However, year has no significant effects on other inputs.
From this research we find different input usage efficiency and provide the information about efficiency in using individual input which may help securities firms find out where they can improve and what source they should be alerted with the usage and they can retarget resource allocation and slash the investment of those inefficient inputs.
5.2 Research limitations and recommendations for future research
However, because of the limitation of collecting complete data, we could not compare the efficiency of all the securities firms in Taiwan. Future researches can add more environmental variables like the scale of the securities firms or the number of branches of the securities firms to measure the performance of single input. Besides, we can also compare the efficiency between foreign securities firms and domestic securities firms or the efficiency between public securities firms and private securities firms. Therefore, we can know more about the reason why there is a difference in the usage efficiency and extend the content of this research.
32
References
[Journal Articles]
Aigner, D. L., Lovell, C. A. L., and Schmidt, P., “Formulation and Estimation of Stochastic Frontier Production Function Models,” Journal of Econometrics, 6(1), 21–37, 1977. Ansoff, H. I., Corporate Strategy, New York: McGraw-Hill, 1965.
Battese, G.E. and Corra, G.S., “Estimation of a Production Frontier Model: With Application to the Pastoral Zone of Eastern Australia,” Australian Journal of Agricultural Economics, 21(3), 169-179, 1977.
Battese, G. E. and Coelli, T. J., “Frontier Production Functions, Technical Efficiency and Panel Data: With Application to Paddy Farmers in India,” Journal of Productivity Analysis, 3(1-2), 163-169, 1992.
Battese, G. E. and Coelli, T.J., “A Model for Technical Inefficiency Effects in a Stochastic Frontier Production for Panel Data,” Empirical Economics, 20(2), 325-332, 1995. Berger, A.N. and Mester, L.J., “Inside the Black Box: What Explains Differences in the
Efficiencies of Financial Institutions?,” Journal of Banking and Finance, 21(7), 895-947, 1997.
Cebenoyan, A.S., Cooperman, E.S., Register, C.A. and Hudgins, S.C., “The Relative Cost Efficiency of Stock versus Mutual S&Ls: A Stochastic Cost Frontier Approach,” Journal of Financial Services Research, 7(2), 151–170, 1993.
Debreu, G., “The Coefficient of Resource Utilization,” Econometrica, 19(3), 273–292, 1951. Drake, L. and Hall, M. J. B., “Efficiency in Japanese Banking: an Empirical Analysis,”
Journal of Banking and Finance, 27(5), 891-917, 2003.
Fang, C. Y. and Hu, J. L., “A Metafrontier Study of Securities Broker and Dealer Efficiency under Zero-sum Gains,” Investment Management and Financial Innovations, 6, 53-62, 2009.
33
Farrell, M. J., “The Measurement of Productive Efficiency,” Journal of the Royal Statistical Society, Part A, 120(3), 253–281, 1957.
Fried, H. O., Lovell, C. K. and Schmidt, S. S, The Measurement of Productive Efficiency and Productivity Growth, Oxford: Oxford University Press, 2008.
Fukuyama, H. and Weber, W. L., “The Efficiency and Productivity of Japanese Securities Firms,” Japan and the World Economy, 11(1), 115-133, 1999.
Glueck, W.F. and Willis, R., “Documentary Sources and Strategic Management Research,”
Academy of Management Review, 4(1), 95-102, 1979.
Goldberg, L. G., Hanweck, G. A., Keenan, M. and Young, A., “Economies of Scale and Scope in the Securities Industry,” Journal of Banking & Finance, 15(1), 91-107, 1991. Habib, M., and Ljungqvist, A., “Firm Value and Managerial Incentives: A Stochastic Frontier
Approach,” The Journal of Business, 78(6), 2053-2094, 2005.
Hu, J. L. and Fang, C. Y., "Do Market Share and Efficiency Matter for Each Other? An Application of the Zero-Sum Gains Data Envelopment Analysis," Journal of the Operational Research Society, 61(4), 647-657, 2010.
Koopmans, T. C., “An Analysis of Production as an Efficient Combination of Activities,” Activity Analysis of Production and Allocation, 13, 33-37, 1951.
Kraft, E., Hofler, R., and Payne, J., “Privatization, Foreign Bank Entry and Bank Efficiency in Croatia: A Fourier-Flexible Function Stochastic Cost Frontier Analysis,” Applied Economics, 38(17), 2075-2088, 2006.
Kwan, S. H. and Eisenbeis, R. A., “An Analysis of Inefficiencies in Banking: A Stochastic Frontier Approach,” Working paper, Working Papers in Applied Economics, Federal Reserve Bank of San Francisco,1995.
Meeusen, W. and van Den Broeck, J., “Efficiency Estimation from Cobb-Douglas Production Functions with Composed Error,” International Economic Review, 18(2), 435–444, 1977.
34
Mitton, T., “A Cross-Firm Analysis of the Impact of Corporate Governance on the East Asian Financial Crisis,” Journal of Financial Economics, 64(2), 215–241, 2002.
Prabowo, H.E. and Cabanda, E., “Stochastic Frontier Analysis of Indonesian Firm Efficiency: A Note,” International Journal of Banking and Finance, 8(2), 5, 2011.
Shephard, R. W., Cost and Production Functions, Princeton: Princeton University Press, 1953. Staub, R. B., da Silva e Souza, G.S. and Tabak, B. M., “Evolution of Bank Efficiency in Brazil: A DEA Approach,” European Journal of Operational Research, 202(1), 204-213, 2010.
Tecles, P. L. and Tabak, B. M., “Determinants of Bank Efficiency: The Case of Brazil,” European Journal of Operational Research, 207(3), 1587-1598, 2010.
Wang, K. L., Weng, C. C. and Chang, M.L., “A Study of Technical Efficiencies of Integrated Securities Firms in Taiwan,” Review of Securities & Future Markets, 10(2), 93–116,
1998.
Wang, K. L., Tseng, Y. T. and Weng, C. C., “A Study of Production Efficiencies of Integrated Securities Firms in Taiwan,” Applied Financial Economics, 13(3), 159-167, 2003.
Zhang, W.D., Zhang, S. and Luo, X., “Technological Progress, Inefficiency, and Productivity Growth in the US Securities Industry,” Journal of Business Research, 59(2), 589-594, 2006.
Zhou, P., Ang, B. W. and Zhou, D. Q., “Measuring Economy-wide Energy Efficiency Performance: A Parametric Frontier Approach,” Applied Energy, 90(1), 196-200, 2012.
[Websites]
Market Observation Post System. Website: http://mops.twse.com.tw/mops/web/index Taiwan Economic Journal. Website: http://www.finasia.biz.
35
Appendix
Appendix Table 1 The efficiency scores of stakeholder equity
Firms 2005 2006 2007 2008 2009 2010 2011 Average Chinatrust Securities Co., Ltd 0.482 0.495 0.489 0.453 0.501 0.476 0.487 0.483 Yuanta Securities Co., Ltd 0.485 0.506 0.527 0.462 0.476 0.444 0.446 0.478 Jih Sun Securities Co., Ltd. 0.369 0.364 0.368 0.347 0.350 0.345 0.349 0.356 Taishin Securities Co., Ltd. 0.590 0.584 0.582 0.533 0.556 0.542 0.561 0.564 SinoPac Securities Corporation 0.458 0.440 0.443 0.425 0.404 0.396 0.407 0.425 E.Sun Securities Corp. 0.528 0.527 0.523 0.535 0.492 0.465 0.491 0.509 Mega Securities Co., Ltd 0.452 0.433 0.438 0.407 0.407 0.404 0.422 0.423 Cathay Securities Corporation 0.662 0.651 0.650 0.589 0.510 0.503 0.471 0.576 Waterland Securities co., LTD. 0.558 0.495 0.484 0.439 0.421 0.411 0.433 0.463 First Securities Inc. 0.463 0.460 0.462 0.443 0.428 0.420 0.436 0.445 Fubon Securities Co., Ltd. 0.441 0.445 0.448 0.429 0.407 0.401 0.423 0.428 Hua Nan Securities Ltd. Co. 0.475 0.472 0.464 0.455 0.420 0.412 0.432 0.447 Shin Kong International Securities
Co., Ltd. 0.639 0.477 0.472 0.471 0.422 0.410 0.433 0.475 Tachan Securities Co., Ltd. 0.518 0.491 0.514 0.474 0.484 0.485 0.497 0.495 Ta Chong Securities Co., Ltd. 0.503 0.481 0.486 0.486 0.459 0.455 0.464 0.476 Ta Ching Securities Co., Ltd 0.505 0.497 0.496 0.481 0.457 0.453 0.479 0.481 Horizon Securities Co., Ltd. 0.469 0.448 0.439 0.405 0.410 0.423 0.408 0.429 Concord Securities Co., Ltd. 0.515 0.507 0.513 0.508 0.478 0.467 0.470 0.494 Dah Chang Securities Co., LTD. 0.651 0.620 0.544 0.545 0.495 0.492 0.514 0.551 Grand Cathay Securities Corp 0.521 0.516 0.553 0.524 0.513 0.492 0.500 0.517 Da-Din Securities Co., Ltd 0.785 0.739 0.726 0.642 0.631 0.642 0.647 0.688 IBT Securities Co., Ltd. 0.437 0.444 0.470 0.486 0.430 0.422 0.448 0.448 Chung Nourn Securities Co, Ltd. 0.630 0.625 0.608 0.547 0.537 0.537 0.537 0.574 Jee Mach Securities Co., Ltd. 0.604 0.598 0.602 0.541 0.535 0.536 0.537 0.565 Fortune Securities Co., Ltd 0.624 0.617 0.614 0.567 0.545 0.516 0.523 0.572 Pei Cheng Securities Co., Ltd. 0.722 0.752 0.735 0.664 0.643 0.641 0.654 0.687 Wall Street Securities Corp. 0.987 0.978 0.982 0.968 0.964 0.971 0.987 0.977 Yung Chuan Securities 0.649 0.637 0.635 0.570 0.557 0.560 0.578 0.598 Ying Shin Securities Co., Ltd 0.595 0.592 0.582 0.526 0.547 0.541 0.539 0.560 Kuang Long Securities 0.585 0.579 0.574 0.511 0.514 0.513 0.512 0.541 Chuan Tai Securities Co. Ltd. 0.952 0.964 0.964 0.953 0.953 0.959 0.965 0.959 Antay Securities Co., Ltd. 0.619 0.617 0.620 0.572 0.551 0.553 0.556 0.584 Oriental Securities Corporation 0.575 0.556 0.545 0.530 0.514 0.508 0.517 0.535
36
Appendix Table 1 (Continued) The efficiency scores of stakeholder equity
Firms 2005 2006 2007 2008 2009 2010 2011 Average Hosin Securities Co., Ltd. 0.727 0.725 0.719 0.644 0.639 0.642 0.649 0.678 Primasia Securities Company
Limited 0.570 0.564 0.568 0.535 0.522 0.527 0.540 0.547 Chin Kang Securitis 0.722 0.709 0.679 0.623 0.607 0.613 0.610 0.652 King Fong Securities Co., Ltd 0.680 0.681 0.671 0.614 0.607 0.607 0.618 0.640 Shin Fan Securities 0.650 0.643 0.643 0.581 0.576 0.577 0.579 0.607 Ying Yi Securities 0.630 0.624 0.612 0.551 0.547 0.545 0.543 0.579 Concord International Securities
Co., Ltd 0.640 0.625 0.651 0.609 0.579 0.579 0.609 0.613 Golden Gate Securities 0.614 0.609 0.604 0.565 0.538 0.537 0.540 0.573 KGI Securities Co., Ltd 0.554 0.554 0.565 0.493 0.494 0.484 0.497 0.520 Fu Hsing Securities 0.685 0.683 0.673 0.606 0.597 0.598 0.603 0.635 Full Long Securities Co., Ltd. 0.897 0.751 0.751 0.717 0.727 0.716 0.736 0.756 Sunny Securities Co., Ltd 0.879 0.854 0.844 0.793 0.761 0.747 0.718 0.799 New Hundred King Securities Co.,
Ltd 0.715 0.709 0.704 0.663 0.630 0.632 0.651 0.672 Wan Tai Securities Co., Ltd 0.667 0.612 0.650 0.590 0.582 0.585 0.588 0.610 Vantone Securities Co., Ltd. 0.825 0.820 0.811 0.745 0.736 0.727 0.745 0.773 Grand Fortune Securities Co., Ltd 0.772 0.753 0.770 0.721 0.693 0.613 0.699 0.717 Fushan Securities Co., Ltd 0.628 0.622 0.617 0.573 0.552 0.551 0.557 0.586 Feng Long Securities 0.643 0.636 0.625 0.563 0.558 0.560 0.560 0.592 Fong Shing Securities Co., Ltd 0.610 0.608 0.605 0.549 0.544 0.546 0.547 0.573 Pao Shin securities Co., Ltd. 0.753 0.742 0.723 0.649 0.645 0.644 0.650 0.687 Shing Fong Securities Co., Ltd. 0.852 0.852 0.808 0.770 0.667 0.642 0.653 0.749 MasterLink Securities Corporation 0.484 0.481 0.495 0.457 0.448 0.432 0.453 0.464 President Securities Corp. 0.486 0.490 0.485 0.476 0.450 0.444 0.457 0.470 Capital Securities Corp. 0.481 0.483 0.485 0.477 0.460 0.467 0.477 0.476 Average 0.618 0.604 0.602 0.562 0.547 0.540 0.551 0.575