國
立
交
通
大
學
機械工程學系
碩士論文
地板材質改變對行走於其上的步態穩定性之影響
Effects of Floor Material Change on Gait Stability
研 究 生:胡馨云
指導教授:楊秉祥 教授
地板材質改變對行走於其上的步態穩定性之影響
Effects of Floor Material Change on Gait Stability
研 究 生:胡馨云 Student:Hsin-Yun Hu
指導教授:楊秉祥 博士 Advisor:Bing-Shiang Yang, Ph.D.
國立交通大學機械工程系
碩士論文
A Thesis
Submitted to Department of Mechanical Engineering College of Engineering
National Chiao Tung University in partial Fulfillment of the Requirements
for the Degree of Master
in
Mechanical Engineering Feb. 2010
Hsiunchu, Taiwan, Republic of China
地板材質改變對行走於其上的步態穩定性之影響 學生:胡馨云 指導教授:楊秉祥 博士 國立交通大學機械工程學系(研究所)碩士班 摘 要. 跌倒相關傷害為世界上嚴重而普遍的公眾健康議題,於許多已開發國家亦 同,且多發生於室內。然地板材質轉換雖為一普遍存在之現象,但於考量室 內跌倒因子時較少被討論。有鑑於此,本研究以生物力學的角度去研究人體 動作與平衡控制,並以改善居家環境安全、減少地板材質產生的跌倒事件為 目標,量化地板材質轉換(例如:客廳至廚房)時步態之改變,更進一步分 析地板材質轉換於步態穩定性上之影響。本試驗包含由三種台灣居家常見之 地板材質–光面木頭、粗面磁磚、及塑膠地板,組合成的七種地板情境。並 使用一組八台攝影機組成之動作擷取系統和兩塊力板量測受測者行走時的運 動學與動力學資料。共有五位年輕健康成人、一位中高齡男性及一位高齡女 性受測者參與本研究。每位受測者皆以自身習慣之速度行走於六公尺長之實 驗走道上,並完成兩種材質連續(走道皆為同一地板材質,包含:光面木頭、 粗面磁磚)及四種材質轉換(走道自一地板材質轉換至另一種地板材質,包 含:光面木頭至塑膠地板、塑膠地板至光面木頭、粗面磁磚至塑膠地板、塑 膠地板至粗面磁磚)等六種地板情境,每種皆重複二十次試驗。此外,年輕 受測者需額外完成二十次乾燥粗面磁磚至清水潑覆粗面磁磚的試驗。實驗結 果顯示當行走在高摩擦係數至低摩擦係數之地板材質轉換情形時,會有腳跟 觸地角度減小約 30%、骨盆於矢狀面之前傾角度峰值減小,及所需摩擦係數 峰值約增加 5-10%的現象。而年輕與中高齡受測者身體質量中心在額狀面上 的偏移量增加顯示其步態於地板材質轉換情形下穩定度較差。上述結果顯示 材質轉換相較於材質連續的情況,可能會提高跌倒風險,故建議避免採用地 板材質轉換的情況,特別是在高齡者的居住空間中。
Effects of Floor Material Change on Gait Stability
Student: Hsin-Yun Hu Advisor: Dr. Bing-Shiang Yang
De
partment of Mechanical Engineering National Chiao Tung UniversityABSTRACT
Fall related injuries are serious public health issues all over the world, including in many developed countries, and most fall incidents occur at home. However, floor transition is a common yet frequently neglected condition when consider risk factors of falls. In consideration of high incident rates of fall-at-home events, our study aims to examine the effect of floor material change (transition), e.g. from living room to kitchen, on the control of level walking and gait stability, in order to reduce the floor material-induced risks of falls and improve the safety of home environment. We used three commonly-used floor materials at home in Taiwan – plane-wood, rough-ceramic, and polyvinyl chloride (PVC), to construct seven different floor conditions for the experiment. An eight-camera motion capture system and two force platforms were used to obtain kinematics and kinetics during level walking. Five healthy young adults and two older subjects volunteered for this study. All subjects completed 20 walking trials, on a 6-m long walkway at self-selected comfortable speed, each under two consistent condition (i.e. same floor material) – plane-wood and rough-wood floor, and four transition condition (i.e. from one material to another) – plane-wood to PVC, PVC to plane-wood, rough-wood to PVC and PVC to rough-wood floor. The five young participants also completed 20 trials on an additional dry to wet ceramic condition. Our results showed that when subjects walked from one floor to another with slightly lower coefficient of friction (COF), the peak required COF under foot increased 5% to 10%, and the foot angle at heel strike decreased about 30%. Moreover, peak anterior pelvic tilt angle was smaller as compared to those when walking under the consistent condition. The results imply a higher risk of falls during walking in transition than consistent conditions. Furthermore, the larger medial-lateral COM excursion also indicates that subjects had less stable locomotion under transition condition. Therefore, we suggest people avoid or use caution when they walk under transition condition, especially for the living environment of the elderly.
Acknowledgements
終於完成論文了!一路來經歷了許多實驗流程的修改,也不斷地在每次 實驗中學習經驗,還有折磨人的漫漫分析長路,總算是有個初步的成果。由 於還只是初步的小小成果,請包容其中也許有許多不完美及有待深入研究的 部份。在此特別感謝計劃書審查及論文口試委員:秦繼華老師、洪景華老師、 洪紹剛老師及林育志老師所提供的寶貴評論和建議,以及國科會的經費補助。 兩年多來,我要謝謝曾幫助過我的每一位:老師、實驗室成員、我的家 人,還有其他曾給我建議和鼓勵,聽我發牢騷,幫助我完成實驗的人。我也 要特別感謝實驗參與者,有你們的付出才能有現在的研究成果。從進到這個 看似很不機械系的實驗室以來,我學到也經驗到很多,不管是實驗的設計和 操作、讀 paper 的方法、趕計畫進度或是參與國內、外大大小小研討會都是很 寶貴的經驗。謝謝老師在各方面的指導,讓我有機會能夠在國際研討會磨練, 也看到不純粹只是機械的領域。特別感謝實驗室的每一位成員:貽婷、玉瑭、 學咪、致中、松緯、顯庭、廷昇、柏伽、祥晴、欣恬、伊晟、芷沂、崇論、 韻芹,還有分析小精靈!有你們的熱情參與和協助才能有這篇論文的產生; 也因為你們,研究的路上雖然很辛苦不過也有許多歡樂,祝福你們在往後的 研究中都能順利。最後我要說:辛苦了馨云,恭喜妳從右臂滑鼠使用過度中 解脫!Table of Contents
摘 要. ... I ABSTRACT ...II ACKNOWLEDGEMENTS ... III TABLE OF CONTENTS ... IV LIST OF TABLES ... VI LIST OF FIGURES ...VII1 INTRODUCTION ...1
1.1 BACKGROUND...1
1.2 OBJECTIVE...3
1.3 HYPOTHESIS...4
2 LITERATURE REVIEW ...6
2.1 FALL-RELATED SOCIOECONOMIC COSTS...6
2.2 FALLS AND SLIPS...8
2.3 EFFECTS OF FLOOR SURFACE ON GAIT CHARACTERISTICS...9
2.4 AGE-RELATED EFFECTS ON GAIT CHARACTERISTICS...11
2.5 ANALYSIS OF GAIT STABILITY...12
3 MATERIALS AND METHODS ...16
3.1 PARTICIPANTS...16
3.2 EXPERIMENTAL PROTOCOL...17
3.2.1 Apparatus ...19
3.2.2 Experimental procedure ...25
3.3 DATA ANALYSIS...29
3.3.1 Definition and calculation of variables...29
3.3.2 Data processing...35
3.4 STATISTICAL ANALYSES...37
4 RESULTS...39
4.1 COEFFICIENT OF FRICTION OF EXPERIMENTAL FLOOR MATERIALS...39
4.2 GAIT ADJUSTMENT ON DIFFERENT FLOOR CONDITIONS...41
4.3 CORRELATION BETWEEN COM AND OTHER GAIT VARIABLES...50
5 DISCUSSION AND CONCLUSIONS...53
5.1 EFFECTS OF FLOOR TRANSITION ON LOCOMOTION...53
5.2 VARIABLES THAT COULD BE USED AS GAIT STABILITY INDEX...54
5.3 LIMITATIONS OF THE STUDY...55
5.4 RECOMMENDATIONS FOR FUTURE RESEARCH...56
List of tables
TABLE 1PARTICIPANT CHARACTERISTICS... 17
TABLE 2PERCENTAGE OF MASS (% OF WHOLE-BODY MASS) AND LOCATION OF CENTER OF MASS (% OF SEGMENTAL LENGTH) OF EACH BODY SEGMENT... 25
TABLE 3DEFINITIONS/ABBREVIATIONS OF DEPENDENT PARAMETERS... 37
TABLE 4MEAN COFS (SD) OF FLOOR MATERIALS MEASURED IN FOUR
PERPENDICULAR DIRECTIONS UNDER DRY AND WATER-CONTAMINANT CONDITIONS.
... 40 TABLE 5 THE CORRELATION COEFFICIENT OF FLOOR MATERIALS UNDER DRY AND
List of figures
FIGURE 1GAIT CYCLE.THE WALKING CYCLE IS DEFINED AS THE PERIOD BETWEEN INSTANTS OF HEEL STRIKE OF THE SAME FOOT (I.E. RIGHT HEEL STRIKE TO RIGHT HEEL STRIKE), AND THE CONTRALATERAL LIMB BEGINS ITS CYCLE MIDWAY THROUGH THE IPSILATERAL STRIDE CYCLE.USUALLY, ALL DESCRIPTION OF GAIT ARE DESCRIBED WITH REFERENCE TO DIFFERENCE ASPECTS OF THE GAIT CYCLE.
(ANNE SHUMWAY-COOK AND MARJORIE WOOLLACOTT 2006) ... 13
FIGURE 2DIAGRAMMATIC ILLUSTRATION OF COM-COP INCLINATION ANGLES IN FRONTAL PLANE.ADOPTED FROM (H.-J.LEE AND L.-S.CHOU 2006)... 14
FIGURE 3EXPERIMENTAL FLOOR MATERIALS –PLANE-WOOD (TOP),PVC(BOTTOM LEFT) AND ROUGH-CERAMIC TILE (BOTTOM RIGHT). ... 18
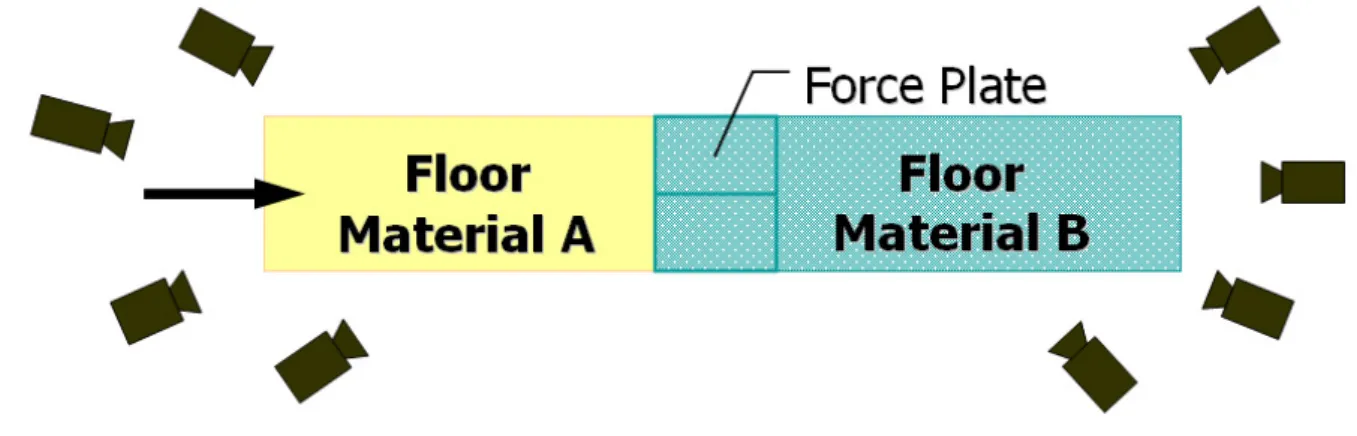
FIGURE 4DISPOSAL OF FLOOR MATERIALS IN TRANSITION CONDITION OF THE EXPERIMENT.FIRST HALF OF THE WALKWAY USE ONE FLOOR MATERIAL (A), FORCE PLATES AND SECOND HALF OF THE WALKWAY USE ANOTHER FLOOR
MATERIAL (B) WITH DIFFERENT COEFFICIENT OF FRICTION... 19
FIGURE 5MARKER SET PLACEMENT.THIS STUDY USE MODIFY HELEN HAYES MARKER SET (M.P.KADABA,H.K.RAMAKRISHNAN ET AL.1990) WITH SEVENTEEN
ADDITIONAL MARKERS... 20
FIGURE 6FORCE PLATFORMS MOUNTED UNDERNEATH IN THE MIDDLE OF THE
WALKWAY... 21
FIGURE 7SLIPMETER:ENGLISH XL(LEFT),NEOLITE TESTFOOT PAD (MIDDLE),
MAINTAIN THE WORKING PRESSURE AT 172KPA (25 PSI, RIGHT)... 22
FIGURE 8MEASUREMENT OF ANTHROPOMETRY DATA: PELVIC DEPTH.MEASURE THE VERTICAL DISTANCE BETWEEN ASIS AND THE HORIZONTAL OF IPSILATERAL
GREATER TROCHANTER OF THE FEMUR... 24
FIGURE 9FLOWCHART OF MEASURING THE COEFFICIENT OF FRICTION OF FLOOR
MATERIALS... 26
FIGURE 10FLOWCHART OF GAIT STABILITY EXPERIMENT... 28
FIGURE 11USER INTERFACE OF SELF-DEVELOPED MATALB8.0(MATHWORKS INC.,
USA) PROGRAM.AFTER LOADING THE C3D FILE WHICH HAS BEEN LABELED, FILTERED, SMOOTHED, AND INTERPOLATED, THE PROGRAM COULD CALCULATE THE CENTER OF MASS OF EACH SEGMENT AND WHOLE BODY.THE DATA FROM FINISHING THE CALCULATION PROCESS COULD EXPORT AS EXCEL FORMAT. ... 36
FIGURE 12MEASURE AND SD(ERROR BAR) OF COEFFICIENT OF FRICTION OF TESTED FLOOR MATERIALS UNDER DRY AND WATER-CONTAMINANT CONDITIONS. ... 40
FIGURE 13COF WITH DRY AND WATER-CONTAMINANT FLOOR SURFACE WHICH MEASURED IN FOUR PERPENDICULAR DIRECTIONS.THE SCATTER CHART SHOWS NO SIGNIFICANT COVARIANCE OF COF BETWEEN DRY AND WATER-SPILLED
CONDITION.ALL THE P-VALUES OF PLANE-WOOD, ROUGH-CERAMIC AND PVC ARE SMALLER THAN 0.001) ... 41
FIGURE 14PEAK RCOFS ON DIFFERENT FLOOR CONDITIONS.PEAK REQUIRED COEFFICIENT OF FRICTION WERE SIGNIFICANT GREATER IN THE TRANSITION
CONDITION THAN IN THE CORRESPONDING CONSISTENT CONDITION (PW: PLANE WOOD,RC: ROUGH CERAMIC,*P<0.05,**P<0.01). ... 42
FIGURE 15PEAK RCOF OF 52 YEARS-OLD MALE ON DIFFERENT FLOOR CONDITIONS.
PEAK REQUIRED COEFFICIENT OF FRICTION WAS GREATER IN THE TRANSITION CONDITION THAN IN THE CONSISTENT CONDITION (PW: PLANE WOOD,RC: ROUGH CERAMIC)... 43
FIGURE 16PEAK RCOF OF 71 YEARS-OLD FEMALE ON DIFFERENT FLOOR CONDITIONS.
PEAK REQUIRED COEFFICIENT OF FRICTION WAS LOWER IN THE TRANSITION CONDITION THAN IN THE CONSISTENT CONDITION.(PW: PLANE WOOD,RC:
ROUGH CERAMIC *P<0.05)... 44
FIGURE 17FOOT-RAMP ANGLE AT HEEL STRIKE ON DIFFERENT FLOOR CONDITIONS.
FOOT-RAMP ANGLE AT HEEL STRIKE DECREASED IN TRANSITION CONDITION.(PW: PLANE WOOD,RC: ROUGH CERAMIC,COF-DIFF.:COF DIFFERENCE BETWEEN TWO CONTINUOUS FLOOR MATERIALS.*P<0.05,**P<0.01) ... 46
FIGURE 18PEAK RIGHT PELVIC ANTERIOR TILT ON DIFFERENT FLOOR CONDITIONS
(YOUNG PARTICIPANTS).PELVIC ANTERIOR TILT ANGLE DECREASED
SIGNIFICANTLY IN TRANSITION CONDITIONS.(PW: PLANE WOOD,RC: ROUGH CERAMIC,COF-DIFF.:COF DIFFERENCE BETWEEN TWO CONTIGUOUS FLOOR MATERIALS.*P<0.05,**P<0.01)... 47
FIGURE 19PEAK RIGHT PELVIC ANTERIOR TILT ON DIFFERENT FLOOR CONDITIONS
(FIFTY-TWO YEARS-OLD MALE).PELVIC ANTERIOR TILT ANGLE INCREASED
SIGNIFICANTLY WHEN WALK FROM LOW-COF TO HIGH-COF FLOOR.(PW: PLANE WOOD,RC: ROUGH CERAMIC,COF-DIFF.:COF DIFFERENCE BETWEEN TWO
CONTIGUOUS FLOOR MATERIALS.**P<0.01) ... 48
FIGURE 20MOTION OF COM IN MEDIAL-LATERAL DIRECTION ON PLANE WOOD AND PLANE WOOD TO PVC(YOUNG PARTICIPANTS).MOVING RANGE OF COM IN MEDIAL-LATERAL DIRECTION SLIGHTLY BUT SIGNIFICANTLY LARGER WHEN
WALKING ON PLANE WOOD COMPARED TO WALKING ON PLANE WOOD TO PVC. . 49
FIGURE 21MOTION OF COMY IN THE MEDIAL LATERAL DIRECTION ON PLANE WOOD AND FROM PLANE WOOD TO PVC(PARTICIPANT 1, FIFTY-TWO YEAR-OLDS MALE).
MOVING RANGE OF COM IN MEDIAL-LATERAL DIRECTION SLIGHTLY BUT SIGNIFICANTLY LARGER WHEN WALKING ON PLANE WOOD COMPARED TO
WALKING ON PLANE WOOD TO PVC. ... 50
FIGURE 22SCATTER-CHART OF PELVIC OBLIQUITY ANGLE AND MOTION OF COM IN THE MEDIAL-LATERAL DIRECTION.VALUE OF R2(0.041) SHOWS THAT THESE TWO VARIABLES HAVE LOW CORRELATION. ... 51
FIGURE 23SCATTER-CHART OF PELVIC ROTATION ANGLE AND MOTION OF COM IN THE MEDIAL-LATERAL DIRECTION.VALUE OF R2(0.1542) SHOWS THAT THESE TWO VARIABLES HAVE LOW CORRELATION. ... 51
FIGURE 24SCATTER-CHART OF PELVIC ROTATION ANGLE AND MOTION OF COM IN THE MEDIAL-LATERAL DIRECTION.VALUE OF R2(0.1557) SHOWS THAT THESE TWO VARIABLES HAVE LOW CORRELATION. ... 52
1
Introduction
1.1 Background
Fall related injuries are a serious public health issue in many countries all over the world (Lord, Ward, Williams and Anstey 1993; Kannus, Parkkari, Koskinen, Niemi, Palvanen, Jarvinen and Vuori 1999; Scuffham, Chaplin and Legood 2003). Falls could cause moderate to severe injuries such as bruises, hip fractures, or head traumas. Falls also generates psychological trauma and vast burden of health system. Falls not only reduce living independency, but also increase the risk of early death. In fact, falls are the most common cause of traumatic brain injuries (Jager, Weiss, Coben and Pepe 2000). As the population ages, fall accidents become more and more considerable affair we have to face.
In the United States, one-third of adults aged sixty-five years and older fall at least once each year (Hornbrook, Stevens, Wingfield, Hollis, Greenlick and Ory 1994; Hausdorff, Rios and Edelberg 2001). Falls in the home and community caused or led to 20,600 deaths in 2007. All age groups are vulnerable, but older adults are most at risk. The rates of fall-related deaths among older adults rose significantly over the past decade. Moreover, in the year of 2000, the direct medical cost totaled $0.2 billion ($197 million) for fatal falls and 0.19 billion for nonfatal fall-related injuries (Stevens, Corso, Finkelstein and Miller 2006). The annual cost of fall injuries is even expected to reach $54.9 billion by 2020 (Englander, Hodson and Terregrossa 1996). In Taiwan, accidental injury was the fifth leading cause of death from 1999 to 2006. According to the survey of Executive Yuan in 2005, falls were the second most common cause of unintentional injuries within the last three months, only inferior to traffic accidents. However, for people aged sixty-five years and older, falls are the most common cause (up to 72.8%) of unintentional injuries. Previous study also indicated that in Taiwan about one-fifth of adults aged
sixty-five years and above fall at least once each year and 44.4% of latest falls occurred at home (Directorate-General of Budget Accounting and Statistics 2007). Apart from the fall-related physical injuries and the vast burden to the health care system, falls also could generate psychological trauma. Many people, who experienced a fall, even a non-injury fall, develop fear of falling. The fear may cause them to limit their activities leading to reduced mobility and physical fitness, and increasing their risks of fall in the future (Vellas, Wayne, Romero, Baumgartner and Garry 1997). In a word, falls commonly occur at home, especially for people aged sixty-five years and above. Fall-related accidents could lead to both physical and psychological trauma, even death. Besides, the resultant medical cost is a heavy burden to the sufferers and the health care system.
In Taiwan, that population aged sixty-five years and above was more than 7% by 1993 (Directorate-General of Budget Accounting and Statistics 2007), which means that Taiwan has become an aging society since then, and is expected to be over 20% in 2026 (Department of Manpower Planning 2008). Therefore, fall-related injuries and resultant medical cost in people aged sixty-five and above would be a crucial concern. If we could reduce the occurrence of falls, fall-related injuries and health care expenses would inevitably diminish so does corresponding scocio-economic cost. Suitable living environments could prevent people from falls or slips and further guarantee their quality of life against the fall-related threats. Among the most important environmental factors related to falls are the frictional and material properties of the floor and shoes (Redfern, Cham, Gielo-Perczak, Gronqvist, Hirvonen, Lanshammar, Marpet, Yi-Chung Pai and Powers 2001; Cham and Redfern 2002). A study, about the circumstances of falls in the elderly in Taiwan in year 2005 and those in year 1999, indicates that about 40% of falls are caused by environmental factors, and within which the two most common factors are
slippery floor and obstacles on the ground (Tsai, Yeh, Lan, Chang and Tseng 2008).
In many industrial countries such as Taiwan, multiple floor materials are commonly used in living environments. Since frictional and material properties of the floor and shoes are important environmental factors of falls, many researches have studied the effects of floor materials on gait. However, floor transition (i.e. from one material to another) has been paid less attention, as well as resultant accidents. The understanding of floor transition is still insufficient and the effects of floor transition on locomotion and gait stability needs to be revealed more comprehensively. Therefore, we would like to investigate the influence of floor transition on gait stability in order to expand the knowledge in this field. Meanwhile, we expect the results of this study could provide a recommendation for people when choosing interior floor materials, which could practically avoid the transition-induced fall events
1.2 Objective
Falls are prominent among the external causes of unintentional injury and the frequency of falls increase with age and frailty level (World Health Organization 2008). In consideration of the increasing proportion of population aged sixty-five years and above in Taiwan, and the high ratio of fall-at-home events, we would like to improve home environment and make it safer and more suitable for all age. However, falls occur as a result of a complex interaction of risk factors which are usually categorized into four dimensions: biological, behavioral, environmental and socioeconomic factors. Factors related to the physical environment, such as floor materials, contaminants, are the most common causes of falls in older people, responsible for 30-50% of fall incidents (Rubenstein 2006). Furthermore, floor transition (for example: from living room to kitchen and from bedroom to bathroom) is a common yet frequently neglected
condition of indoor space when considering the factors of falls. Therefore, we want to reduce the floor material-induced fall risks. The purpose of this study is to examine the effect of floor transition on gait stability.
Many studies have used the motion of whole-body center of mass, center of pressure (COP) under feet and the interaction between the two variables to describe the gait stability (Jian, Winter, Ishac and Gilchrist 1993; Mackinnon and Winter 1993; Prince, Winter, Stergiou and Walt 1994; Winter 1995; Krebs, Jette and Assmann 1998; Polcyn, Lipsitz, Kerrigan and Collins 1998; Tucker, Ramirez, Krebs and Riley 1998; Chou, Kaufman, Brey and Draganich 2001; Hof, Gazendam and Sinke 2005; Lee and Chou 2006; Parker, Ostering, Van Donkelaar and Chou 2006). Nonetheless, this method needs enormous anthropometry database and reconstruction of three-dimensional multiple segment biomechanical models as well. The complexity of calculation and high technical skill it needs may limit the practical utility of COM in evaluating the stability (Hahn and Chou 2003). Consequently, in addition to observing gait, we expect to find out other kinematics or kinetics variables that could efficiently represent the stability of locomotion without complicated calculating process.
1.3 Hypothesis
In order to examine the effect of floor material change on gait and gait stability, we first measure coefficient of friction (COF) of several commonly-used interior floor materials in Taiwan and then observe the locomotion on different floor material conditions. The kinematics variables of gait will be analyzed and the relationship between these variables and COM will then be examined. The research questions and hypotheses are listed below:
A. Does floor transition have any effect on gait stability?
We hypothesized that floor materials change would decrease the stability of locomotion.
B. If floor transition has effects on gait stability, does gait stability have positive/negative relationship with the difference of COF between two transition floor materials?
We hypothesized that the difference of COF between two connected floor materials has negative relationship with gait stability. Moreover, when the COF difference reaches a certain level, the risk of falls during walking would increase significantly.
C. Are there any age differences on movement adjusting strategy when encounter a floor transition condition?
We hypothesized that the elderly would need more time to adjust their gait and would start the adjustment earlier then young adults. Furthermore, they could only adjust their gait successfully within a lesser range of COF difference.
D. Is there any kinematics variable besides the whole-body COM that could be used to indicate gait stability?
We hypothesized that pelvic motion could be used for indicating the stability of locomotion.
2
Literature Review
2.1 Fall-related socioeconomic costs
Falls are a major cause of injuries at workplace, in public places and at home. A fall is often defined as inadvertently coming to rest on ground or other lower level, excluding intentional change in position to rest in furniture, wall or other objects. Approximately 28-35% of people aged sixty-five years and above fall each year (Campbell, Reinken, Allan and Martinez 1981; Prudham and Evans 1981; Blanke and Hageman 1989) increasing to 32-42% for those aged seventy years and above (Tinetti, Speechley and Ginter 1988; Downton and Andrews 1991; Stalenhoef, Diederiks, Knottnerus, Kester and Crebolder 2002). The frequency of falls increases with aged and frailty level (World Health Organization 2008).
The rate of hospital admission due to falls for people aged sixty years and above in Australia, Canada and the United Kingdom of Great Britain and Northern Ireland (UK) range from 1.3 to 3.0 per 10,000 populations. Fall injury rates resulting in emergency department visits of the same age group in Western Australia and in the United Kingdom are higher: 5.5-8.9 per 10,000 populations. Falls also lead to 20-30% of mild to severe injuries, and are underlying cause of 10-15% of all emergency department visits (Scuffham, Chaplin and Legood 2003). Furthermore, falls represented more than 50% of injury-related hospitalizations for people aged sixty-five years and above (Scott, Pearce and Pengelly 2005). The major underlying causes for fall-related hospital admission are hip fracture, traumatic brain injuries and upper limb injuries. With the increasing age and frailty level, elders are likely to remain in hospital for the rest of their life after sustaining a fall-related injury.
The economic impact of falls is critical to family, community, and society. Healthcare impacts and costs of falls in older age are significantly increasing all
over the world. The average health system costs per fall injury episode for people aged sixty-five years and above in Finland and Australia was US$ 3611 and US$ 1049 respectively (Nurmi and L Thje 2002; Hendrie, Hall, Arena and Legge 2004). In addition to the substantial direct costs, falls incur indirect costs are critical to family e.g. the loss of productivity of family caregivers. The average lost earnings could approximate US$ 40,000 per year in the United Kingdom (Herman, Gallagher and Scott 2006). Even when family caregivers are more morally and culturally accepted, falls remain a significant burden to household economy.
Worldwide, the number of people over sixty-year-olds is growing faster than any other age groups. The number of this age group was estimated to be 688 million in 2006, projected to grow to almost two billions by 2050. Falls prevention, therefore, is a challenge to the aging population. The numbers of falls increase in magnitude as the numbers of older adults increase in many nations throughout the world (World Health Organization 2008).
In Taiwan, an analysis of the most recent types of accidental injuries occurring to people from age fifteen years and above in the period from June to September of 2005, revealed falls as the secondary common type of accidents, occurrence rate being 1.85%; the ratio increased by 0.57% compared to the statistics of four years ago. A further study by age groups revealed that the highest fall accident ratio (4.07%) occurred among senior citizens, aged sixty-five years and above, and this ratio is significantly higher than the ratios of other age groups (Directorate-General of Budget Accounting and Statistics 2005). People among age 12-64 years old, 5.6% of them reported having injurious falls (Tsai, Yeh, Lan, Chang and Hurng 2008). For older adults, the prevalence of falls is 10.7-20.5% (Tsai, Chou and Liou 1997; Bureau of Health Promotion 2007). Moreover, among the elderly who fall, 53.9% suffer moderate injuries and 27.3% suffer severe injuries (Leung, Chi, Hu and Lin 2005).
2.2 Falls and slips
Causes of falls are complex involving environmental and human factors. Environmental factors include characteristics of walking surfaces, shoes, contaminants, evaluations, steepness of an incline, lighting condition and floor compliance. Human factors include sensory capabilities, biomechanics, neuromuscular control and information processing (Hanson, Redfern and Mazumdar 1999). Many causes and patterns have been identified for fall accidents. A previous study reported that the most common precipitating event leading to a fall is a loss of traction (i.e., slip) between the shoe sole and floor materials, followed by trips, missteps, loss of support, and postural overextension. Therefore, slipperiness of a walking surface is often a key consideration in a slip-and-fall accident investigation and resulting litigation (Lin, Chiou and Cohen 1995).
Theoretically, slip occurred because the friction at the shoe-floor interface is insufficient. As long as the available local friction exceeds the required friction, the pedestrian should not slip. Foot forces normally generated during gait require friction to counteract the shear forces to prevent a slip. When the available friction at the shoe-floor interface cannot meet the biomechanical requirements, slips become imminent, possibly resulting in an injury (Hanson, Redfern and Mazumdar 1999). The friction at the shoe-floor interface derives from two coefficients: static coefficient of friction (SCOF) and dynamic coefficient of friction (DCOF). Compare to some studies indicate that DCOF is the crucial factor of fall event (Andres and Chaffin 1985) others believe SCOF is a better indicator of fall since SCOF decides the occurrence of slips (Perkins 1978).
Besides friction, ratio of horizontal (H) and vertical (V) component of foot contact force is another common indicator, the ratio (H/V) is also called require
coefficient of friction (RCOF). It represents the minimum coefficient of friction at shoe-floor interface that is needed to prevent a slip. The results of Hanson et al. (1999) indicate that the relationship between the frictional requirements of walking and measured friction of shoe-floor-contaminant interface can be utilized to predict slips and falls. The results showed the number of slip and fall events increased as the difference between the required COF and the measured DCOF increased. A high H/V value indicates where a slip is most likely to occur. In Strandbefg and Lanshammer’s (1981) and James’ (1983) studies, they recorded a high H/V value shortly after heel contacts the ground during landing. A serious backward fall in which the buttocks strike the ground is usually the consequence due to the continuous forward momentum being applied to the slipping foot. They also noticed a high H/V value during the take-off phase when the foot slipped backward. Such a slip tends to produce a forward fall (Strandberg and Lanshammar 1981; James 1983).
2.3 Effects of floor surface on gait characteristics
Mobility is defined as the ability to independently and safely move oneself from one place to another, and it is an extraordinarily complex behavior (Shumway-Cook and Woollacott 2006). Usually, human gait could be subdivided into a stance phase, which starts when the foot strikes the ground, and a swing phase, which begins when the foot leaves the ground, and described with reference to different aspects of the gait cycle. At freely chosen walking speeds, adults typically spend approximately 60% of the cycle duration in stance, and 40% in sing.
To reach a successful locomotion needs three essential requirements: progression, postural control, and adaptation (Das and Mccollum 1988; Patla 1991). Progress is ensured through a basic locomotor pattern that produces and coordinates rhythmic patterns of muscle activation in the legs and trunk that
successfully move the body in the desired direction. It also requires the ability to initiate and terminate locomotion (Patla 1997). The requirement for postural control reflects the need to establish and maintain and appropriate posture for locomotion, and the demand for dynamic stability of the moving body. The adaptation ability could meet the goals of the individual and the demands of the environment. Successful locomotion in challenging environments requires gait patterns to be adapted in order to avoid obstacles, negotiate uneven terrain, and change speed and direction as needed. There are two ways to control the equilibrium during locomotion – reactively and proactively. One is to use reactive mode when there is an unexpected disturbance, such as a slip or a trip; and the other is to use proactive dome to anticipate potential disruptions to gait and to modify the way to sense and move in order to minimize the disruption.
Normally, encounter an unexpected slippery floor (i.e., spilled water or other contamination) would cause curtail stance phase, smaller step length, and slower heel contact speed (Cham and Redfern 2002). Research has shown if we gave multiple slip perturbations, young adults adapt their strategy of recovery. On the first slip individuals used a rapidly activated flexor synergy. With repeated slips, individuals modified the strategy, using a more flat-footed landing, a shift of the medial-lateral center of mass closer to the support limb at foot contact with the rollers (Marigold and Patla 2002). For the situation that subjects known in advanced of a possible hazard, Cham and Redfern (2002) found that the strategies of dealing with slippery floors were altered. The results showed that if individuals anticipated a slippery surface, they produced peak required coefficient of friction values which were 16 to 33% less than during baseline conditions, in order to reduce the potential for a slip. This was accomplished by reductions in stance duration and loading speed on the supported foot, taking shorter stride lengths, and using a lower angular velocity at heel strike.
2.4 Age-related effects on gait characteristics
Falls and fall-related injuries are often companied with a serious of physical and psychological problems in the older adults. Moreover, falls often happened when elders are walking. Age-related change in locomotion may be due to primary or secondary aging phenomena. Primary factors of aging include changes in gene expression that result in changes in hormonal function, aging and death. Secondary factors are experiential, and include nutrition, exercise, stress level, and acquired pathologies, among others.
The earlier clinical literature referred to many different walking patterns as age-related gait disorders. These diverse gait disorders included: gait apraxia (slow, haling, short-stepped, shuffling or sliding gait), hypokinetic-hypertonic syndrome (slow, deliberate gait, but without the shuffling or sliding components described above), and marche à petits pas (small, quick shuffling steps, followed by a slow cautious, unsteady gait), vestibular dysfunction gait (difficulties in turning), and proprioceptive dysfunction gait (cautious, with a tendency to watch the feet and make missteps) (Craik 1989) Some studies reported that there is a decrease in walking velocity, step length, and step rate for elder compared to young subjects (Drillis 1961; Molen 1973). Other researchers also observed a shorter but broader stride dimensions and increased stance phase (Murray, Kory and Clarkson 1969; Winter, Patla, Frank and Walt 1990), and heel contact velocity when comparing gait in older with that in younger adults (Lockhart, Woldstad and Smith 2003). The increased heel contact velocity would cause lager horizontal ground reaction force thus increased the RCOF and risks of falls (Lockhart and Kim 2006). Furthermore, vertical movement of the head during the gait cycle was smaller, while lateral movement was larger; stride width tended to be wider for men over seventy-four years old. Hip, knee, and ankle flexion of older adults were less than those of younger adults, and the whole shoulder rotation pattern was shifted to a more extended position with less
elbow rotation. Those gait patterns adapted with aging are similar to those used by someone walking on a slippery surface or in darkness.
Muscle activation patterns also have some age-related changes. Muscle activity levels in gastrocnemius, tibialis anterior, biceps femoris, rectus femoris, and peroneus logus during level walking were higher in the older than the younger age group (Finley, Cody and Finizie 1969). There were also changes in the activity of individual muscles at specific points in the step cycle. For example, at heel strike the peroneus logus and gastrocnemius muscles are moderately to highly active in older women, but showed little or no activity in a younger group. The increase of muscle activity resulted from the effort made to improve stability during the stance phase of gait. However, Winter and colleagues (1990) found that the elders showed a reduced ability to co-vary movements at the hip and knee.
Besides age-related gait change, proactive adaptive strategies during gait in elders also have some differences with young adults. Moreover, poor recovery ability in elder is another reason of higher risks of falls (Simoneau, Cavanagh, Ulbrecht, Leibowitz and Tyrrell 1991). A study by Patla et al. (1991) indicated that compared to young adults, elders had more difficulty in shortening a step and may need to begin making modifications to gait patterns in the step prior to a step requiring obstacle avoidance.
2.5 Analysis of gait stability
Kinematics, kinetics and temporal-distance variables are usually-used to analyze human locomotion. Kinematics variables include trajectory, velocity, acceleration of segments, angle, angular velocity, angular acceleration between segments, and center of mass. Kinetic data includes ground reaction forces which are obtained from force platforms, joint forces, joint moments, and joint torques. The spatial-distance variables include walking velocity, step length, step
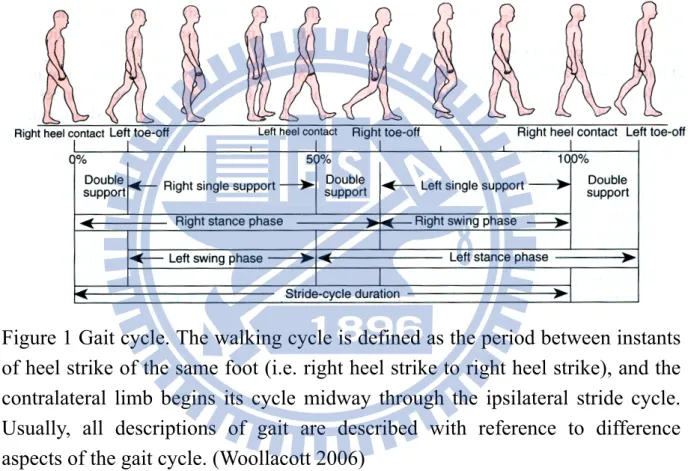
width, cadence, and proportions of each phase in gait cycle. Traditionally, all descriptions of gait, whether kinematics, electropyography (EMG), or kinetics, are described with reference to different aspects of the gait cycle (Shumway-Cook and Woollacott 2006). The gait cycle consists of stance phase and swing phase, the first and the last 10% of the stance phase are spent in double support-the period of time when both feet are in contact with the ground (see Figure 1).
Figure 1 Gait cycle. The walking cycle is defined as the period between instants of heel strike of the same foot (i.e. right heel strike to right heel strike), and the contralateral limb begins its cycle midway through the ipsilateral stride cycle. Usually, all descriptions of gait are described with reference to difference aspects of the gait cycle. (Woollacott 2006)
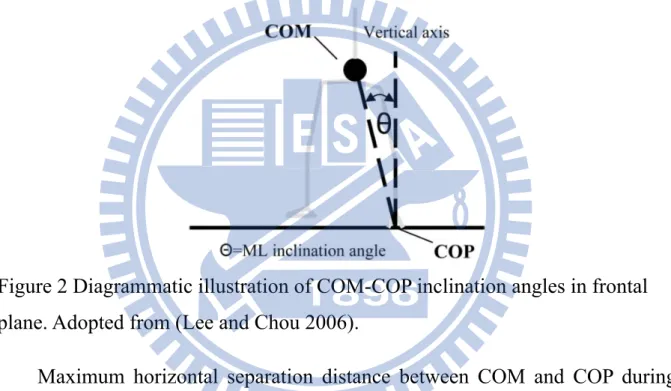
When evaluate gait stability or dynamic balance, some studies used three-dimensional COM motion to estimate the gait stability and some used the COM and center of pressure (COP) inclination angle (Figure 2). Many studies have used the whole body COM motion and its relative position to the COP of the supporting foot to examine gait stability (Jian, Winter, Ishac and Gilchrist 1993; Mackinnon and Winter 1993; Prince, Winter, Stergiou and Walt 1994; Winter 1995; Kaya, Krebs and Riley 1998; Polcyn, Lipsitz, Kerrigan and Collins
1998; Tucker, Ramirez, Krebs and Riley 1998; Chou, Kaufman, Brey and Draganich 2001). Mackinnon and Winter (1993) further demonstrated that the differences in COM and COP locations in the fontal plane provide a valuable means for defining dynamic stability. Results of H. Lee and L. Chou’s study (2006) showed that instantaneous COM-COP inclination angles during walking provide information about the ability to control COM position in relation to corresponding COP. Besides, the medial COM-COP inclination angle may be a sensitive measure of gait stability in the elderly.
Figure 2 Diagrammatic illustration of COM-COP inclination angles in frontal plane. Adopted from (Lee and Chou 2006).
Maximum horizontal separation distance between COM and COP during single limb stance was reported to sensitively quantify gait instability in patients with bilateral vestibular hypofunction or cerebellar ataxia (Krebs, Gill-Body, Riley and Parker 1993; Krebs, Mcgibbon and Goldvasser 2001). Dynamic stability during locomotion has been assessed using COM momentum, and an excessive lateral momentum was identified in balance-impaired elderly (Kaya, Krebs and Riley 1998). Some studies also demonstrated that linear measures of COM motion in the frontal plane during obstacle crossing could better distinguish elderly subjects with balance disorders from their age-matched healthy peers (Chou, Kaufman, Hahn and Brey 2003; Hahn and Chou 2003;
Hahn and Chou 2004).
COM motion and its relative position to the COP from supporting foot have been used to examine gait stability commonly, yet the complex technical requirement may restrict the applicability of assessing dynamic instability via the whole body COM motion. Some studies tried to use other variables as dynamic stability references during gait. M. Hahn and L. Chou (2006) used medio-lateral (M-L) motion of individual body segments to identify dynamic instability in the elders and compare the results with whole COM motion. Nevertheless, the results showed that COM motion allows more sensitive detection of dynamic instability.
3
Materials and Methods
3.1 Participants
A total of five healthy young adults, one fifty-two years-old male and one seventy-one years-old female were recruited in this study. The young participants (23-27 years old, 1.67±0.12m, and 74.10±14.57kg) were recruited from the general student body on the campus of National Chiao Tung University. The older participants (1 male and 1 female) who can walk at least 300 meters without assistance were recruited from local community dwelling in Hsinchu city. Participants with history of neurological, muscle skeletal or orthopedic diseases and any difficulties might obstruct normal locomotion, such as rheumatoid arthritis and cartilage or ligament injury of lower limbs, would be eliminated. Moreover, all subjects have no history of falls in the past year or other balance-related disorders. Prior to participating in the experiment, to ensure the physical condition and consistency of balance control ability of older subjects, we used and Berg balance scale (Berg, Maki, Williams, Holliday and Wood-Dauphinee 1992; Berg, Wood-Dauphinee, Williams and Maki 1992) as an initial screening tool. Bogle Thorbahn and Newton (1996) examined the Berg Balance Test and found that 45 was a generalized cutoff score to predict falls in older adults. In addition, results of Lee and Chou’s study (2006) revealed that healthy elders scored 54 or higher. Therefore, we used 54 as the cutoff score for our study. Only those who achieved the Berg balance scale 54 out of 56 were selected. Detailed information of each participant is listed in Table 1.
Each participant was fully notified and understood the purpose and experimental protocol of this study, and then completed an informed consent procedure approved by Taipei Veterans General Hospital Institutional Review Board (IRB) prior to the experiment. Subject who was not willing to subscribe the consent or could not accomplish whole experiment would be excluded.
Entire experiment was completed in the Biomechanics and Medical Application Laboratory, Department of Mechanical Engineering, National Chiao Tung University.
Table 1 Participant characteristics.
Participant Gender Age Stature Mass Berg Balance Scale
No. (years) (m) (kg) 1 M 52 1.70 78.0 54 2 F 71 1.50 42.0 54 3 M 24 1.75 85.0 — 4 M 23 1.78 77.0 — 5 M 23 1.74 83.5 — 6 F 22 1.53 49.0 — 7 F 27 1.55 76.0 — 3.2 Experimental Protocol
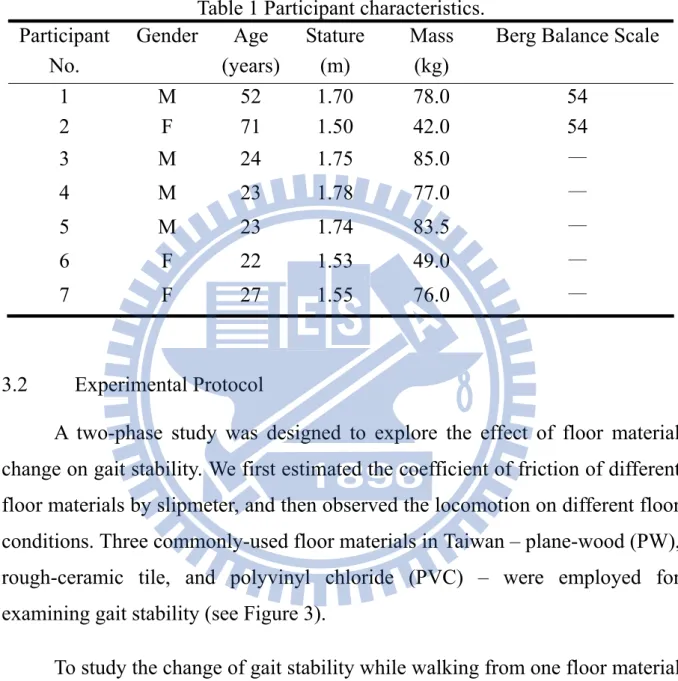
A two-phase study was designed to explore the effect of floor material change on gait stability. We first estimated the coefficient of friction of different floor materials by slipmeter, and then observed the locomotion on different floor conditions. Three commonly-used floor materials in Taiwan – plane-wood (PW), rough-ceramic tile, and polyvinyl chloride (PVC) – were employed for examining gait stability (see Figure 3).
To study the change of gait stability while walking from one floor material to another, we used different combinations of the above-described floor materials to created consistent conditions (same floor materials on the whole walkway) and transition conditions (from one material to another) of walkway. Altogether seven floor conditions were executed in our study, consisting of two consistent conditions and five transition conditions.
Figure 3 Experimental floor materials – Plane-wood (top), PVC (bottom left) and Rough-ceramic tile (bottom right).
We used the consistent condition as the baseline for comparing the change of gait stability after transition. In consistent condition, the whole walkway was covered with same floor materials. We used plane-wood and rough-ceramic in consistent condition. In transition condition, walkway was cover with 2 different floor materials that have different coefficient of friction. As shown in Figure 4, the first half of the walkway was covered with material A, and the force plates and the second half of the walkway was covered with material B. Transition condition in our study were: plane-wood to PVC, rough ceramic to PVC, PVC to plane-wood, PVC to rough-ceramic and dry to water-spilled rough-ceramic. Two force platforms (Bertect 4060, Bertect Corporation, Columbus, Ohio, USA) were placed underneath the middle of the walkway right after the interface of two floor materials in the transition conditions.
Figure 4 Disposal of floor materials in transition condition of the experiment. First half of the walkway use one floor material (A), force plates and second half of the walkway use another floor material (B) with different coefficient of friction.
3.2.1 Apparatus
3.2.1.1 Three-dimensional motion analysis system
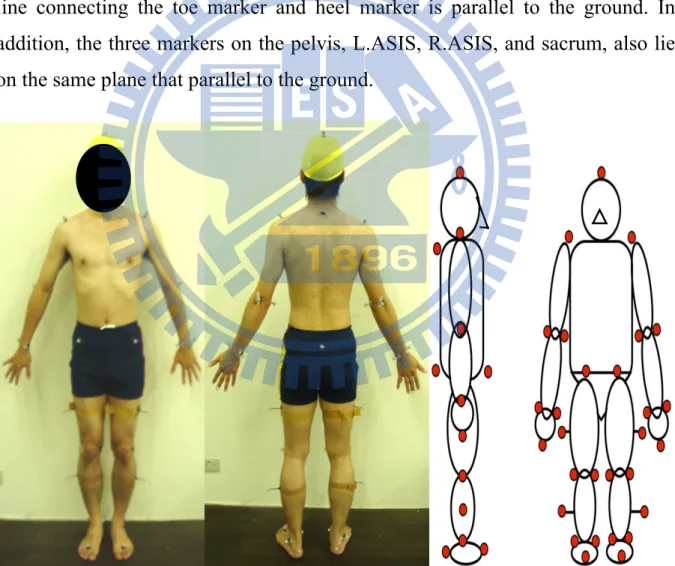
We used an eight-camera motion capture system (BTS Bioengineering, Garbagnate Milaness, Italy) with sampling rate 250Hz to obtain three-dimensional (3D) kinematics and kinetics data of whole body during gait on different floor conditions. Thirty-three 15mm-diameter reflective markers were placed on the bony landmarks of the subject. The marker set system described here was designed with a minimum of markers to simplify the identification of marker trajectories. Positions of reflective markers were based on the Helen-Hayes marker set (Kadaba, Ramakrishnan and Wootten 1990) with seventeen additional markers. The Helen Hayes marker set consists of 15 lower body markers, marker positions are specified as follows: left anterior superior iliac spine (L.ASIS), left thigh (L.TH), left lateral femural epicondyle (L.LFE), left shank(L.SK), left lateral malleolus (L.LM), left third metatarsal head (L.TE), left heel (L.HL), and sacrum. The seventeen additional markers are: left acromion end (L.AC), left olecranon process (L.OP), left lateral epicondyle (L.LE), left radial styloid process (L.RS), left ulnar styloid process (L.US), left end of middle finger (L.MI), left medial epicondyle of the femur (L.ME), left
medial malleolus(L.MM), head and the seventh cervical vertebral bone (C7). For left side markers only are listed, the position is identical for the right side (see Figure 5).
Each of the thigh and shank markers has a 50mm wand, protruding from the lateral aspect of the thigh and shank, attached for measuring the 3D motion of the leg. For thigh marker, it lies in the plane that contains hip and knee joint centers and FE marker. The shank marker lies in the plane that contains the LEF and lateral malleolus. Moreover, heel marker lies in the same height above the plantar surface of the foot, as the second metatarsal head marker such that the line connecting the toe marker and heel marker is parallel to the ground. In addition, the three markers on the pelvis, L.ASIS, R.ASIS, and sacrum, also lie on the same plane that parallel to the ground.
Figure 5 Marker set placement. This study use modify Helen Hayes marker set (Kadaba, Ramakrishnan and Wootten 1990) with 17 additional markers.
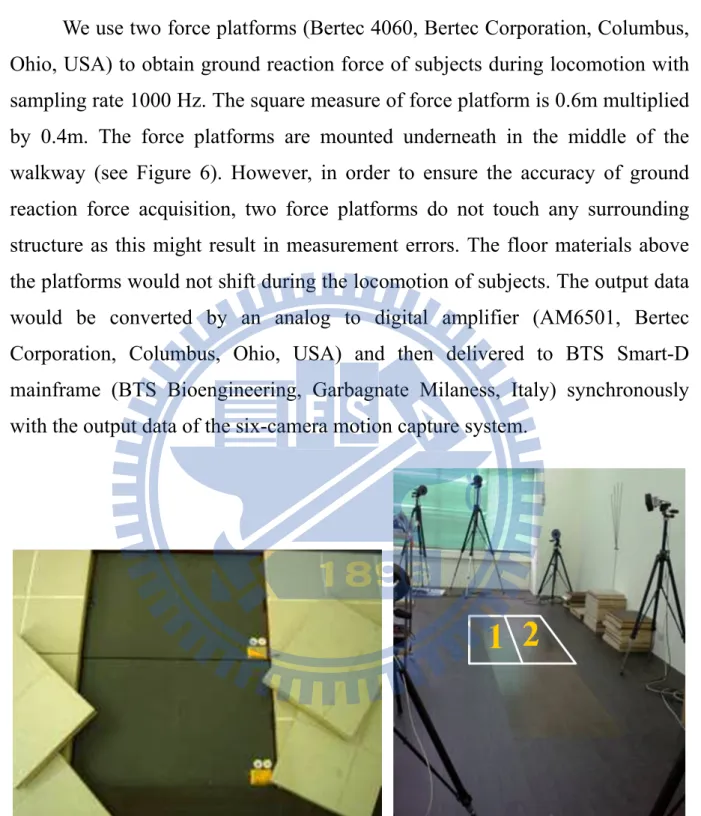
3.2.1.2 Force platform
We use two force platforms (Bertec 4060, Bertec Corporation, Columbus, Ohio, USA) to obtain ground reaction force of subjects during locomotion with sampling rate 1000 Hz. The square measure of force platform is 0.6m multiplied by 0.4m. The force platforms are mounted underneath in the middle of the walkway (see Figure 6). However, in order to ensure the accuracy of ground reaction force acquisition, two force platforms do not touch any surrounding structure as this might result in measurement errors. The floor materials above the platforms would not shift during the locomotion of subjects. The output data would be converted by an analog to digital amplifier (AM6501, Bertec Corporation, Columbus, Ohio, USA) and then delivered to BTS Smart-D mainframe (BTS Bioengineering, Garbagnate Milaness, Italy) synchronously with the output data of the six-camera motion capture system.
Figure 6 Force platforms are mounted underneath in the middle of the walkway, and covered by the experimental floor materials.
3.2.1.3 Slipmeter
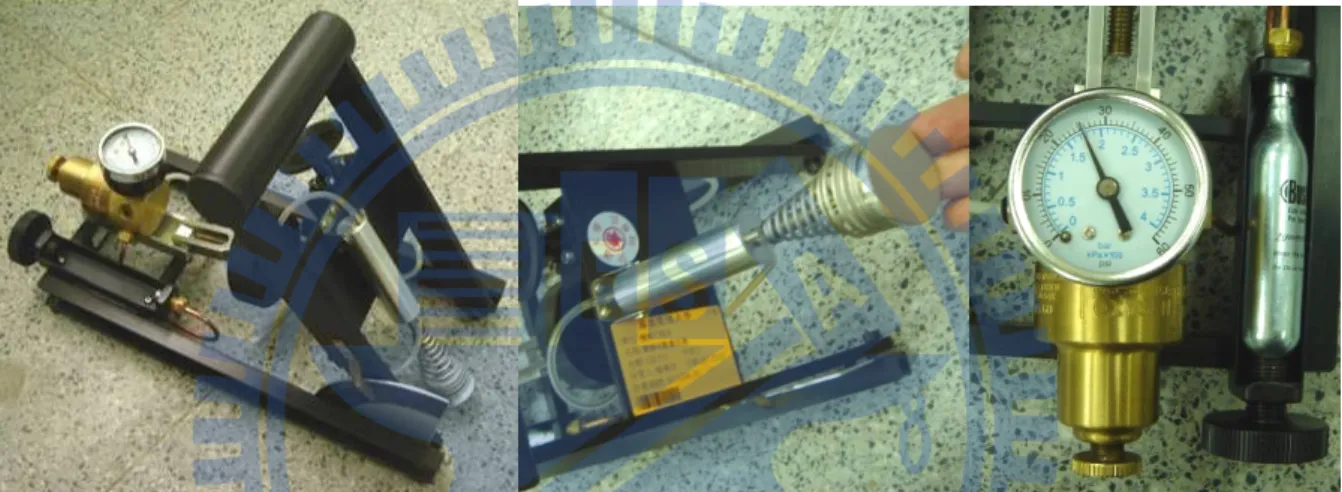
For the coefficient of friction of the floor materials, a slipmeter (English XL, William English, Inc., Alva, Florida, USA) is used to obtain the data.
English XL variable incidence tribometer is self-powered by a miniature CO2 cylinder, and operating pressure of 172kPa (25 psi) is set (see Figure 7). Before testing, we use a 180 silicon carbide paper with a hard backup to sand the Neolite testfoot pad (see Figure 7). In addition, we re-sand the pad after each slip when testing dry surface. We test the floor materials in each surface orthogonally and use the average number to obtain a net result for that panel. If there was variability of results, we would take more than four readings on each spot and average for an acceptable confidence factor.
Figure 7 Slipmeter: English XL (left), Neolite testfoot pad (middle), maintain the working pressure at 172kPa (25 psi, right).
3.2.1.4 Anthropometric measuring tools — weight scale, pelvimeter, tape measure
Before the experiment, we had to measure some anthropometric parameters that were requested for the later data analysis. For the anthropometric parameters, we include height, weight, pelvis width, pelvis depth, knee diameter, ankle diameter, leg length, thigh length, calf length, ankle height, thigh circumference, and calf circumference. We must measure both side of all parameters, except pelvic width. Detailed measure and the purpose of above parameters are expounded as follow:
center and against the back and base of the wall. We make sure their legs are straight; heels and calves are against the wall, shoulders are level and hands are at their side. We asked the participant to look straight ahead, and the head, shoulder blades and buttocks are against the wall ower their headpiece on top of the participant’s head, read and record the measurement to the nearest 1mm.
B. Weight: Adjust the weight scale to zero before measurement. Let participant take off their shoes and other heavy objects within the pockets. Minimizing the clothes on the participant. Read and record the weight to the nearest 0.1 kg.
C. Pelvis width: Let participant lay down horizontally, keep feet apart at shoulder width. Use pelvimeter to measure the distance between left and right ASIS.
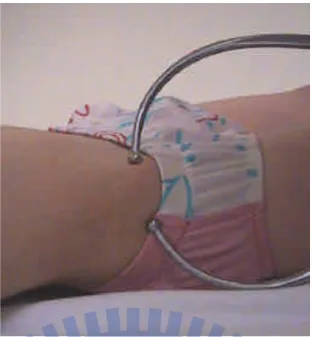
D. Pelvis depth: Let participant lay down horizontally. Use pelvimeter to measure the vertical distance between ASIS and the horizontal of ipsilateral greater trochanter of the femur (see Figure 8).
E. Knee diameter: Let the participant lay down horizontally. Use pelvimeter to measure the distance between lateral and medial epicondoye.
F. Ankle diameter: Let the participant lay down horizontally. Use pelvimeter to measure the distance between lateral and medial malleolus.
G. Leg length: Let the participant lay down horizontally. Use the tape to measure the distance between ASIS and ipsilateral lateral malleolus.
Figure 8 Measurement of anthropometry data: pelvic depth. Measure the vertical distance between ASIS and the horizontal of ipsilateral greater trochanter of the femur.
H. Thigh length: Let participants lay down horizontally. Use the tape to measure the distance between greater trochanter of the femur and ipsilateral lateral femural epicondyle.
I. Calf length: Let participants lay down horizontally. Use the tape to measure the distance between lateral femural epicondyle and ipsilateral lateral malleolus.
J. Ankle height: Let participants stand with barefoot and legs shoulder-width apart. Make sure their legs are straight. Use the tape to measure the height from lateral malleolus to the ground.
K. Thigh circumference: Let participant stand on their foot. Ask participants to remove clothing that may cover their thigh and keep their leg straight. Calculate the lower 1/3 of the thigh and wrap the tape around the thigh at midpoint. We make sure the tape is flat around the skin and inspect the tension of the tape on the participant’s arm. When the tape is in the correct position on the thigh with the correct tension, read and record the
measurement to the nearest 1mm.
L. Calk circumference: Let participants stand on their foot. Ask participant to remove clothing that might cover the calf and keep their leg straight. Calculate the lower 1/3 of the calf and wrap the tape around the thigh at midpoint. Make sure the tape is flat around the skin and inspect the tension of the tape on the participant’s arm. When the tape is in the correct position on the calf with the correct tension, read and record the measurement to the nearest 1mm.
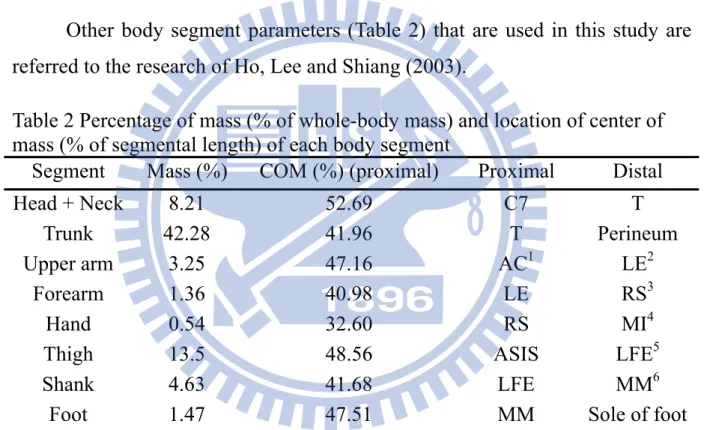
Other body segment parameters (Table 2) that are used in this study are referred to the research of Ho, Lee and Shiang (2003).
Table 2 Percentage of mass (% of whole-body mass) and location of center of mass (% of segmental length) of each body segment
Segment Mass (%) COM (%) (proximal) Proximal Distal
Head + Neck 8.21 52.69 C7 T
Trunk 42.28 41.96 T Perineum
Upper arm 3.25 47.16 AC1 LE2
Forearm 1.36 40.98 LE RS3
Hand 0.54 32.60 RS MI4
Thigh 13.5 48.56 ASIS LFE5
Shank 4.63 41.68 LFE MM6
Foot 1.47 47.51 MM Sole of foot 1 Acromion, 2 Lateral Epicondyle, 3 Radial Stylord Process, 4 End of Middle Finger, 5 Lateral Femural Epicondyle, 6 Medial Malleolus.
3.2.2 Experimental procedure
The experiment of this study consisted of two parts, one is to measure the coefficient of friction (COF) of floor materials, and another is to observe gait stability on different floor conditions. Process of measuring COF of different floor materials is listed as Figure 9.
Figure 9 Flowchart of measuring the coefficient of friction of floor materials.
Before testing, we first clean up the experimental floor materials, and then prepare the Neotile testfoot by sanding the pad with the shoe mounted on the foot in a circular motion five cycles using 180 silicon carbide paper with a hard backup. When testing, verify the working pressure at 172kPa (25 psi) and then place the instrument down on the test surface. Begin with the mast in a more vertical position and work progressively toward the higher numbers after each stroke. We test the floor materials in each surface orthogonally and use the average number to obtain a net result for that panel. If there is variability of results, we would take more than four readings on each spot and average for an acceptable confidence factor. When testing dry surface, we re-sand the pad after
Clean up the test surface.
Polish the testfoot pad and brush the dust off.
Verify the working pressure at 172kPa (25psi).
Start in a less vertical position.
Measurement of the slip index
Record the data and key in to Excel
each slip and only sand the pad before start for wet testing. In addition, when testing water-spilled surface, we re-wet the test spot after each stroke.
Procedure of observing gait stability on different floor conditions is as follows (see Figure 10). In order to ensure the output signal of force platforms is steady, the platform should start at least thirty minutes before experiments begin, and then we acquire the calibration of motion capture system and force platforms. After participants arrive, we explain the objective of the study and experimental procedure. If participants fully understand the contents and agree with it, then an informed consent procedure approved by Taipei Veterans General Hospital IRB would be completed. Following, anthropometry parameters would be measured and thirty-three reflective markers would be attached to the bony landmark of participants.
After all the markers are attached, we ask subjects to walk on a 6-m long and 0.8-m wide walkway with barefoot at their prefer speed to get familiar with the experimental surroundings. Meanwhile, executor counts the average cadence (step/min) of the subjects and make sure we capture every reflective marker. The own average cadence would be used as a standard cadence of the experiment for each subject. To help participants maintain constant cadence, they would hear a metronomic beep when they walk through each trail of each floor condition. The start line should be at least 3.0m distant from the force platform to the effect that participants’ locomotion is stable.
Figure 10 Flowchart of gait stability experiment.
For retaining the nature gait character of each subject, participants do not be informed that they should have their whole step on the force platform. Instead, staffs would instruct them in adjusting the start point and make sure the integrity and validity of force platform data in every trial. The test order of the floor conditions is randomized. There are seven conditions for young adults and six conditions for elders, and each condition would repeat twenty times. Before every trial, we set the force platforms to zero, and assure the reading is zero. For reducing the possible potential fatigue effects, subjects might take a three to five minutes rest between each condition while staff replacing the experimental floor materials of the walkway. Data acquisition would start five seconds before
Calibrations of motion capture system and force platforms.
Explain the experimental procedure and
complete the informed consent
Measure the anthropometry data.
Decide the standard cadence.
Complete each condition with random order.
Record the data and analyze with Smart-D
participants begin walking, and collect synchronized with force platforms.
3.3 Data analysis
In this study, link-segment model is used to calculate the kinematics variables such as joint angle and required coefficient of friction (RCOF). We use BTS smart-D system (BTS Bioengineering, Garbagnate Milaness, Italy) and Matlab 7.0 (MathWorks Inc., USA) to accomplish the calculation. In addition, we use Microsoft® Office Excel 2003 (Microsoft Corporation, USA) to plot the bar chart and scatter diagram for showing the tendency of the data, and to do all the statistical analysis.
3.3.1 Definition and calculation of variables 3.3.1.1 Marker set system
Link-segment model assumes that human body is linked by many rigid body segments. In our study, the lower part of human body is constructed by seven segments including pelvic, left thigh, right thigh, left calf, right calf, left foot and right foot. The upper part is constructed by eight segments including head, trunk, left upper arm, right upper arm, left forearm, right forearm, left hand and right hand. We use a simple yet rigorous enough marker system with thirty-three reflect markers to define these body segment and obtain the relative motion of the rigid body segments in three dimensions. The relationship between marker set and the segment is as following depictions:
A. Head is defined by markers at T, L.AC, and R.AC.
B. Trunk is defined by markers at C7, L.AC, and R.AC.
C. Upper arm is defined by markers at AC, LE, and OP.
E. Hand is defined by markers at RS, US, and MI.
F. Pelvic is defined by markers at L.ASIS, R.ASIS, and sacrum.
G. Thigh is defined by markers at ASIS, THI, and LFE.
H. Shank is defined by markers at LFE, ME, SK, LM, and MM.
I. Foot is defined by markers at L.TO, HL, LM, and MM.
3.3.1.2 Joint center and local coordinate system
We use the concept of local axes and Euler rotation angles to define the three-dimensional joint angle motion based on the set of body surface markers. In order to calculate the relative Euler angles, we need to define a set of orthogonal local axes both in the moving segment as well as in the reference segment. The sections that follow describe the details associated with the determination of the local coordinate systems, the joint center locations, and the joint angles.
A The global coordinate system
Before participants enter the laboratory, we finish the procedure of calibration and setup a global coordinate system. The calibration is divided into two parts: one is static calibration another is dynamic calibration. Static calibration is used to establish the origin and direction of global orthogonal coordinate. We accomplish it by using reference frame to acquire position and fixing the hinged axis in the correct corner of the force-platform. After build up the coordinate system, we need dynamic calibration to calculate the relative position and orientation of the eight cameras. By doing this, we reconstruct 2-Dimension data from each camera and obtain the 3-Dimension data. The global coordinate system(X, Y, and Z), defined here, the Z axis is along the walkway, the Y axis is the vertical pointing upwards, and the X axis is
perpendicular to both X and Z directions, forming a right-handed Cartesian coordinate system.
B Define joint center
We first use thirty-three reflective markers to define the orientation and direction of seven segments of lower body parts and eight segments of upper body parts in the global coordinate system. And then combine it with anthropometric data to calculate joint center of rotation, which is assumed as a fixed point on the proximal segment during the rotation. These joint centers of rotation and reflective markers are not only orientated by global coordinate system, also construct the embedded coordinate system and each corresponding segment.
i Hip joint center
An empirical relation developed by NCH in 1981 which is based on a pelvic radiograph study is used to estimate the location of the hip joint center relative to the ASIS location and pelvic orientations. In this method, the X, Y, Z coordinate distances of the hop center from the ASIS marker are calculated as a function of the leg length. The location of the hip joint center can also be computed using the distance between the two ASISs as the independent variable (Bell, Brand and Pedersen 1989; Davis, Ounpuu, Tyburski and Gage 1991). Particular mean values, e.g., θ, β, and C were produced for the model through that investigation.
0.1288 48.56 Ldis Lleg x = L − (Eq.1) 0.1288 48.56 Rdis Rleg x = L − (Eq.2) 2 Lleg Rleg L L L = + (Eq.3) 0.115 15.3 C= L− (Eq.4)
With n R-square correlation coefficient is 0.90. the location (in meters) of the hip joint center in pelvic coordinates relative to the origin of the pelvic embedded coordinate system is defined as
[
ker]
cos cos sinLH Ldis mar X = −x −r β+C θ β (Eq.5) sin 2 ASIS LH d Y =S C⎡⎢ θ− ⎤⎥ ⎣ ⎦ (Eq.6)
[
ker]
sin cos cosLH Ldis mar
Z = −x −r β+C θ β (Eq.7) Where:
Ldis
x is the anterior/posterior component of the left ASIS/hip center distance(in meters) in the saggital plane of the pelvic. xRdis is the component of
right side.
Lleg
L = Left leg length, distance between L.ASIS and L.LM; LRleg is right leg
length (in meters).
L = average of left and right leg length.
C = distance between L.ASIS and left hip joint center on frontal plane, a function of L (in meters).
ker
mar
r = radius of reflective marker (in meters)
ASIS
d = distance between R.ASIS and L.ASIS (in meters).
θ = sinθ =0.467, cosθ =0.880.
β = sinβ =0.309, cosβ =0.951.
S = -1 for left side; and +1 for right side.
ii Knee joint center
The knee joint center is assumed to lie in the plane defined by the knee marker, thigh-wand marker, and the hip joint center, halfway between the femoral condyles (Kadaba, Ramakrishnan and Wootten 1990). The location is calculated based on the coronal plane knee width measurement, wknee(in
meters), that is, the location of the knee joint center in thigh coordinates and relative to the lateral knee marker is
0 k X =
(
ker 0.5)
k mar keen Y =S r + w (Eq.8) 0 k Z =iii Ankle joint center
The location of it employs the same strategy that is used for the knee center location. The ankle center is assumed to fall in the plane defined by the ankle markers, the knee center, and the shank-wand marker and located halfway between the malleoli (Kadaba, Ramakrishnan and Wootten 1990).
iv Wrist joint center
The joint center of the wrist is the middle between the ulnar and radial wrist marker (Schmidt, Disselhorst-Klug, Silny and Rau 1999):
(
)
1
ker ker 2
wrist rs us
C = Mar +Mar (Eq.9) v Elbow joint center
The elbow joint center is the middle between the medial and lateral elbow markers (Schmidt, Disselhorst-Klug, Silny and Rau 1999):
(
)
1
ker ker 2
elbow me el
vi Shoulder joint center
The shoulder joint center is assumed to fall in the beeline between the acromion marker and the elbow joint center (De Leva 1996):
(
)
shoulder kerAC 0.095 elbow kerAC
C =Mar + C −Mar (Eq.11) C Establish a local coordinate system
The three-dimensional coordinates of following points in the absolute reference system are used to calculate the local coordinates systems: sacrum, R.ASIS, L.ASIS, hip center, knee center, ankle center The local coordinates are represented by three orthogonal unit vectors I, J, and K along the embedded X, Y, and Z axes, respectively. The third unit vector K is perpendicular to both I and J, defining a right-handed Cartesian coordinate system.
3.3.1.3 Kinematic and kinetic data
The limb rotation algorithm is based on the determination of Euler angles with a y-x-z axis rotation sequence. Since the orthopedic angles specify the relative orientation of the distal moving segment with respect to the proximal reference frames, the corresponding rotational matrix can be derived in terms of these angles. Let the unit vectors of the proximal reference frame in the absolute reference system be represented by I, J, and K, and the unit vectors in the distal local system of the moving segment be Iz, Jz, and Kz. Then the following
relationship can be easily derived based on orthopedic angelsθx , θy, and
z
θ defined previously for the pelvic, hip and knee:
cos cos sin sin sin cos sin sin cos cos sin sin cos cos sin sin sin cos cos sin sin cos sin sin
sin cos sin
y z y x z x z y z y x z z z y z y x z x z z z y x z z y x x I J K θ θ θ θ θ θ θ θ θ θ θ θ θ θ θ θ θ θ θ θ θ θ θ θ θ θ θ + + ⎡ ⎤ ⎢ ⎥ = − + + ⎢ ⎥ ⎢ ⎥ ⎣ ⎦ cos cosy z I J K θ θ ⎡ ⎤ ⎡ ⎤ ⎢ ⎥ ⎢ ⎥ ⎢ ⎥ ⎢ ⎥ ⎢ ⎥ ⎢ ⎥⎣ ⎦ ⎣ ⎦ (Eq.12)
1 sin cos z y x K I θ θ − ⎛ ⋅ ⎞ = ⎜ ⎟ ⎝ ⎠ (Eq.13)
(
)
1 sin x K Iz θ = − − ⋅ (Eq.14) 1 z sin cos z x I J θ θ − ⎛ ⋅ ⎞ = ⎜ ⎟ ⎝ ⎠ (Eq.15)These joint angles correspond to flexion/extension, adduction/abduction, and internal /external rotation, respectively. Note that the trunk and pelvic angles are absolute angels, i.e., referenced to the initially fixed laboratory coordinate system. The hip, knee, and angle angels are all relative angles,
3.3.2 Data processing
In this study, we collect data obtained from motion capture system and force platforms with sampling rate 250Hz and 1000Hz respectively. Time is normalized to stance duration (SD) with 0% being heel contact (HC) and 100% representing toe-off. We would first go through labeling process with Smart Tracker every trial (BTS Bioengineering, Garbagnate Milaness, Italy). Before ground reaction forces and body motion data are used to calculate specific gait variables as the dependent variables (Table 3), smoothing-filter-smoothing process is conducted with Smart Analyzer (BTS Bioengineering, Garbagnate Milaness, Italy).
A triangular window filter which the window length 2*order+1 is used for smoothing raw three-dimensional marker trajectories. We do the interpolation of the filtered data and avoid the implausible interpolation of the data by quantifying the competition between the aim to produce a good fit to the data and the aim to produce a curve without too much local variation; we use a cubic spline curve for interpolation of marker track, after that the three-dimensional marker data go through a triangular window filter for data smoothing. After smooth-filter-smooth procedure, then the processed data is used to calculate specific gait variables with Smart Analyzer (BTS Bioengineering, Garbagnate
Milaness, Italy), and a self-developed Matalb8.0 (MathWorks Inc., USA) program would be used to calculate the COM of each segment and the whole body (see Figure 11).
Figure 11 User interface of self-developed Matalb8.0 (MathWorks Inc., USA) program. After loading the C3D file which has been labeled, filtered, smoothed, and interpolated, the program could calculate the center of mass of each segment and whole body. The data from finishing the calculation process could export as Excel format.
We compute the ratio of shear to normal ground reaction force, termed the RCOF every trial. In addition, kinematic variables in the saggital plane include foot-ramp angle obtain from the heel and toe position data, and other joint angle of lower limbs are evaluated. Three-dimensional motion of pelvic and COM is also computed.
After analysis, txt data of each trial is export to Microsoft® Office Excel 2003 (Microsoft Corporation, USA), and time normalization is conducted. The time of right heel strike before step on force plat form (T1), right heel strike on force plat form (T2), right toe off on force plat form (T3), and right heel strike