國
立
交
通
大
學
資訊管理研究所
博 士 論 文
國家競爭力的規則推導與呈現
INDUCTION AND DISPLAYING OF RULES FOR
NATIONS’ COMPETITIVENESS
研 究 生:柯宇謙
指導教授:黎漢林 講座教授
國家競爭力的規則推導與呈現
INDUCTION AND DISPLAYING OF RULES FOR
NATIONS’ COMPETITIVENESS
研 究 生:柯宇謙 Student:Yu-Chien Ko
指導教授:黎漢林 Advisor:Han-Lin Li
國 立 交 通 大 學
資訊管理研究所
博 士 論 文
A DissertationSubmitted to Institute of Information Management College of Management
National Chiao Tung University in Partial Fulfillment of the Requirements
for the Degree of
Doctor of Philosophy in Information Management June 2009
Hsinchu, Taiwan, the Republic of China
國家競爭力的規則推導與呈現
學生:柯宇謙
指導教授 : 黎漢林
國立交通大學資訊管理研究所博士班
摘 要
國家競爭力對形成政府策略與經濟發展日益重要。國家競爭力的規則推導與呈現,可 做為經濟政策的制定與驗證的輔助。本研究基於 MCI-WCY 提出最佳化的模型,在 14 支指標中推導競爭力的層級規則,並將規則以‘IF-THEN’的格式表達 2001~2005 期間 競爭力的型態,如進步型與退步。所推導的規則並可透過多元尺度法呈現在球上,提 供使用者觀察國家在競爭力的分佈。最後,我們根據這些推導出來的規則,提出國家 群組改進或維持競爭力的策略。 關鍵字: 國家競爭力, 規則推導, 世界競爭力年鑑的主要競爭力指標 (MCI-WCY), 最佳化, 多元尺度法 (MDS)INDUCTION AND DISPLAYING OF RULES FOR
NATIONS’ COMPETITIVENESS
Student:Yu-Chien Ko
Advisor: Han-Lin Li
Institute of Information Management
National Chiao Tung University
ABSTRACT
A nation’s competitiveness becomes more and more important in forming government
strategy and economic development. Induction and displaying of rules for national
competitiveness is helpful in making and verifying economic policy. This study proposes an
optimization model to generate rules for competitiveness classes based on 14 Major
Competitiveness Indicators of World Competitiveness Yearbook. The obtained rules are
composed of ‘IF…THEN’ format to imply dynamic competitiveness during 2001 ~ 2005. The
implied types such as improving and depressing are helpful in understanding competitiveness
changes of nations. Furthermore, the groups of nations are displayed on spheres based on the
dissimilarity among nations. It helps users to observe visually the distribution of nations.
Finally, we suggest the strategic implications for various groups of nations to improve or to
sustain their competitiveness according to the induced rules.
Keywords: Nations’ competitiveness; rule induction; Major Competitiveness Indicators of World Competitiveness Yearbook (MCI-WCY); optimization, multidimensional scaling
Acknowledgement
論文的最後階段,我的家人跟我一起高興、一起祈禱。首先,我要感
謝父親柯承發先生與母親何瑞英女士,父親在青少年時期就扛起一家人的
生計,他的奮鬥精神鼓勵我面對挑戰。接著要感謝黎漢林老師陪著我走過
研究的艱辛路程,多年來在他的指導下,我逐步的成長茁壯。同時,也要
感謝曾國雄教授、陳安斌教授、林妙聰教授、及張錦特教授的指正與建議,
使我的論文更加完備。
艱辛的路途中啦啦隊是很重要的,我要感謝 Garry Bruton 與黃俊宗
為我跟耶何華神祈禱,也要感謝劉瑞瓏在我挫折時鼓勵我再站起來。支持
我的啦啦隊還有運籌管理實驗室的伙伴強生、昶瑞、皓均、嘉珍、麗菁、
志信、云珊、嘉輝、曜暉、婉瑜、振國等人,我們一起面對挑戰、一起分
享喜悅。
我最要感謝的人是吳俐瑢。她永遠是我的支持,家裡的大小事都是她
努力支撐著。甚至累倒了住院,她還想減輕我的負擔。八年過去了,論文
完成了,黎老師說:「這個研究,夫妻一人讀一半」。
Contents
摘 要 ...iii ABSTRACT ...iv Acknowledgement... v Contents...vi Tables ...viii Figures ...ix Chapter 1 Introduction ... 1 1.1 Research Background ... 11.2 Current Approaches of Competitiveness Analysis ... 2
1.3 Research Goal and Proposed Approach... 4
1.4 Advantages of Proposed Approach ... 7
1.5 Structure of the Dissertation ... 8
Chapter 2 WCY Data Set and Literature Review ... 9
2.1 Specification of Nations’ Competitiveness... 9
2.2 Major Competitiveness Indicators (MCI-WCY)... 9
2.3 MCI-WCY Data Set ... 11
2.4 Consolidated Competitiveness Factors... 11
2.5 Competitiveness Types for Nations ... 12
2.6 Review of Literatures of WCY Data Set ... 13
Chapter 3 The Proposed Method for Inducing Competitiveness Rules ... 15
3.1 Presentation of Data and Rules... 15
3.2 Propositions ... 19
3.3 Models of Inducing Rules ... 24
Chapter 4 Induction Rules ... 26
4.1 Dynamic Rules of Competitiveness Classes ... 26
4.2 Dynamic Rules of Sustaining Groups ... 31
4.3 Dynamic Rules of Upward Groups ... 32
4.4 Dynamic Rules of Downward Groups ... 33
Chapter 5 Displaying National Competitiveness on Spheres... 35
5.1 Proposed Displaying Method ... 35
5.2 Data Normalization ... 36
5.4 Transformation ... 38
5.5 Displaying Induced Rules of 2003 and 2005... 42
Chapter 6 Comparison of Decision Tree and the Proposed Method... 45
6.1 ID3 ... 45
6.2 The Proposed Method... 51
6.3 Analysis of Update ID3 and the Proposed Method Based on WCY-IMD for 2008. 52 Chapter 7 Concluding Remarks... 55
Appendix A: Classification of Nations ... 58
Appendix B: Data Set of MCI-WCY ... 61
Appendix C: Attribute Segments ... 65
Appendix D: Discretized Codes of MCI-WCY ... 66
Appendix E: Data Set of Consolidated Competitiveness Factors ... 70
Tables
Table 2.1: Major Competitiveness Indicators (MCI) of WCY ... 10
Table 2.2: Consolidated competitiveness factors ... 12
Table 2.3 Competitiveness types of 46 nations ... 13
Table 3.1: Example 1 of presentation ... 16
Table 3.2: Binary values converted from data set of Example 1 ... 17
Table 3.3: Binary codes of rules of Example 1... 18
Table 3.4: Meaning of rules of Example 1 ... 18
Table 4.1: Rules of competitiveness classes ... 27
Table 4.2 : Sustaining type ... 31
Table 4.3: Upward type ... 32
Table 4.4 : Downward type... 33
Table 5.1: Data set of Example 2... 36
Table 5.2: Normalized data set of Example 2... 37
Table 5.3: Dissimilarity matrix of Example 2 ... 38
Table 5.4: Coordinates of nations on the sphere... 40
Table 6.1: Step 1 of ID3... 47
Table 6.2: Step 2 of ID3 by the attribute a2... 48
Table 6.3: Step 3 of ID3... 49
Table 6.4: Induced rules of Example 1 by ID3... 50
Table 6.5: Induced rules of Example 1 by update ID3 ... 50
Table 6.6: Induced rules of Example 1 by the proposed method ... 52
Figures
Figure 1.1: The process of approach ... 5
Figure 1.2: Competitiveness types of a nation’s change during 2001~2005... 6
Figure 1.3: A conceptual sphere for 2005... 7
Figure 4.1: Competitiveness structure of 4 classes during 2001~2005 ... 30
Figure 4.2 Critical attributes of upward type... 32
Figure 4.3: Critical attributes of downward type... 34
Figure 5.1: The process of displaying method ... 35
Figure 5.2: A display sphere with competitiveness classes for Example 2 ... 41
Figure 5.3: Display sphere for 2003 ... 43
Figure 5.4: Display sphere for 2005 ... 44
Figure 6.1: The processes of ID3 algorithm ... 46
Figure 6.2: A conceptual ID3 tree... 46
Figure 6.3: The ID3 tree of Example 1 in Table 3.1... 49
Figure 6.4: The update ID3 tree of Example 1 ... 51
Chapter 1 Introduction
1.1 Research Background
After long competition among nations, some nations have stayed highly competitive (for
example the USA), or have stayed as highly non-competitive (for example ARGENTINA)
[Feldstein, 2002]. Some have grown more competitive (for example MAINLAND CHINA)
[Adams, 2006], while others have lost their competitiveness (for example ITALY) [Mascitelli,
2008]. Several attributes (such as export, inflation, unemployment, etc) may affect nations’
competitiveness. This study, based on these attributes, induces the essential rules of
explaining nations’ competitiveness. The induced rules can be utilized to suggest possible
strategies for a nation to improve its competitiveness. Some queries this study intends to
answer are: “What are the most critical attributes of nations’ competitiveness?”, “If a nation
wants to keep a high competitive level, what does it need to do?”, “What are the essential
attributes to be careful of if a nation wants to upgrade from a lower to a higher competitive
position?”, and “Which attributes restrict the progress of a less competitive nation?”.
IMD (International Institute for Management and Development) is one of the most
well-known research institutions of world competitiveness. Since 1989, IMD published World
Competitiveness Yearbook (WCY), which has attracted considerable attentions from
government and industries. Most of current researches based on WCY data set, however,
cannot answer directly the queries as ‘Why have some nations kept as highly competitive
while some have stayed as highly non-competitive?’, ‘Why have some nations grown more
competitive while others have lost their competitive?’, and ‘How the nations in various
groups improve their competitiveness?’. Four reasons why current studies cannot be answered
are [Zanakis, 2005; Oral 1996]:
(i) Too many attributes have been used. Current studies used the whole WCY data set
each other, it is difficult to find significant attributes to represent the competitiveness
function by using traditional techniques such as regression analysis and neural
network techniques. In addition, the quality of these 300 attributes is different from
each other. Thus, it is not proper to treat them equally.
(ii) Lack of dynamic analysis. It is hard to have consistent data over a series of time based
on 300 attributes of WCY. Current studies therefore did not perform dynamic analysis
of competitiveness over time, which results in difficulty in answering the queries
mentioned above.
(iii) Difficulty in inducing general rules. Some current studies have used regression and
neural network techniques to find the factors of competitiveness. Parts of specific rules
may be observed from simple regression results in small sectors (such as a rule that
covers a few nations). However, it is difficult to induce general rules from a set of
regression equations, since there are too many combinations that make possible rules
[Zanakis 2005, Oral 1996]
(iv) Difficulty in explaining competitiveness groups. Decision tree is a widely used
method to induce rules in many applications. However, its interpreting capability may
suffer from too many branches when it is applied to national competitiveness. The
decision tree method expands many branches due to multiplication of the number of
attribute values and competitiveness levels. The more branches, the less nations are
covered in a branch, i.e. the less interpreting capability it can have [Zanakis 2005;
Quinlan 1986, 1993]
1.2 Current Approaches of Competitiveness Analysis
Two systematic approaches of analyzing national competitiveness are discussed below.
1. Ranking competitiveness: IMD is the representative that provides competitiveness
attributes. However, there are too many attributes to imply characteristics of
competitiveness. Neither does it provide nation groups to illustrate competitiveness
differentiation [IMD 2001, 2003, 2005].
2. Classifying competitiveness: Porter classifies nations into classes based on citizen’s
income capability and identifies significant attributes for each class. The classes are
implied with labor intensity, efficiency, and innovation for economic development of
nations. However, the income is not the only attribute to influence a nation’s
competitiveness. The income classes are not sufficient to make or verify
competitiveness policy (Poter 2005; Garelli 2003).
Progressing into a higher class, preventing fall into a lower one, and sustaining his or her
nation within a class are foci of competitiveness concerns. Either approach above only
provides partial solutions. For instance, the former does not provide implications for
competitiveness classes i.e. short of capability to clearly tell the competitiveness
differentiation. This part, however, is important for competitiveness strategies. The later
provides income classes that may not be considered as competitiveness classes. Following
WCY [Garellie, 2003], national competitiveness is not necessary for wealth, power, and
economic performance of a nation, which is explained below.
z A nation’s competitiveness is not necessarily an indicator of wealth. Wealth can be the result of past competitiveness, for example due to accumulated capital and knowledge
(such as the European industrialized nations). Wealth may also be in natural resources
ready to be exploited (such as in oil-producing nations). As a consequence, a nation can be
wealthy but not competitive.
z A nation’s competitiveness is not necessarily an indicator of power. Since power can be the result of a combination of wealth and size (such as Japan which is not necessarily as
z A nation’s competitiveness is not necessarily an indicator of economic performance. Since economic performance focuses on added value over the short-term (commonly expressed
as GDP growth), it does not take into account the depletion of non-renewable capital (such
as natural resources), the volatility of the economy, and the impact of non-tangibles (such
as education, research, etc).
In this research we intend to identify significant attributes for competitiveness classes
and dynamic change that nations evolve during 2001~2005.
1.3 Research Goal and Proposed Approach
The goal of this study aims to induce rules for competitiveness classification then find
competitiveness types consist of classes during 2001 ~ 2005. A displaying sphere is proposed
to help users to visually catch differentiation between competitiveness rules. Finally, the
strategic implications are suggested for improving to higher competitive classes, preventing
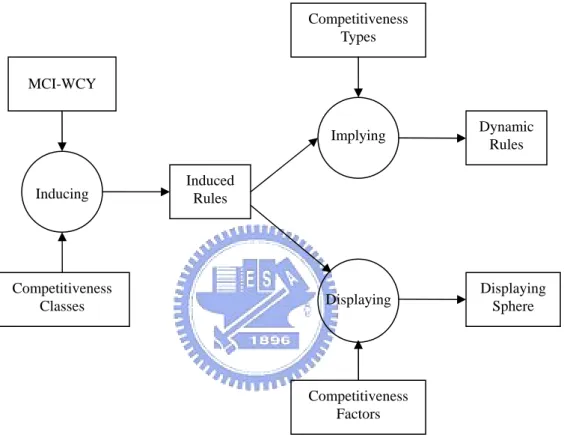
fall in competitiveness, and sustaining within a class. Figure 1.1 illustrates the approach.
Users can realize competitiveness classes with ‘IF...THEN’ statements. The features of the
study are listed below.
z The competitiveness scores are used to separate nations into classes by the K-mean method on competitiveness scores. Following Ulengin (2002), these classes are named as
highly competitive (G4), competitive (G3), non competitive (G2), and least competitive
(G1). The competitiveness scores of nations in classes follow the relation as G4 ≥ G3 ≥ G2
≥ G1. The details of implementation are described in Appendix A.
z A high quality and precise MCI-WCY data set, the so-called Major Competitiveness Indicators (MCI) is used, instead of a large WCY data set. The data set contains the 14
most reliable and consistent attributes, which covers 46 nations and 3 time periods (2001,
2003, 2005). They are analyzed for class implications, which are described next.
proposed to induce general rules for competitive classes. These induced rules, expressed
in ‘IF...THEN’ form, contain the essential attributes only, especially since they are
formulated with conjunctive and disjunctive terms that increase flexibility when
analyzing the complexity of competitiveness attributes.
Figure 1.1: The process of approach
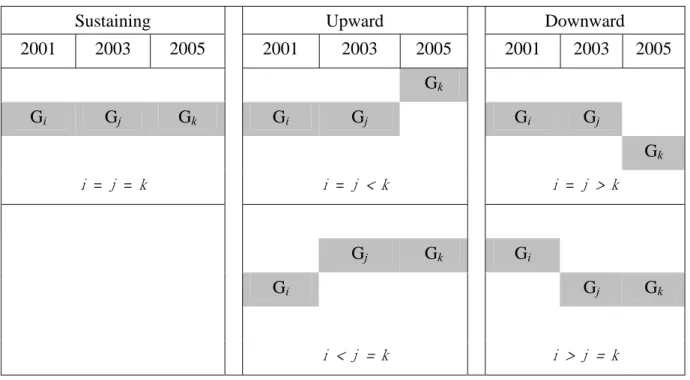
z Some competitiveness types labeled by such terms as upward, downward, and sustaining are formed with dynamic classes, which are helpful to realize dynamic change of nations.
Figure 1.2 shows construction of competitiveness types based on classes where Gi, Gj,
and Gk classes are relative to the year 2001, 2003, and 2005. Finally, we answer our
target queries listed above with the implications of these types.
MCI-WCY Inducing Implying Competitiveness Types Competitiveness Classes Induced Rules
Displaying Displaying Sphere
Competitiveness Factors
Dynamic Rules
Sustaining Upward Downward 2001 2003 2005 2001 2003 2005 2001 2003 2005 Gk Gi Gj Gk Gi Gj Gi Gj Gk i = j = k i = j < k i = j > k Gj Gk Gi Gi Gj Gk i < j = k i > j = k
Figure 1.2: Competitiveness types of a nation’s change during 2001~2005
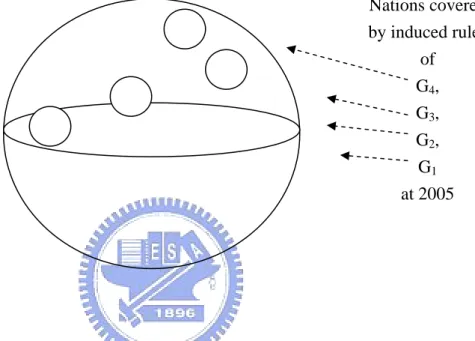
z A displaying model is designed to transform nations with 4 consolidated competitiveness factors, government efficiency, economic efficiency, business efficiency, and
infrastructure onto the surface of a sphere. Nations covered by an induced rule are
located locally on a surface area of the sphere, which is presented in a conceptual sphere
in Figure 1.3. Users can catch nations’ differentiation by visual distance transformed
from dissimilarity between nations. They can also find competitiveness direction by
comparing with the top nation. Technically, the transformation is implemented by
combining Multidimensional Scaling (MDS) and Integer Programming (IP) to make
z MDS is applied to transform high dimensional configuration to lower dimensions. After implementation, each nation is located at a point with 3 coordinates on a sphere. Users
can see areas of surface to get the image of a rule.
z Integer Programming (IP) is applied to MDS computation to get optimal solutions.
Figure 1.3: A conceptual sphere for 2005
1.4 Advantages of Proposed Approach
Our displaying sphere shows the competitiveness differentiation between nation groups
and gives visual help for economic decision policy. Decision makers can realize the
differentiation in terms of induced rules. The induced rules will respond to following typical
queries about nations’ competitiveness such as: (a) What are the most critical attributes of
affecting the competitiveness? (b) If a nation (such as the USA or SINGAPORE) wants to
keep at a highly competitive level, what do they need to do? (c) What are the essential
attributes to care about if a nation wants to upgrade from a lower to a higher class? (d) Which
attributes restrict the progress of a less competitive nation?
Nations covered by induced rules of G4, G3, G2, G1 at 2005
The induction rules have following features:
(i) The rules are expressed in ‘IF...THEN’ statement with conjunction and/or disjunction
description.
(ii) Two criteria of a quality rule are used: the accuracy rate (AR) and the coverage rate (CR)
(Pawlak 1999). A representative rule of a specific class should have high AR and CR.
Such a rule should be supported by most nations within the same class and not cover
nations in other classes.
(iii) The rules are induced by using the mixed 0-1 linear programming. The objective is to
maximize AR and CR values. Globally optimal solutions are guaranteed.
1.5 Structure of the Dissertation
This paper is organized below. Chapter 2 discusses the MCI-WCY data set and the
competitiveness types. Chapter 3 includes the data notation and rule propositions for
induction. Chapter 4 presents induction rules and dynamic rules during 2001~2005. Chapter 5
proposes a displaying model for induced rules and showing differentiation by class nations.
Chapter 6 compares the decision tree ID3 and the proposed method. Finally, concluding
Chapter 2 WCY Data Set and Literature Review
2.1 Specification of Nations’ Competitiveness
Following WCY (Garelli, 2003), nations’ competitiveness is defined as a measurement of
each nation’s ability to create and maintain an environment that sustains more value creation
for its enterprises and more prosperity for its people. WCY divides the nations’
competitiveness into four factors: economic performance, government efficiency, business
efficiency, and infrastructure. More than 300 attributes are used together to represent these
four factors. All these 300 attributes have the same weight in the overall consolidation of
results, which lead to the overall ranking of nations. The WCY provides a competitiveness
score for each nation by synthesizing all collected information into a few factors (IMD 2001,
2003, 2005).
2.2 Major Competitiveness Indicators (MCI-WCY)
MCI are selected by the WCY to analyze the performance of each nation
independently of the others. They best reflect the changes in quantitative data over time.
Their evolution in time series portrays competitiveness trends and how the nations compete
Table 2.1: Major Competitiveness Indicators (MCI) of WCY
Symbol Attributes Abbreviation Description Units
1
a EXPORT OF GOODS & OF COMMERCIAL SERVICES
Export Exports summation of goods and commercial services (calculated by per million population)
US$ billions
2
a COMPUTERS PER
CAPITA Computer The average computers for any given 1000 people. Number
3
a GDP PER CAPITA GDP Gross Domestic Product per person US$
4
a LISTED DOMESTIC COMPANIES Company
The number of domestically incorporated companies listed on the country's stock exchanges at the end of the year Number
5
a STOCK MARKET CAPITALIZATION Stock
The value of all the stocks traded on a specific stock exchange (calculated by per million population)
US$ billions
6
a COMPENSATION
LEVELS Salary
Total hourly compensation for manufacturing workers (wages plus supplementary benefits) US$
7
a OVERALL
PRODUCTIVITYS Productivity GDP per person employed US$
8
a CONSUMER PRICE INFLATION Inflation
Average annual rate; the price increases as measured by the consumer price Indicators (CPI), which reflects the prices of a representative basket of consumer goods and services.
%
9
a UNEMPLOYMENT
RATE Unemployed
the ratio of the number of unemployed workers divided by the total civilian labor force %
10
a DIRECT INVESTMENT
FLOWS INWARD Invest –in
Foreign direct investment flows inward (calculated by per million population)
US$ billions
11
a DIRECT INVESTMENT
FLOWS ABROAD Invest-out
Direct investment flows toward oversea, calculated by per million population
US$ billions
12
a REAL GDP GROWTH GDP growth A measure of the annual percent change in the level of production achieved in a given country as measured in constant prices %
13
a CURRENT ACCOUNT BALANCE Balance
The difference between a country's savings and its investment. If positive, the portion of a country's saving invested abroad; if negative, the portion of domestic investment financed by foreigners' savings (calculated by per million population)
US$ billions 14 a PRIVATE FINALCONSUMPTION EXPENDITURE PER CAPITA Consumption
Household final consumption expenditure and final consumption expenditure of non-profit institutions serving households, incurred by resident on individual consumption goods and services
2.3 MCI-WCY Data Set
Our research data comes from the data set of Major Competitiveness Indicators (MCI) in
WCY for 2001, 2003, and 2005. The MCI-WCY data set covers 14 major competitiveness
attributes for 46 nations from 2001 to 2005 (Table B.1, B.2, and B.3 of Appendix B) These
data sets are the most continued, consistent, and reliable data chosen from MCI-WCY.
In order to induce rules of competitiveness, we need to convert the data set in Appendix
B into discretized codes. Each attribute is divided into four levels: very high, high, medium,
and low according to the value domain of that attribute. An equal frequency of nations in each
ai level is adopted to implement the division, described in Appendix C. Following
competitiveness classes in Phase (i) we divide 46 nations into 4 classes. The MCI-WCY data
set in Table B.1, B.2, and B.3 of Appendix B are then converted respectively into Table D.1,
D.2, and D.3 of Appendix D. Take USA in 2001 (in Table B.1) for instance, the a2 value is
580.5 and the overall score is 100. Since such a a2 value belongs to level 4 (according to the
standard in Appendix C), we then denote a2 = 4 at Table D.1.
2.4 Consolidated Competitiveness Factors
WCY divides national environment into 4 factors based on analysis of leading scholars
and their own research and experience. Each factor has 5 sub-factors which highlight every
facet of the areas analyzed. These 20 sub-factors comprise more than 300 criteria. The criteria
may be hard data like GDP or soft data like manager ability, which all have same weight to its
sub-factor. Finally, these 20 sub-factors are aggregated to make the total consolidation, which
leads to the overall ranking of the WCY. The description of factors is listed in Table 2.2. The
Table 2.2: Consolidated competitiveness factors
Symbol Factors Description
f1
government
efficiency
Extent to which government policies are conductive to
competitiveness.
f2
economic
performance
Macro-economic evaluation of the domestic economy
f3
business
efficiency
Extent to which enterprises are performing in an innovative,
profitable, and responsible manner.
f4 infrastructure
Extent to which basic, scientific, and human resources meet the
needs of business.
2.5 Competitiveness Types for Nations
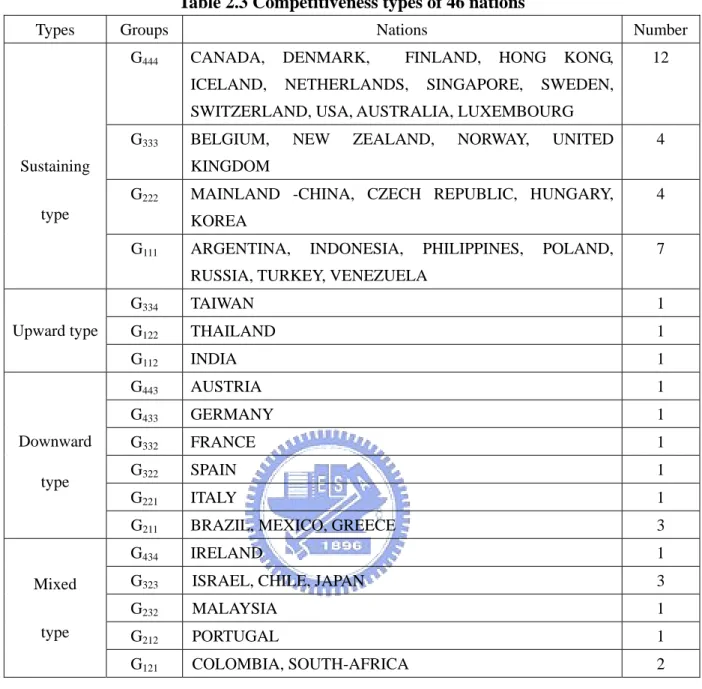
Examining the change of a nation’s classes for years of 2001, 2003, and 2005, we may
classify the 46 nations into 4 types and 18 groups as shown in Table 2.3 in the following
ways.
(i) A nation is in group Gijk, if the nation belongs to i, j, and k class in the year 2001, 2003,
and 2005 respectively.
(ii) If i = j = k then Gijk belongs to a sustaining type. There are 27 nations in this type. For
instance, the USA belongs to G444 and INDONESIA belongs to G111.
(iii) If i < j = k or i = j < k then Gijk belongs to an upward type. Only three nations are
included in this type, where TAIWAN is G334, THAILAND is G122 and INDIA is G112.
(iv) If i > j = k or i = j > k then Gijk belongs to a downward type. Seven nations are
included in this type.
(v) If i > j < k or i < j > k then Gijk belongs to a mixed type. For instance, CHILE belongs
Table 2.3 Competitiveness types of 46 nations
Types Groups Nations Number
G444 CANADA, DENMARK, FINLAND, HONG KONG,
ICELAND, NETHERLANDS, SINGAPORE, SWEDEN, SWITZERLAND, USA, AUSTRALIA, LUXEMBOURG
12
G333 BELGIUM, NEW ZEALAND, NORWAY, UNITED
KINGDOM
4
G222 MAINLAND -CHINA, CZECH REPUBLIC, HUNGARY,
KOREA
4 Sustaining
type
G111 ARGENTINA, INDONESIA, PHILIPPINES, POLAND,
RUSSIA, TURKEY, VENEZUELA
7 G334 TAIWAN 1 G122 THAILAND 1 Upward type G112 INDIA 1 G443 AUSTRIA 1 G433 GERMANY 1 G332 FRANCE 1 G322 SPAIN 1 G221 ITALY 1 Downward type
G211 BRAZIL, MEXICO, GREECE 3
G434 IRELAND 1
G323 ISRAEL, CHILE, JAPAN 3
G232 MALAYSIA 1
G212 PORTUGAL 1
Mixed type
G121 COLOMBIA, SOUTH-AFRICA 2
2.6 Review of Literatures of WCY Data Set
WCY data set has been widely used in ranking nations’ competitiveness and in forming
nations’ strategy for development. Some studies based on WCY data set with 300 attributes
are given below.
(i) Au (2006) used the WCY as a data set for finding plant locations for Hong Kong
clothing suppliers. His results showed that China, Pakistan, India, Thailand, and Sri
(ii) Zanakis and Becerra-Fernandez (2005), based on WCY data sets, used data mining
and multivariate statistical techniques to identify important factors associated with a
nation’s competitiveness. In their validation of methods, the stepwise regression had
the best average minimum square error (MSE) and the best mean absolute error
(MAE); while classification tree and regression (CART) performed the poorest
(Zanakis 2005).
(iii) Pistorius (2001) used WCY rating and competitiveness factors to address the fact that
SOUTH AFRICA’s weak competitiveness was a threat to its national security.
Following analytical results from the WCY, he proposed ways to improve innovation
in raising SOUTH AFRICA’s competitiveness in the future (Pistorius 2001).
(iv) Sheng (1999) used the WCY data set to discover that CHINA had a less certain
economy, which was still far from controlling or dominating market and industries. He
then proposed that CHINA and the UNITED STATES could cooperate as strategic
partners, which might fit the UNITED STATES’ long-term national interests (Sheng
1999).
(v) Oral and Chabchoub (1996) used WCY methodology and data sets to simulate
competitiveness score and ranks. However, they could not reproduce results like those
Chapter 3 The Proposed Method for Inducing
Competitiveness Rules
Our method reduces competitiveness attributes into a subset that can be used to
discriminate classes. It generates a rule in terms of binary operations which approximate to a
certain degree of covering nations within a class and discriminating nations in the other
classes. The operation is built on matching attribute values between the rule and nations.
Binary variables are designed for covered and discriminated nations with 0 and 1. A sum of
binary variables within a class and another sum of binary variables in the rest of classes are
used for a rule’s quality parameters. The ratios of the sums to the number of their respective
nations are used as quality measurement for a rule. Since the obtained rules are presented by
‘IF…THEN’ format, users can easily tell the discrimination between classes.
The rule and data set are reformatted for matching operations described in Section 3.1,
which presents a rule and data set with binary bits. Section 3.2 proposes the binary matching
operations and the approximation degree of covered nations. Section 3.3 applies integer
programming to implement the matching operations in Lingo 10. Followings include the
proposed method and models.
3.1 Presentation of Data and Rules
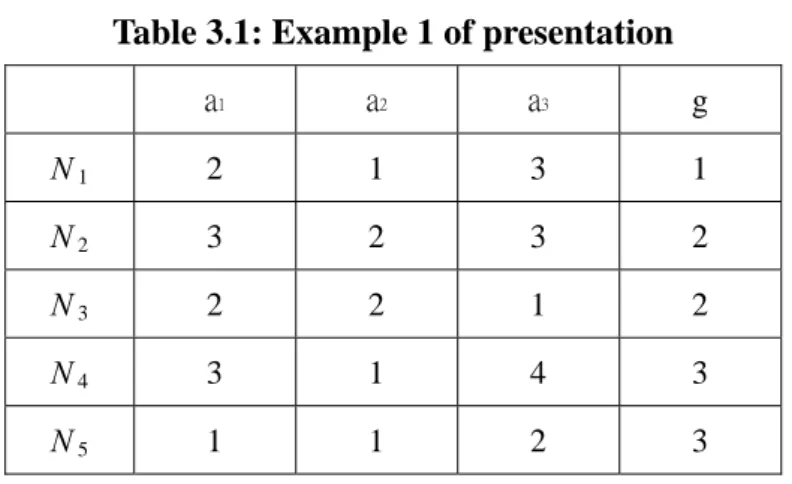
Here we use the example 1 to illustrate the way of presenting the data and rules.
Consider a sample data set in Table 3.1 with 5 nations (N1, N 2, N 3, N 4, N 5), three attributes
(a1, a2, a3) and one class Indicators g. The domain values of a1, a2, and a3 are {1, 2, 3}, {1, 2},
Table 3.1: Example 1 of presentation a1 a2 a3 g N 1 2 1 3 1 N 2 3 2 3 2 N 3 2 2 1 2 N 4 3 1 4 3 N 5 1 1 2 3
Table 3.1 is firstly converted into a new one presented by binary values as shown in
Table 3.2. Here ajp is called a sub-attribute of attribute aj. A nation Ni of the class k is
expressed as
11 12 13 21 22 31 32 33 34
( i i i ; i , i ; i i i , i ), (3.1)
i i
N = a , a , a a a a , a , a a g =k − − − − − − − − − − − − − − − − − −
For instance, N1 is expressed as N1=(0,1,0;1,0;0,0,1,0) and g1=1.
Denote Rl(k) as lth rule of classifying kth class can be expressed as a binary vector below 11 12 13 21 22 31 32 33 34 ( ) ( l , l , l ; l , l ; l , l , l , l ) (3.2) l R k = d d d d d d d d d − − − − − − − − − − − − − − − − − − 1, 0, th th w here
if sub-attribute is chosen in rule. if sub-attribute is not chosen in rule.
l jp jp l jp jp d a l d a l = =
Such an expression is very useful in expressing rules in conjunction and disjunction forms.
For a data set containing n nations, m attributes where each attribute aj having q(j) levels.
Consider the following notations and remarks.
Notation 1:
A general form for expressing a nation Ni of group k is written as
( i i ... i ; i ... i ; ...; i ... i ), , {0,1} (3.3)
i q q m mq m i jp
A general form for expressing a nation Nr not in group k is written as
11 12 1 (1) 21 2 (2) 1 ( )
( r r ... r ; r ... r ; ...; r ... r ), , {0,1} (3.4)
r q q m mq m r jp
N a , a= a a a a a g ≠k a ∈ − − − − − −
Notation 2: A general form of expressing a ruleRl(k), the rule of classifying kth group, is expressed as 11 12 1 (1) 21 2 (2) 1 ( ) ( ) ( l l ... l ; l ... l ; ...; l ... l ), {0,1} (3.5) l q q m mq m jp R k = d , d d d d d d d ∈ − − − − − − − − Remark 3.1:
(i) If j is an ignored attribute forRl(k), then dljp =0 for all p
(ii) If jp is an active sub-attribute forRl(k), then dljp =1
Situation (i) is for a case when a rule can be expressed compactly by a fewer number of
attributes. Situation (ii) is for a case where the disjunction expression is used for an
attribute.
Table 3.2: Binary values converted from data set of Example 1
a1 a2 a3 Ni a11 a12 a13 a21 a22 a31 a32 a33 a34 gi N1 0 1 0 1 0 0 0 1 0 1 N2 0 0 1 0 1 0 0 1 0 2 N3 0 1 0 0 1 1 0 0 0 2 N4 0 0 1 1 0 0 0 0 1 3 N5 1 0 0 1 0 0 1 0 0 3
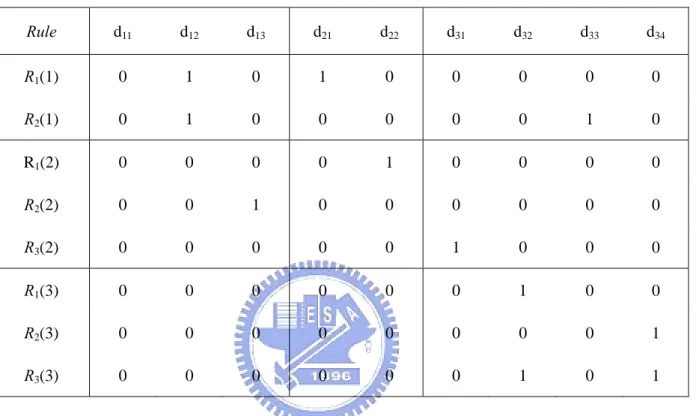
For a small example in Table 3.2, we can list intuitively related classification rules
expressed in Table 3.3 and 3.4, the mathematical model of inducing these rules is described
later. For instance, the first rule for group 2 is expressed as R1(2)=(0,0,0;0,1;0,0,0,0)
two nationsN2 and N . In Table 3.4, two criteria AR (accurate rate) and CR (coverage 3
rate) are used to measure the quality of a rule. The definitions and meanings of AR and CR
will be discussed later.
Table 3.3: Binary codes of rules of Example 1
Rule d11 d12 d13 d21 d22 d31 d32 d33 d34 R1(1) 0 1 0 1 0 0 0 0 0 R2(1) 0 1 0 0 0 0 0 1 0 R1(2) 0 0 0 0 1 0 0 0 0 R2(2) 0 0 1 0 0 0 0 0 0 R3(2) 0 0 0 0 0 1 0 0 0 R1(3) 0 0 0 0 0 0 1 0 0 R2(3) 0 0 0 0 0 0 0 0 1 R3(3) 0 0 0 0 0 0 1 0 1
Table 3.4: Meaning of rules of Example 1
Rules Meaning Supporting
nations AR (accurate rate) CR (coverage rate) R1(1) R2(1) If (a1=2) and (a2=1) then g = 1 If (a1=2) and (a3=3) then g = 1 N1 N1 1 1 1 1 R1(2) R2(2) R3(2) If (a2 = 2) then g=2 If (a1 = 3) then g=2 If (a3 = 1) then g=2 N2 , N3 N2 N3 1 1 1 1 0.5 0.5 R1(3) R2(3) R(3) If (a3 = 2) then g = 3 If (a3 = 4) then g = 3 If (a = 2 or 4) then g = 3 N5 N4 N, N 1 1 1 0.5 0.5 1
Examining Table 3.4 to know the followings:
(i) There may be more than one classification rule for a specific group. For instance, both
R1(1) and R2(1) are used to classify the 1st group.
(ii) A rule with more supporting nations is better than the rule with less supporting nations.
For instance, R1(2) is better than R2(2).
(iii) A rule may be obtained by integrating related rules, thus having more supporting
nations. For instance, R3(3) is the union of R1(3) and R2(3), which is supported by more
nations than R1(3) and R2(3).
(iv) The rules can be expressed in both conjunction and disjunction form. For instance,
R3(3) is expressed in disjunction form while R1(3) and R2(3) are in conjunction form.
3.2 Propositions
Proposition 3.1: For the rule Rl(k),
(i) If nation i in class k supports Rl(k) then
1 1 (3.6)
p
for all w here
i l l
jp jp jp
p
a d = j d ≥ − − − − − − − − − − − − − − − − − − − − − − − − − − − − − −
∑
∑
Otherwise the nation i does not support the rule Rl(k).
(ii) If nation r not in class k is not discriminated by Rl(k) then
1 1 (3.7)
p
for all w here
r l l
jp jp jp
p
a d = j d ≥ − − − − − − − − − − − − − − − − − − − − − − − − −
∑
∑
Otherwise the nation r supports the rule Rl(k).
Take Table 3.4 for instance, inducible R1(1) is supported by N1.
Proposition 3.2: For the rule Rl(k), R kl( ) (= d , d11l ..., mq ml ( )) described in Proposition 3.1, some
attributes can be ignored to simplify the expression. If there are h attributes being ignored in
1 1 ( ) (3.8) , ( ) i
for some supporting the rule w here w hich also means is covered by the rule
ii m i l jp jp j p i m r l jp jp j p a d m h i g k i a d m = = = − − − − − − − − − − − − − − − − − − − − − − − − − − − − = ≤
∑∑
∑∑
1 (3.9)for some supporting the rule w here r
h
r g k
− − − − − − − − − − − − − − − − − − − − − − − − − − − − −
≠
Take the rule R1(1) in Table 3.3 for instance to check proposition 3.2, here d12 = d21 =1 and
the number of attributes with
∑
ljp =0p
d is 1. That means m=3 and h=1. It is convenient to check that 1 1 12 12 21 21 1 2 2 12 12 21 21 2 3 3 12 12 21 21 3 4 4 12 12 21 21 4 5 5 12 12 21 21 5 ( ) 2 ( ) 0 1 1 1 1 1 1 1 i for ii for for for for a d a d N a d a d N a d a d N a d a d N a d a d N + = + = ≤ + = ≤ + = ≤ + = ≤
Similarly, checking a union rule R3(3) where d32 = d34=1 and the number of attributes with
0 =
∑
ljp p
d is 2, will have the following results :
4 4 32 32 34 34 4 5 5 32 32 34 34 5 1 1 32 32 34 34 1 2 2 32 32 34 34 2 3 3 32 32 34 34 3 ( ) 1 1 ( ) 0 0 0 i for for ii for for for a d a d N a d a d N a d a d N a d a d N a d a d N + = + = + ≤ + ≤ + ≤
A Ni where gi = k is said to ‘support’ a rule Rl(k) if Ni fits the condition (i) of proposition 3.2.
A Nr where gr ≠ k is said to ‘not support Rl(k)’ if Nr fits condition (ii) of proposition 3.2.
Here we specify binary variable ui and vrdefined as below:
z ui = 1 if a nation Ni supports Rl(k), covered by Rl(k), where gi = k; otherwise ui = 0.
z vr = 1 if a nation Nr support Rl(k), not covered by Rl(k), where gr ≠ k; otherwise vr = 0. Proposition 3.3
For a rule Rl(k) and n nation N1, N2, N3, …, Nn, there exists ui and vr for satisfying following
inequalities. 1 1 ( ) ( 1) (1 ) (3.10) ( ) 1 (1 ) (3.11) u h u
for all w here
h v
for all w here
m i l i jp jp i j p i m r l jp jp r j p r i n m a d m h n i g k ii a d m n r g k = = − + − ≤ ≤ − + − − − − − − − − − − − − − − − = ≤ − − + − − − − − − − − − − − − − − − − ≠
∑∑
∑∑
( )iii u i , vr ∈ {0, 1} − − − − − − − − − − − − − − − − −(3.12)Proof : If ui =1 then (i) is equivalent to (i) in Proposition 3.2.
If vr =1 then (ii) is equivalent to (ii) in Proposition 3.2.
Following are two criteria for evaluating the quality of the rule.
(i) The rule should be supported by most nations of a specific group. That means, the
support rate of a good rule should be high.
(ii) The rule should be accurate. That means, the rule should not cover the nations of
non-specific groups. In other words, the accuracy rate of a good rule should be high.
Proposition 3.4
Considering a data set containing n nations. Denote the number of nations belonging
rate and the supporting rate are specified below:
Accuracy rate: The accuracy rate of a rule is specified as
1 ( ) ( ) ( ) r v l r g k AR k n n k ≠ = −
∑
That means if none of nation Nr wheregr ≠k is covered by the rule, then the accuracy rate of the rule is 1.
Coverage rate: The coverage rate of a rule is specified as
1 ( ) ( ) ( ) i u l i x k CR k n k = =
∑
That means if all Ni wheregi =k support the rule then the coverage rate of the rule is 1.
AR and CR value for the rules in Table 3.3 are listed in the last two columns of Table3.4.
Explanation is described below.
(i) Considering AR and CR of R1(1), one nation belongs to group 1 (i.e., g=1) and 4 nations
belong to other groups. Therefore, n(1) =1 and n-n(1)=4. Thus,
1 4 4 = = AR and 1 1 1 = = CR
(ii) Considering disjunctive values of the rule R3(3), two nations belongs to group 3 (i.e.,
g=3) and 3 nations belong to other groups. Therefore, n(1) =2 and n-n(3)=3. Thus, its
AR and CR of R3(3) is as 1 3 3 = = AR and 1 2 2 = = CR
Take Table 3.1 for instance, inducing the rule for g = 1 is formulated below. 2 3 4 5 1 (1) 1 . . ( ) 5 1 1 1 MAX v v v v u CR s t AR a CR = + + + ≥ − = 5(u1-1) + 3 – h ≤ d12 + d21 + d33 ≤ 3 – h + 5 (1-u1) d13 + d22 + d33 ≤ 3 – h -1 + 5 (1- v2) d12 + d22 + d31 ≤ 3 – h -1 + 5 (1- v3) d13 + d21 + d34 ≤ 3 – h -1 + 5 (1- v4) d11 + d21 + d32 ≤ 3 – h -1 + 5 (1- v5) ui,vr, djp ∈ {0.1}, h≥ b
By specifying a = 1 and b=1, the solution obtained is: CR=1 with d12=d21=1 (all other djp=0), h=1, u1=v2=v3=v4=v5=1, AR=1. This rule is exactly R1(1) in Table 3.3. Another
instance of inducing the rule for g = 3 is formulated below
1 2 3 4 5 4 5 (3) 1 . . ( ) 5 2 1 ( ) 2 MIN CR s t AR v v v v v a CR u u = + + + + ≥ − = + 5(u4-1) + 3 – h ≤ d13 + d21 + d34 ≤ 3 – h + 5 (1-u4) 5(u5-1) + 3 – h ≤ d11 + d21 + d32 ≤ 3 – h + 5 (1-u5) d12 + d21 + d33 ≤ 3 – h - 1 + 5 (1- v1) d13 + d22 + d33 ≤ 3 – h - 1 + 5 (1- v2) d12 + d22 + d31 ≤ 3 – h - 1 + 5 (1- v3) ui,vr, djp ∈ {0.1} h ≥ b
By specifying a= 1 and b=1, the solution obtained is
32 34 4 5 1 2 3
1 w ith 1, all other jp 0, h 1, u u v v v 1, 1
3.3 Models of Inducing Rules
From the basis of the discussion above, two models for inducing the rule are
illustrated. Model (I) is designed to obtain rules that at most one attribute has disjunctive
sub attribute values. The interval values of an attribute represent proximity of a class. The
other attributes show specific characteristics in the class. Users can realize the specific
competitiveness based on the proximity. Technically, the optimization is applied to approach
the objective of the model.
( ) . . 1 ( ) ( ) ( ) ( ) 1 ( ) ( ) ( ) ( ) ( ) (3.10), (3,11), (3,12) Model (I) Max v u of proposition 3.3 r i l l r g k l i g k CR k s t i AR k a n n k ii CR k n k iii ≠ = = ≥ − =
∑
∑
( ) 1, * ( ) 1 * , * ( 1) ( ) , , {0,1} θ d θ d θ θ d d for all h d θ j jp j j p jp j j jp jp p P p jp j iv n v n j iv b ≤ ≤ − ≤ ≤ − ≥ ∈∑
∑
∑
∑
∑
Model (II) is designed to generate rules with attribute reduction that approaches
ignores attributes as possible. Second, it generates a continuous sub attributes in the rule.
Step (iv) of Model (II) enforces dj,t to value 1 if both sides of sub attribute t have value 1.
This model generates rule presented by attribute intervals. Application of Model (II) on
Example 1 is described in Section 6.2 of Chapter 6 (Li 2007).
( ) ( ) , . . 1 ( ) ( ) ( ) ( ) Model (II) Max
is the number of attributes
is the number of ignored attributes
v r l l l r g k CR k AR k m h m h s t i AR k a n n k ≠ + − = ≥ −
∑
( ) 1 1 1 , , , , 1 1 1 , 1 ( ) ( ) ( ) ( ) ( ) (3.10), (3,11), (3,12) ( ) max{ , 1 ( ) 1 u of proposition 3.3 d d d d d i l i g k q j t t j p j p j p j p p p t p p t j t ii CR k b n k iii iv t q j t t = − − − = = + = = + = ≥ ≥ + − − − −∑
∑
∑
∑
( ) 1 1 }, ( ) 2 ( ) 1, ( ) is a sub attribute ofis the number of sub attributes of attribute q j q j t t q j t j q j j − − ≤ ≤ −
∑
{0,1} djp∈Chapter 4 Induction Rules
4.1 Dynamic Rules of Competitiveness Classes
By utilizing the method proposed in Chapter 3, we can induce the rules of 4 classes for
each year. These rules are described as Ri2001,Ri2003, and Ri2005, where i represents 4 classes
G1, G2, G3, and G4. The results are presented in Table 4.1. These rules are the best rules for
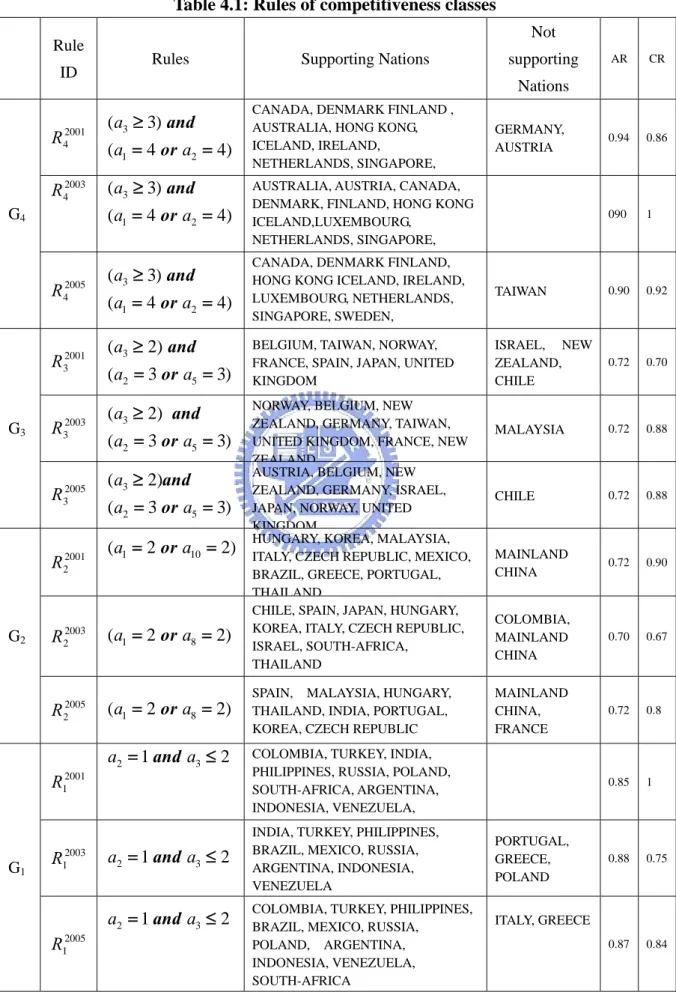
each class with high AR and CR. Take 2001
i
R for instance, 2001 4
R is the best rule for class 4 at year 2001, which is expressed as (a3 ≥ 3 ) and (a1 = 4 or a2 = 4) with AR = 0.87 and CR =
0.86. That means: For a nation at year 2001, if its GDP (a3) greater than or equal to level 3,
and its Computer (a2) or its Export (a1) is at the highest level (level 4) then this nation belongs
to the highly competitive class (G4). 14 of 46 nations fit these conditions (12 in G4,
BELGIUM and NORWAY in G3). Therefore the rule covers 12 of the 14 nations in G4
(GERMANY, and AUSTRIA are not covered) and the coverage rate is 12/14=0.86. There are
32 nations in other classes (G1, G2, and G3). Therefore, the accuracy rate is 30/32=0.94 due to
Table 4.1: Rules of competitiveness classes
Rule
ID Rules Supporting Nations
Not supporting Nations AR CR 2001 4 R 3 1 2 ( 3) ( 4 4) and or a a a ≥ = =
CANADA, DENMARK FINLAND , AUSTRALIA, HONG KONG, ICELAND, IRELAND, NETHERLANDS, SINGAPORE, GERMANY, AUSTRIA 0.94 0.86 2003 4 R 3 1 2 ( 3) ( 4 4) and or a a a ≥ = =
AUSTRALIA, AUSTRIA, CANADA, DENMARK, FINLAND, HONG KONG ICELAND,LUXEMBOURG, NETHERLANDS, SINGAPORE, 090 1 G4 2005 4 R 3 1 2 ( 3) ( 4 4) and or a a a ≥ = =
CANADA, DENMARK FINLAND, HONG KONG ICELAND, IRELAND, LUXEMBOURG, NETHERLANDS, SINGAPORE, SWEDEN, TAIWAN 0.90 0.92 2001 3 R 3 2 5 ( 2) ( 3 3) and or a a a ≥ = =
BELGIUM, TAIWAN, NORWAY, FRANCE, SPAIN, JAPAN, UNITED KINGDOM ISRAEL, NEW ZEALAND, CHILE 0.72 0.70 2003 3 R 3 2 5 ( 2) ( 3 3) and or a a a ≥ = =
NORWAY, BELGIUM, NEW ZEALAND, GERMANY, TAIWAN, UNITED KINGDOM, FRANCE, NEW ZEALAND MALAYSIA 0.72 0.88 G3 2005 3 R 3 2 5 ( 2) ( 3 3) and or a a a ≥ = =
AUSTRIA, BELGIUM, NEW ZEALAND, GERMANY, ISRAEL, JAPAN, NORWAY, UNITED KINGDOM
CHILE 0.72 0.88
2001 2
R (a1=2 or a10 =2)
HUNGARY, KOREA, MALAYSIA, ITALY, CZECH REPUBLIC, MEXICO, BRAZIL, GREECE, PORTUGAL, THAILAND MAINLAND CHINA 0.72 0.90 2003 2 R (a1=2 or a8 =2)
CHILE, SPAIN, JAPAN, HUNGARY, KOREA, ITALY, CZECH REPUBLIC, ISRAEL, SOUTH-AFRICA, THAILAND COLOMBIA, MAINLAND CHINA 0.70 0.67 G2 2005 2 R (a1=2 or a8 =2)
SPAIN, MALAYSIA, HUNGARY, THAILAND, INDIA, PORTUGAL, KOREA, CZECH REPUBLIC
MAINLAND CHINA, FRANCE 0.72 0.8 2001 1 R 2 1 and 3 2
a = a ≤ COLOMBIA, TURKEY, INDIA, PHILIPPINES, RUSSIA, POLAND, SOUTH-AFRICA, ARGENTINA, INDONESIA, VENEZUELA, 0.85 1 2003 1 R a2 =1 and a3≤2
INDIA, TURKEY, PHILIPPINES, BRAZIL, MEXICO, RUSSIA, ARGENTINA, INDONESIA, VENEZUELA PORTUGAL, GREECE, POLAND 0.88 0.75 G1 2005 1 R 2 1 and 3 2
a = a ≤ COLOMBIA, TURKEY, PHILIPPINES, BRAZIL, MEXICO, RUSSIA,
POLAND, ARGENTINA, INDONESIA, VENEZUELA, SOUTH-AFRICA
ITALY, GREECE
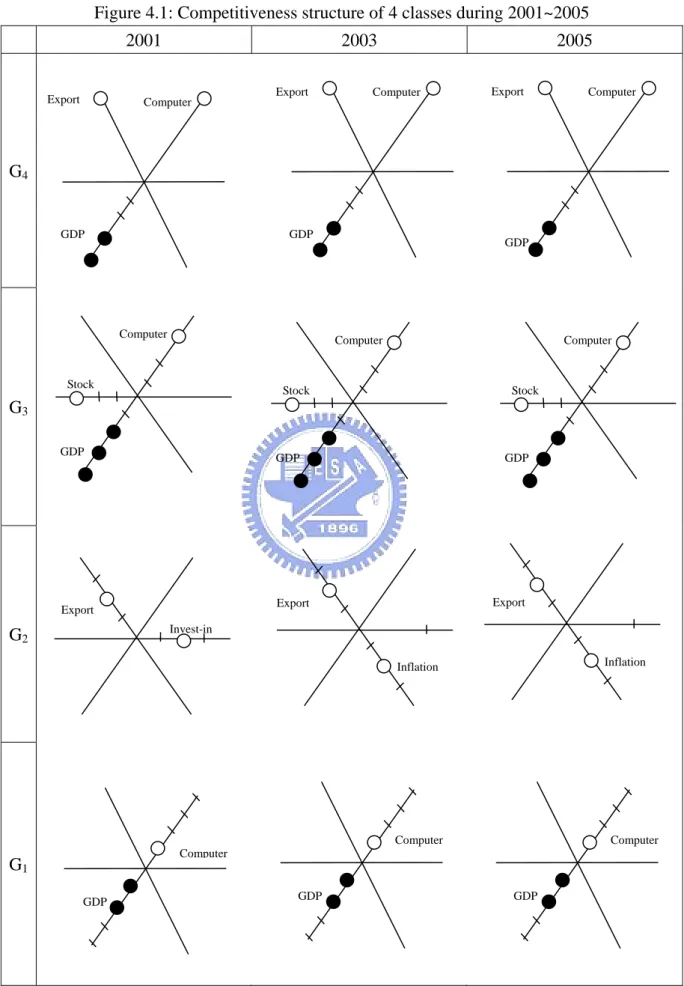
Table 4.1 shows that 6 most significant attributes in the induced rules. The rules in Table 4.1
can also be expressed graphically in Figure 4.1. Here we use 6 axes to express 6 key attributes
included in the induced rules. They are a1 (EXPORT), a2 (COMPUTER), a3 (GDP), a5
(STOCK), a8 (INFLATION), and a10 (FDI). Each axis is denoted by 4 segments which
express the 4 levels of an attribute. A full dot at the segment of an axis means ”necessary
conditions” of supporting the rule, while a hollow-dot means ”sufficient conditions” of
supporting rules. For instance, 3 attributes (a1, a2, a3) are used to describe
2001 4
R where a3
(GDP) ≥ 3 is a necessary condition and (a1 = 4 or a2 = 4) is the sufficient condition. Both of
them are conjunctively connected to support the ruleR42001. Examining Table 4.1 and Figure 4.1, the induced rules are analyzed below:
(i) GDP (a3) plays a critical role in formulating classes. If a nation wants to be highly
competitive, it should have GDP ≥ 3 during 2001-2005. On the other hand, if a nation is
at the worst level (GDP=1), then it is very likely to belong to a non-competitive or a
least-competitive class. That means GDP is the fundamental attribute of competitiveness.
(ii) Computers (a2), indicating the level of technology infrastructure, is an essential attribute
of competitiveness. For example, if a nation’s a2 is 4 or 3 then this nation quite possibly
belongs to a highly competitive or competitive class. On the contrary, if a nation’s
computers are restricted to a low level (i.e., a2 = 1) then the nation’s competitiveness is
limited to the least competitive class (i.e., G1).
(iii) Export (a1), which shows a nation’s comparative advantage and its ability to globalize, is
another critical attribute of competitiveness. In the same way of a2, a1 = 4 is another
sufficient condition for a nation to be highly competitive. From the point of view of
enhancing competitiveness, if a least competitive nation wants to upgrade as a
non-competitive nation, one potential way is to improve its export volume to level 2 (i.e.
not want to fall into the least competitive, it should prevent its inflation from being at a
low level.
(v) Stock (a5) can reflect business ability and nations’ competitiveness from the standpoint
of globalization. Foreign capital investment gives rises of international collaboration and
globalization. A competitive nation had better to keep its stock market capitalization
level higher than or equal to three (i.e. a5 ≥ 3).
(vi) FDI (a10) carries capital and technology to help nations to promote their competitiveness.
For a nation of the least competitive class to move up to a noncompetitive class, it needs
to enhance its Foreign Direct Investment or its export volume (i.e. to let a10 = 2 or a1 =
2).
(vii) All R12001, R12003, andR12005 rules indicate that a nation may stay in the least competitive class due to its lower GDP (a3 ≤ 2) and lowest Computer hosts (a2 = 1).
(viii)R22001, R22003, andR22005rules for the non-competitive class show that inflation (a8) has
Figure 4.1: Competitiveness structure of 4 classes during 2001~2005 2001 2003 2005 G4 G3 G2 G1 GDP Stock Computer Invest-in Export Export Inflation Export Inflation GDP Stock Computer GDP Stock Computer GDP Computer GDP Computer GDP Computer Computer Export Computer Export
GDP
Computer
GDP GDP
From the basis of the induced rules of forming 4 classes in Table 4.1, here we induce
dynamic rules for forming 18 various competitive groups listed in Table 2.2. There are 4 types
of competitive groups: sustaining type, upward type, downward type, and mixed type
described in the following.
4.2 Dynamic Rules of Sustaining Groups
There are 4 groups in sustaining type. Each group has 3 same classes for 2001, 2003, and
2005. Take R444 for instance, R444 is the rule for forming G4 class in all 2001, 2003, and 2005,
which is expressed as
444
R =R12001(4)∧R12003(4)∧R12005(4) = (a3 ≥3) ∧ (a1 =4∨a2 =4)
Twelve nations are covered by this rule, where AR = 0.94 and CR = 1. Similarly,
333
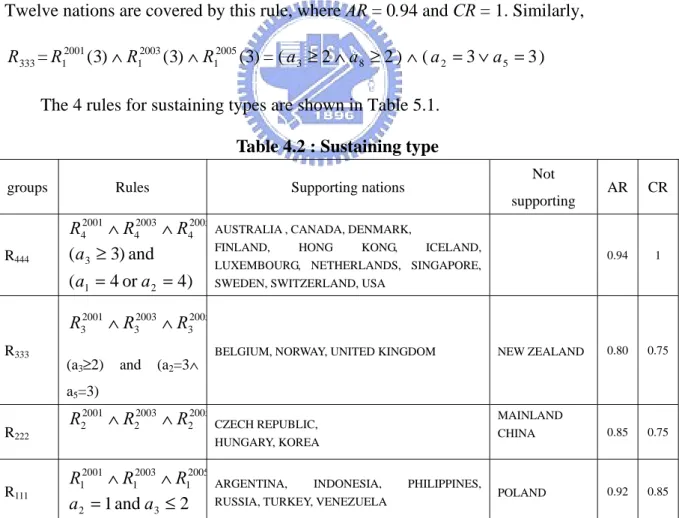
R =R12001(3)∧R12003(3)∧R12005(3)= (a3 ≥2∧a8 ≥2) ∧ (a2 =3∨a5 =3) The 4 rules for sustaining types are shown in Table 5.1.
Table 4.2 : Sustaining type
groups Rules Supporting nations Not
supporting AR CR R444 2005 4 2003 4 2001 4 R R R ∧ ∧ ) 4 or 4 ( and ) 3 ( 2 1 3 = = ≥ a a a
AUSTRALIA , CANADA, DENMARK,
FINLAND, HONG KONG, ICELAND, LUXEMBOURG, NETHERLANDS, SINGAPORE, SWEDEN, SWITZERLAND, USA
0.94 1 R333 2005 3 2003 3 2001 3 R R R ∧ ∧ (a3≥2) and (a2=3∧ a5=3)
BELGIUM, NORWAY, UNITED KINGDOM NEW ZEALAND 0.80 0.75
R222 2005 2 2003 2 2001 2 R R R ∧ ∧ CZECH REPUBLIC, HUNGARY, KOREA MAINLAND CHINA 0.85 0.75 R111 2005 1 2003 1 2001 1 R R R ∧ ∧ 2 and 1 3 2 = a ≤ a
ARGENTINA, INDONESIA, PHILIPPINES,
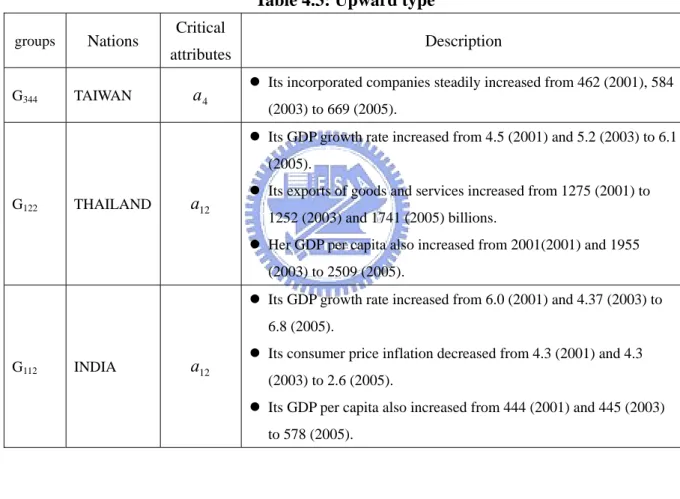
4.3 Dynamic Rules of Upward Groups
The rules for the upward groups are described in Table 5.2 and significant attributes are
illustrated in Figure 4.2. Only 3 nations are included in this type, where Taiwan belongs to
G334, THAILAND belongs to G122, and INDIA belongs to G112. These nations benefit from an
increase of GDP growth rate. However, TAIWAN is an exception, which only has growth in
the number of incorporated companies. The 14 attributes cannot clearly explain this case.
Table 4.3: Upward type groups Nations Critical
attributes Description
G344 TAIWAN a4
z Its incorporated companies steadily increased from 462 (2001), 584 (2003) to 669 (2005).
G122 THAILAND a12
z Its GDP growth rate increased from 4.5 (2001) and 5.2 (2003) to 6.1 (2005).
z Its exports of goods and services increased from 1275 (2001) to 1252 (2003) and 1741 (2005) billions.
z Her GDP per capita also increased from 2001(2001) and 1955 (2003) to 2509 (2005).
G112 INDIA a12
z Its GDP growth rate increased from 6.0 (2001) and 4.37 (2003) to 6.8 (2005).
z Its consumer price inflation decreased from 4.3 (2001) and 4.3 (2003) to 2.6 (2005).
z Its GDP per capita also increased from 444 (2001) and 445 (2003) to 578 (2005).
Figure 4.2 Critical attributes of upward type
G1 G2
↑a12
4.4 Dynamic Rules of Downward Groups
The downward type is described in Table 4.4 and significant attributes are illustrated in
Figure 4.3. Most nations in the downward type (AUSTRIA, GERMANY, FRANCE, SPAIN,
and ITALY) suffered from the increase in the unemployment rate (a9). Some competitive
nations (GERMANY, FRANCE, SPAIN, ITALY, and BRAZIL) are affected by a decrease in
the GDP growth rate (a12). Some nations (SPAIN, ITALY, and GREECE) have lost
competitiveness due to continuously borrowing money from foreign nations (a13).
Table 4.4 : Downward type groups Nations Critical
attributes Description
G443 AUSTRIA a12
z Its GDP growth rate decreased from 3.3 (2001) to 0.5 (2003) and 2 (2005). There are negatives of soft data from Global Competitiveness Report about her most problematic attributes such as tax regulations, corruption, and access to financing, and inefficient government bureaucracy. G433 GERMANY 12 a 9 a
z Its GDP growth rate decreased from 3.2 (2001) to 0.1 (2003) and 1.6 (2005).
z Its foreign direct investment decreased from 631 (2001) to 381 (2003) and -592 (2005) billions.
z Its unemployment rate increased from 7.7 (2001) to 8.2 (2003) and 9.5 (2005). G332 FRANCE 12 a 9 a
z Its GDP growth rate decreased from 3.2 (2001) to 0.1 (2003) and 1.6 (2005).
z Its er unemployment rate started at 9.7 (2001), 8.7 (2003) and up to 9.6 (2005).
z Her current account balance decreased from 373 (2001) and 459 (2003) to -108 (2005) billions. G322 SPAIN 12 a 9 a 13 a
z Its GDP growth rate decreased from 4 (2001) to 2 (2003) and 2.7 (2005). z Its unemployment rate has been keeping high as 14.1 (2001), 11.4
(2003) and 10.8 (2005).
z Its current account balance is extremely negative as -380 (2001), -379 (2003) and -1113 (2005) billions.
9
a
13
a
(2005).
z Its unemployment rate has been keeping high as 10.8 (2001), 9 (2003) and 8 (2005).
z Its current account balance has been keeping negative for -75 (2001), -116 (2003) and -189 (2005) billions.
BRAZIL a8
9
a
z Its unemployment rate has been keeping high as 9.6 (2001), 10.5 (2003) and 11.48 (2005).
z Its consumer price inflation has been keeping high as 5.97 (2001), 12.5 (2003) and 7.6 (2005)
GREECE 13
a
9
a
z Its current account balance has been extremely negative as -379 (2001), -775 (2003) and -1001 (2005) billions.
z Its unemployment rate has been keeping high as 11.4 (2001), 10 (2003) and 9.1 (2005).
G211
MEXICO a8
13
a
z Its consumer price inflation has been keeping high as 9.49 (2001), 5.06 (2003) and 5.2 (2005)
z Its current account balance has been keeping negative -172 (2001), -147 (2003) and -84 (2005) billions.
Figure 4.3: Critical attributes of downward type
G4 G3 ↓a9, ↓a12 G2 G1 ↓a9, ↓a12, ↓a13 ↓a8, ↓a9 ↓a13
Chapter 5 Displaying National Competitiveness on
Spheres
Nations covered by rules of Table 4.1 are displayed on spheres in this chapter. A visual
differentiation of nations is presented to enhance readability of the induced rules. The
displaying method consists of 3 steps, which are data normalization, data conversion, and
transformation, as shown in Figure 5.1.
5.1 Proposed Displaying Method
Figure 5.1: The process of displaying method
Competitiveness Factors Dissimilarity Normalized Factors Competitiveness Classes Coordinators of Nations on Sphere Step 1 Data Normalization Induced Rules Step 2 Data Conversion Step 3 Data Transformation
In our design the first two steps are preprocessing steps that generate dissimilarity
between nations. The last step transforms the dissimilarity into coordinates of nations on a
sphere. An example (Example 2) is illustrated with data and implementation below.
This example randomly selects 11 nations covered by two induced rules for 2005 from
Table 4.1. Consider a data set in Table 5.1 with 11 nations (N1, N 2, …, N 10, N 11), 4 factors (f1, f2, f3, f4) and 1 class indicator g. The domain values of f1, f2, f3, and f4 are continuous numbers,
which are retrieved from Table E.1 in Appendix E. The domain value of g is {4, 2}. For
instance, N11 (USA) is expressed as N11= (62.72, 100.00, 84.00, 95.46) and g11 = 4.
Based on the Table 5.1, the steps of display method are illustrated in following sections.
5.2 Data Normalization
The normalizing function puts different measures of factors into the same scale [0, 1]. It
is formulated as , , * for 1,.., 45; 1,..., 4 (5.1) i j j i f j j j f f s w i j f f − = = = − − − − − − − − − − − − − − − −
Table 5.1: Data set of Example 2
Nations f1 f2 f3 f4 g N1 Australia 73.39 53.03 78.62 65.05 4 N 2 Canada 69.97 57.92 72.50 72.37 4 N 3 Denmark 74.34 46.97 77.07 73.99 4 N 4 Finland 75.87 46.08 75.66 75.09 4 N 5 France 38.63 58.94 37.46 63.96 2 N 6 India 42.83 56.85 53.34 25.38 2 N 7 Korea 47.57 42.48 49.21 59.88 2 N 8 Malaysia 51.22 59.53 51.11 43.69 2 N 9 Spain 47.81 50.82 34.31 46.96 2 N 10 Taiwan 60.19 54.19 77.19 63.89 4 N 11 USA 62.72 100.00 84.00 95.46 4