Body mass index and all-cause mortality among middle-aged and older adults in Taiwan: A population-based cohort study
Running Title: BMI and all-cause mortality
1 Department of Internal Medicine, Taichung Hospital, Ministry of Health and Welfare, Taichung, Taiwan
2 Department of Healthcare Administration, Central Taiwan University of Science and Technology, Taichung, Taiwan
3 Department of Internal Medicine, Taoyuan Hospital, Ministry of Health and Welfare, Taoyuan, Taiwan
4 Department of Family Medicine, Taichung Hospital, Ministry of Health and Welfare, Taichung, Taiwan
5 School of Public Health, Chung-Shan Medical University, Taichung, Taiwan Words count in text: 2506
* Wei-Sheng Chung, MD, PhD (Correspondence)
Taichung Hospital, Ministry of Health and welfare, Taichung, Taiwan No. 199, Sec. 1, San-Min Road, Taichung City 40343, Taiwan
E-mail: [email protected]
Tel: +886-4-22294411 ext 5503; Fax: +886-4-22290020 * Chih-Jung Yeh, PhD (Correspondence)
Room 1237, No.110, Sec.1, Jianguo N. Road, Taichung City 40201, Taiwan
E-mail: [email protected]
Tel: +886-4-24730022 ext 12183; Fax: +886-4-23248179 1 2 3 4 5 6 7 8 9 10 11 12 13 14 15 16 17 18 19 20 21 22 23 24 25 26 27
Abstract
Objective: This study investigates the relationship between body mass index (BMI)
and all-cause mortality among middle-aged and older adults with or without preexisting diseases.
Design: A population-based cohort study
Setting: The Taiwan Longitudinal Study on Aging is a nationwide prospective cohort
study comprising a representative random sample of middle-aged and older adults. The study period was 1996-2007.
Subjects: We followed 4145 middle-aged and older adults, totaling 42353
person-years.
Results: Overweight and mild obese participants showed a 16% and 30% decrease in the risk of death compared to those of normal weight after adjusting for potential covariates (eg, demographic characteristics, health behavior, comorbidities, and physical function). Underweight adults showed a 1.36-fold increased adjusted hazard ratio (HR) of death compared to normal weight adults. Adults with a BMI of 27-28 showed significant lower adjusted HR of all-cause mortality rate compared to adults who had normal BMI values when they coexisted with hypertension or diabetes (adjusted HR = 0.50, 95% CI = 0.30-0.81 for hypetensives and adjusted HR = 0.41, 95% CI = 0.18-0.89 for diabetes).
Conclusion: This study demonstrates that underweight people have a higher risk of
death, and overweight and mild obese people have a lower risk of death compared to
people with normal weight among middle-aged and older adults. An optimal BMI may be based on the individual, who exists a preexisting disease or not.
Keywords: body mass index (BMI), mortality, middle-aged and older adults,
prospective cohort study
28 29 30 31 32 33 34 35 36 37 38 39 40 41 42 43 44 45 46 47 48 49 50 51 52 53
Background
The prevalence of overweight and obesity is progressively increasing worldwide.
Overweight and obesity are major risk factors for numerous comorbidities.3 However,
the effects of overweight and obesity on the risk of death are controversial. Jee et al
showed that underweight, overweight, and obese men and women have higher death
rates than men and women with normal body weight.4 Flegal et al performed a
systematic review and meta-analysis, and reported a significantly higher all-cause
mortality risk for obesity compared to people with normal weight, especially for
Grade 2 and Grade 3 obesity. Mortality was significantly lower among overweight
people compared with people of normal weight.5 Overweight refers to an excess
amount of body weight that may come from muscles, bone, fat, and water. Obesity
refers to an excess amount of body fat.
The body mass index (BMI) is a simple index of weight to height that is
commonly used to classify overweight and obesity in adults. It is calculated as a
person’s weight in kilograms divided by the square of his or her height in meters
(kg/m2). The World Health Organization (WHO) and National Heart, Lung, and
Blood Institute (NHLBI) have defined 4 weight groups: underweight (BMI < 18.5),
normal weight (18.5 ≦ BMI < 25), overweight (25 ≦ BMI < 30), and obese (BMI ≧ 30).6 Because of differences in body size among various ethnic groups, the WHO
54 55 56 57 58 59 60 61 62 63 64 65 66 67 68 69 70 71 72
proposed that Asian adults with a BMI ≧ 23 and < 25 are considered overweight, and those with a BMI ≧ 25 are considered obese.7 The Department of Health (DOH) in
Taiwan further classified adults as underweight (BMI < 18.5), of normal weight
(18.5≦ BMI < 24), overweight (24 ≦ BMI < 27), mildly obese (27 ≦ BMI < 30), moderately obese (30 ≦ BMI < 35), and severely obese (35 ≦ BMI).8
The government is dedicated to a weight control program for Taiwanese citizens,
and initiated a nationwide weight-loss promotion campaign in 2011.9 This campaign
has attracted over 720000 Taiwanese citizens, resulting in a total weight loss of 1100
tons by the end of 2012.10 As more people, including elderly people, are becoming
overweight or obese, weight loss is recommended to improve one’s health. Health
risks are lowered in overweight children and adults by dieting and exercise. However,
the health benefits of weight loss in elderly people, particularly by calorie restriction,
are uncertain. Jee et al demonstrated that underweight men and women had a higher
risk of death than those of normal weight.4 Abhyankar et al found that overweight and
obesity may be positive factors, and found improved survival rates both 30 days and 1
year after intensive care unit treatment.11 Beleigoli et al showed that overweight (BMI
25-30) is inversely associated with mortality in older Brazilian adults.12 Deurenberg et
al showed that the relationship between body fat percentage and BMI varied among
racial groups.13 Based on the inconsistency of the results regarding the relationship
73 74 75 76 77 78 79 80 81 82 83 84 85 86 87 88 89 90 91
between body weight and mortality among various groups, we investigated whether
the normal BMI cutoff point is suitable for middle-aged and older adults regarding
all-cause mortality. Methods
Study participants
A population- based longitudinal cohort study, the survey of Health and Living
Status of the Elderly in Taiwan (SHLSET), renamed the Taiwan Longitudinal Study
on Aging (TLSA), with a nationwide representative random sample of middle-aged
and older adults, was conducted in 1989, with follow-ups in 1993, 1996, 1999, 2003,
and 2007. Details of the TLSA study design have been published.14 The data used in
this study were retrieved from the TLSA, which was funded by the U.S. National
Institute of Aging, the Taiwan Bureau of Health Promotion, and the Population
Studies Center at the University of Michigan. Data files that identified people were
encrypted, and the identification was removed.
The study participants were recruited at baseline in 1996, and followed up in
1999, 2003, and 2007. Participants who passed away in the first 3 years of follow-up
were excluded, as were participants who provided incomplete age or sex information.
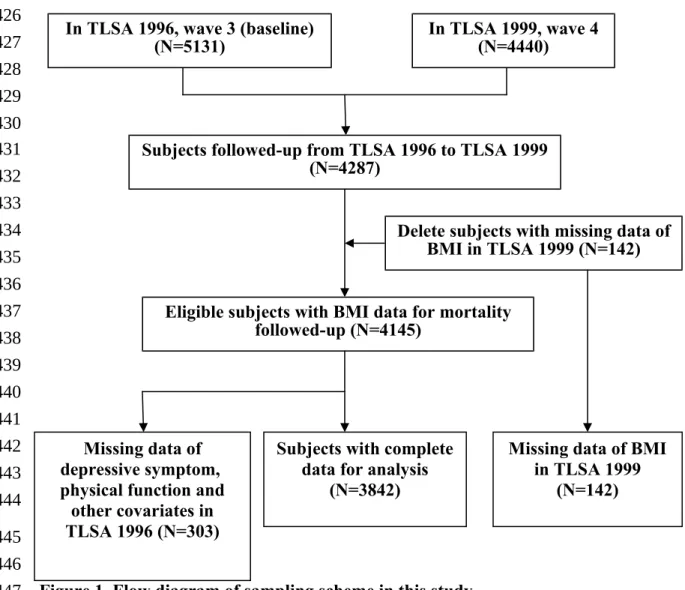
Patients who were not followed up were also excluded. (Figure 1)
Outcome measurement
The outcome measurement included all-cause mortality for the study participants 92 93 94 95 96 97 98 99 100 101 102 103 104 105 106 107 108 109 110 111
during the follow-up periods. The follow-up person-years were estimated for the
study participants from the index date until death or until the end of 2007.
Exposure measurement
Exposure variables comprised demographic variables, comorbid medical illness, physical function, and depression status. Demographic variables included age, age cohort (50-64 y and ≧ 65 y), sex, ethnicity, education level, marital status, smoking status, alcohol consumption, and BMI.
Ethnicity was categorized as Fu-Kien, Hakka, Mainlander, and Other. Education
levels were divided into illiterate (0 y of education), elementary school (1- 6 y), junior
to senior high school (7- 12 y), or college degree and above (>12 y). Marital status
was entered as a dichotomous variable: with spouse (living with spouse or
companion) or without spouse (not married, widowed, divorced, or separated).
Smoking status was dichotomized as current user and current non-user. Alcohol consumption was also dichotomized as heavy drinking (more than 30 g of alcohol a day) and not heavy drinking. BMI was calculated from self-reported weight and height and categorized as underweight (BMI < 18.5), normal (18.5 ≦ BMI < 24), overweight (24 ≦ BMI < 27), or obese (BMI ≧27), according to the Taiwan DOH guidelines. We further categosized obesity into BMI of 27-28, BMI of 28-29, and
BMI more than 29. Comorbidities were based on records of self-reported chronic 112 113 114 115 116 117 118 119 120 121 122 123 124 125 126 127 128 129 130
diseases that may affect mortality (hypertension, diabetes, heart diseases, stroke,
cancer, and lung diseases).
The physical function variable included 8 items for the assessment of mobility
limitations: (1) ability to stand for 15 minutes, (2) ability to squat, (3) ability to reach
overhead, (4) ability to grasp with the fingers, (5) ability to carry a weight of 11 kg,
(6) ability to run 20 to 30 m, (7) ability to walk 200 to 300 m, and (8) ability to walk
up 2 to 3 flights of stairs. Limitations in the performance of each mobility task were
rated (0 = not at all, 1 = mild, 2 = moderate, 3 = severe). A higher score indicated a
higher level of difficulty.
Depression status was measured by the 10-item Center for Epidemiologic
Studies Depression Scale (CES-D).15 A summary of the depression status scores
(range: 0 - 30) was created from the sum of the responses to the 10 items in the scale.
A total score equal to or higher than 8 was defined as depression.16
Statistical analysis
We described baseline participant characteristics of the total population, the
surviving group, and the deceased group. Associations of the categorical risk factors
of mortality were compared using the chi-square test. Student’s t-test was performed
to identify the differences in the continuous variables between the surviving and
deceased groups. Multivariable Cox proportional-hazards regression models were
used to calculate the hazard ratios (HRs) and 95% confidence intervals (CIs) with 131 132 133 134 135 136 137 138 139 140 141 142 143 144 145 146 147 148 149 150
stratification based on BMI, marital status, smoking habit, alcohol consumption, the
number of comorbidity, depression status, and physical function. We further used
multivariable Cox proportional-hazards regression models to examine the relationship
between BMI and mortality, and investigated the optimal BMI cutoff point for
participants with and without preexisting diseases, including those who presented with
hypertension, coronary heart disease, diabetes, depression, and health. Adjusted
potential confounders included sociodemographic variables, spouse status,
health-related behavior, comorbidity, depression, and physical functional. To model the
relationships of the follow-up years and all-cause mortality among the 4 BMI
categories, we used the LIFETEST component (the Kaplan-Meier estimator) of the
SAS software package. All statistical analyses were performed using SAS (SAS
Institute, Cary, NC), version 9.2. All statistical tests were two-tailed, and the
significance level was set at .05. Results
Demographic characteristics of the study participants in 1996
A total of 4145 middle-aged and older adult cases were followed, totaling 42353
person-years. Of these, 2208 (53.3%) were men, and 1937 (46.7%) were women.
During the follow-up period, 1263 (30.5%) participants passed away. The deceased
group was significantly older at death than the surviving group (71.6 ± 8.6 y vs 151 152 153 154 155 156 157 158 159 160 161 162 163 164 165 166 167 168 169
62.9±8.1 y). A significantly lower proportion of women passed away during the
follow-up period than men did (25.9% vs 34.5%). Race did not appear to be a factor
in the risk of death. More educated participants had significantly lower death rates.
Participants with spouses had significantly lower death rates than those who did not
have spouses (25.9% vs 42.8%). Participants who smoked had significantly higher
death rates than those who did not smoke (35.5% vs 28.6%). Participants who
consumed alcohol had significantly lower death rates than those who did not consume
alcohol (25.5% vs 31.9%). Regarding the relationship between BMI categories and
all-cause mortality, obesity had lower death rates than overweight, normal, and
underweight participants (obese: 21.7% , overweight: 25.4%, normal: 32.4%, and
underweight: 53.3%) (Table 1).
Relationship between BMI and all-cause mortality and comorbidities
Table 2 shows that the participants with higher BMI values had lower all-cause
mortality rates. The most common comorbidities among the middle-aged and older
adults were depression status, hypertension, heart disease, and diabetes (27.6%,
25.6%, 14.0%, and 9.9%, respectively). The adults with higher BMI values had lower
rates of depression. Participants with higher BMI values had higher rates of
hypertension and diabetes. In general, participants with higher BMI values had more
comorbidity. Higher levels of physical function impairment appeared in participants 170 171 172 173 174 175 176 177 178 179 180 181 182 183 184 185 186 187 188
who were underweight and obese.
Factors influencing the all-cause mortality of middle-aged and older adults
Model A1 showed that underweight participants had a 1.35-fold higher risk of
death compared to those of normal weight, after adjusting for demographic variables.
Obese participants had a 20% lower risk of death compared to participants with
normal weight, after adjusting for demographic variables. Participants with a spouse
had a 15% lower risk of death compared to participants without a spouse, after
adjusting for demographic variables. Current smokers had a 1.26-fold higher risk of
death compared to non-smokers, after adjusting for demographic variables.
Participants who consumed alcohol had a decrease in adjusted HR of death compared
to those that did not consume alcohol. Considering comorbidities in Model B1, we
found that underweight participants still had a 1.45-fold higher risk of death compared
to those of normal weight. Overweight and obese participants had 14% and 26%
decreased risks of death compared to participants of normal weight, after adjusting for
demographic variables and comorbidities. Participants had a 1.35-fold increase in
adjusted HR of death if they had an additional comorbidity. Participants who were depressed had a 1.20-fold higher risk of death compared to those who were not
depressed, after adjusting for demographic variables and comorbidities. Model C, a
full model, showed that underweight participants had a 1.36-fold higher risk of death 189 190 191 192 193 194 195 196 197 198 199 200 201 202 203 204 205 206 207
compared to those of normal weight, after adjusting for demographic variables,
comorbidities, and physical function impairment. Overweight and obese participants
had a 16% and 30% decrease in adjusted HR of death respectively, compared to those
of normal weight. Furthermore, we analyzed subgroup of obesity in model C1 and
found that BMI of 27-28 exhibibted a 50% decrease in adjusted HR of death
compared to that of normal weight. Current smokers had a 1.32-fold adjusted HR of death compared to non-smokers. Participants had a 1.28-fold increase in adjusted HR
of death if they had an additional comorbidity. Participants had a 3.79-fold increase in
adjusted HR of death per increased standard score of physical function impairment
(Table 3).
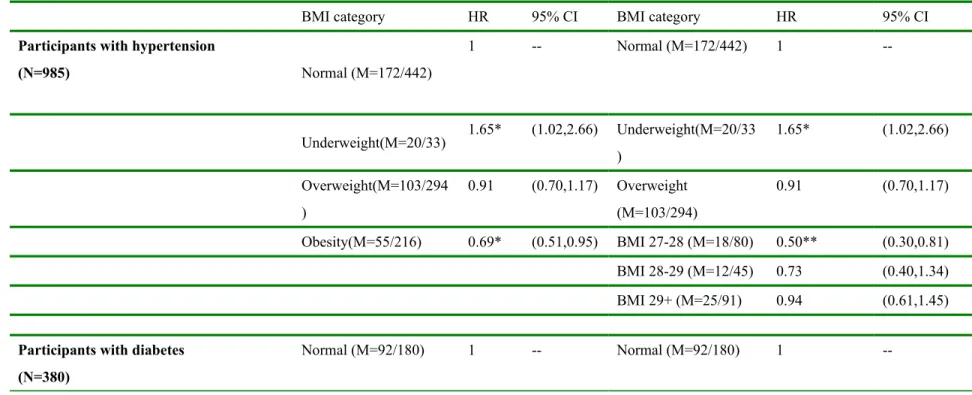
Relationship between BMI category and all-cause mortality among participants with or without a preexisting disease
Among participants with preexisting hypertension, underweight individuals
exhibited a 1.65-fold greater adjusted HR of death than did the people with normal weight. Obese people exhibited a 31% decrease in adjusted HR of death compared with that of normal weight. We further found that obese participants with a BMI of 27 to 28 had a 50% decrease in adjusted HR of death compared to those of normal
weight. Among the participants with preexisting diabetes, obese participants with a
BMI of 27 to 28 had a 59% decrease in adjusted HR compared to those of normal 208 209 210 211 212 213 214 215 216 217 218 219 220 221 222 223 224 225 226
weight. Among the participants without any comorbidity, underweight participants
had a 1.55-fold adjusted HR of death compared to those of normal weight (Table 4).
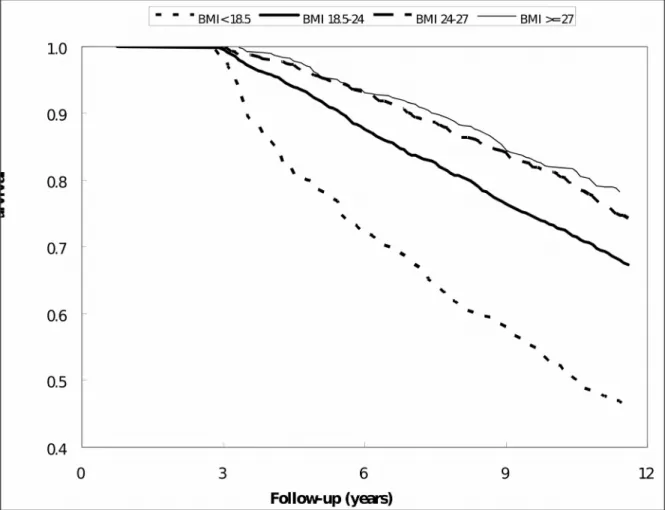
Relationships of follow-up years and survival among the 4 BMI categories
Underweight participants had a significantly lower survival rate compared to
normal weight, overweight, and obese participants during follow-up. Conversely,
obese participants had a higher survival rate compared to other weight groups during
follow-up (Figure 2). Discussion
We investigated the relationship between all-cause mortality in middle-aged and
older adults and current standard BMI categories used in Taiwan in a nationwide
prospective cohort study. Participants with obesity had a 33% lower risk of death
compared to those of normal weight, after adjusting for demographic variables,
smoking status, comorbidities, and physical function. This study demonstrates that
BMI, whether alone or adjusted for covariates, is inversely related to mortality among
middle-aged and older adults, which is consistent with previous studies.
Previous studies have demonstrated a strong relationship between BMI and total body
fat. BMI may not only be a good marker of adiposity in elderly people, but may also
indicate that adiposity offers some protection against fatal diseases. The possible
biological mechanisms that explain this “obesity survival paradox” in elderly people
may be associated with a lower rate of bone mass loss, which reduces the effects of 227 228 229 230 231 232 233 234 235 236 237 238 239 240 241 242 243 244 245 246
fall and trauma episodes, and greater nutritional reserves to accommodate periods of
acute stress. Hong et al indicated that Good prognosis among the overweight or obese
elderly may reflect the relative safety of storing the lipophilic chemicals in adipose tissue rather than in other critical organs.25
It is important to consider preexisting diseases when investigating the
relationship between BMI and all-cause mortality for middle-aged and older adults.
Because a lower BMI may be the result, not the cause, of preexisting diseases,
comorbidities at baseline can result in reverse causation. Table 2 shows that
participants with higher BMI values had higher rates of hypertension and diabetes.
However, Table 3 shows that the effect of obesity on the risk of death remained
protective, after adjusting for comorbidities and symptoms of depression. This
accentuates the effect of obesity on the lower risk of all-cause mortality, after
adjusting for comorbidities, symptoms of depression, and physical function
impairment. Conversely, underweight participants had a 1.36-fold higher risk of death
compared to participants of normal weight, after adjusting for covariates.
Previous studies have shown that total mortality has a J- or U-shaped relationship
with BMI. Mortality rates increase sharply at BMI values of less than 18.5 and greater
than 30. However, previous research has not clearly defined the optimal BMI values
for various age groups, with or without preexisting diseases, based on all-cause 247 248 249 250 251 252 253 254 255 256 257 258 259 260 261 262 263 264 265
mortality. Our study showed that obese participants with a BMI of 27 to 28 had the
lowest all-cause mortality rate compared to normal BMI values when obese
participants had hypertension or diabetes. In addition, people with higher BMI values
had a lower rate for depression in our study. The finding is consistent with relatively fewer depressive symptoms among the obese population and a “jolly fat” hypothesis in Chinese elderly.
This nationwide longitudinal cohort study of middle-aged and older adults
demonstrates that obesity is associated with a lower risk of death. We excluded deaths
in the first 3 years of follow-up to limit the possibility of reverse causation. We also
examined how a comprehensive assessment of baseline health status and physical
function affects the relationship between BMI and all-cause mortality. The results are
robust, and we used numerous models of multivariate logistic regression analysis and
Kaplan–Meier analysis for the decreased risk of death in obese people. However, our
study is restrained by some limitations for the following reasons. First, weight, height,
and comorbidities used self-reported information, which might result in biased estimation. The lack of drug data, health behaviors, and disease severity, which are potential confounding factors, may be a major limitation of the study.
In conclusion, this nationwide longitudinal study performed in Taiwan shows an
increased risk of death in underweight people and a decreased risk of death in 266 267 268 269 270 271 272 273 274 275 276 277 278 279 280 281 282 283 284
overweight and mild obese people compared to people with normal weight among middle-aged and older adults. For people with hypertension or diabetes, mild obese
participants with a BMI of 27 to 28 had a lower adjusted HR of all-cause mortality rate compared to normal BMI values. An optimal BMI may be based on the individual, who exhibits preexisting diseases or not.
285 286 287 288 289 290 291 292 293 294
References
1. de Onis M, Blossner M, Borghi E. Global prevalence and trends of overweight and obesity among preschool children. Am J Clin Nutr. Nov 2010;92(5):1257-1264.
2. Kanter R, Caballero B. Global gender disparities in obesity: a review. Adv Nutr. Jul 2012;3(4):491-498.
3. Guh DP, Zhang W, Bansback N, Amarsi Z, Birmingham CL, Anis AH. The incidence of co-morbidities related to obesity and overweight: a systematic review and meta-analysis. BMC Public Health. 2009;9:88.
4. Jee SH, Sull JW, Park J, et al. Body-mass index and mortality in Korean men and women. N Engl J Med. Aug 24 2006;355(8):779-787.
5. Flegal KM, Kit BK, Orpana H, Graubard BI. Association of all-cause mortality with overweight and obesity using standard body mass index categories: a systematic review and meta-analysis. JAMA. Jan 2
2013;309(1):71-82.
6. Kuczmarski RJ, Flegal KM. Criteria for definition of overweight in transition: background and recommendations for the United States. Am J Clin Nutr. Nov 2000;72(5):1074-1081.
7. WHO. The Asia-Pacific Perspective: Redefining Obesity and Its Treatment. Geneva, Switzerland:: WHO; 2000.
8. DOH. Identification, Evaluation, and Treatment of Overweight and Obesity in Adults in Taiwan.: Department of Health, the Executive Yuan, Taiwan; 2003. 9. The Republic of China Yearbook 2012. The Republic of China Yearbook:
Executive Yuan; 2012.
10. Bureau of Health Promotion DoH. Heathy centenary, healthy Taiwan. 2013. Accessed Jan 7th, 2013.
11. Abhyankar S, Leishear K, Callaghan FM, Demner-Fushman D, McDonald CJ. Lower short- and long-term mortality associated with overweight and obesity in a large cohort study of adult intensive care unit patients. Crit Care. Dec 18 2012;16(6):R235.
12. Beleigoli AM, Boersma E, Diniz Mde F, Lima-Costa MF, Ribeiro AL. Overweight and class I obesity are associated with lower 10-year risk of mortality in brazilian older adults: the bambui cohort study of ageing. PLoS One. 2012;7(12):e52111.
13. Deurenberg P, Yap M, van Staveren WA. Body mass index and percent body fat: a meta analysis among different ethnic groups. Int J Obes Relat Metab Disord. Dec 1998;22(12):1164-1171. 295 296 297 298 299 300 301 302 303 304 305 306 307 308 309 310 311 312 313 314 315 316 317 318 319 320 321 322 323 324 325 326 327 328 329 330 331
14. Hsu HC. Gender disparity of successful aging in Taiwan. Women Health. 2005;42(1):1-21.
15. Lee AE, Chokkanathan S. Factor structure of the 10-item CES-D scale among community dwelling older adults in Singapore. Int J Geriatr Psychiatry. Jun 2008;23(6):592-597.
16. Yen CH, Yeh CJ, Wang CC, et al. Determinants of cognitive impairment over time among the elderly in Taiwan: results of the national longitudinal study. Arch Gerontol Geriatr. Feb 2010;50 Suppl 1:S53-57.
17. Auyeung TW, Lee JS, Leung J, Kwok T, Leung PC, Woo J. Survival in older men may benefit from being slightly overweight and centrally obese--a 5-year follow-up study in 4,000 older adults using DXA. J Gerontol A Biol Sci Med Sci. Jan 2010;65(1):99-104.
18. Janssen I, Katzmarzyk PT, Ross R. Body mass index is inversely related to mortality in older people after adjustment for waist circumference. J Am Geriatr Soc. Dec 2005;53(12):2112-2118.
19. Storti KL, Brach JS, FitzGerald SJ, Bunker CH, Kriska AM. Relationships among body composition measures in community-dwelling older women. Obesity (Silver Spring). Feb 2006;14(2):244-251.
20. Taylor RW, Jones IE, Williams SM, Goulding A. Body fat percentages measured by dual-energy X-ray absorptiometry corresponding to recently recommended body mass index cutoffs for overweight and obesity in children and adolescents aged 3-18 y. Am J Clin Nutr. Dec 2002;76(6):1416-1421. 21. Chang SH, Beason TS, Hunleth JM, Colditz GA. A systematic review of body
fat distribution and mortality in older people. Maturitas. Jul 2012;72(3):175-191.
22. Singanayagam A, Chalmers JD. Obesity is associated with improved survival in community-acquired pneumonia. Eur Respir J. Jul 2013;42(1):180-187. 23. Bouillanne O, Dupont-Belmont C, Hay P, Hamon-Vilcot B, Cynober L,
Aussel C. Fat mass protects hospitalized elderly persons against morbidity and mortality. Am J Clin Nutr. Sep 2009;90(3):505-510.
24. Chapman IM. Obesity paradox during aging. Interdiscip Top Gerontol. 2010;37:20-36.
25. Hong NS, Kim KS, Lee IK, et al. The association between obesity and mortality in the elderly differs by serum concentrations of persistent organic pollutants: a possible explanation for the obesity paradox. Int J Obes (Lond). Sep 2012;36(9):1170-1175.
26. Flegal KM, Williamson DF, Pamuk ER, Rosenberg HM. Estimating deaths attributable to obesity in the United States. Am J Public Health. Sep
332 333 334 335 336 337 338 339 340 341 342 343 344 345 346 347 348 349 350 351 352 353 354 355 356 357 358 359 360 361 362 363 364 365 366 367 368 369
2004;94(9):1486-1489.
27. Hu FB, Willett WC, Stampfer MJ, Spiegelman D, Colditz GA. Calculating deaths attributable to obesity. Am J Public Health. Jun 2005;95(6):932; author reply 932-933.
28. Heymsfield SB, Cefalu WT. Does body mass index adequately convey a patient's mortality risk? JAMA. Jan 2 2013;309(1):87-88.
29. Orpana HM, Berthelot JM, Kaplan MS, Feeny DH, McFarland B, Ross NA. BMI and mortality: results from a national longitudinal study of Canadian adults. Obesity (Silver Spring). Jan 2010;18(1):214-218.
30. Pan WH, Yeh WT, Chen HJ, et al. The U-shaped relationship between BMI and all-cause mortality contrasts with a progressive increase in medical expenditure: a prospective cohort study. Asia Pac J Clin Nutr.
2012;21(4):577-587.
31. Li ZB, Ho SY, Chan WM, et al. Obesity and depressive symptoms in Chinese elderly. Int J Geriatr Psychiatry. Jan 2004;19(1):68-74.
32. Yu NW, Chen CY, Liu CY, Chau YL, Chang CM. Association of body mass index and depressive symptoms in a Chinese community population: results from the Health Promotion Knowledge, Attitudes, and Performance Survey in Taiwan. Chang Gung medical journal. Nov-Dec 2011;34(6):620-627.
370 371 372 373 374 375 376 377 378 379 380 381 382 383 384 385 386 387 388
Table 1. Comparison of demographic characteristics of the study participants between surviving groups and deceased groups during follow-up
characteristics in 1996 survived n=2719 deceased n=1123 p-value Person-year (total) 31322 8254 Follow-up (years) 11.5±0.3 7.3±2.5 <.0001 Age ( years) 62.8±8.0 71.0±8.3 <.0001 Gender <.0001 Female 1354(75.7%) 434(24.3%) Male 1365(66.5%) 689(33.5%) Ethnicity 0.0773 Fu-kien 1832(71.5%) 730(28.5%) Hakka 459(72.1%) 178(27.9%) Mainlander 392(66.8%) 195(33.2%) Other 36(64.3%) 20(35.7%) Education (years) <.0001 Illiterate 774(65.8%) 402(34.2%) Elementary school 1267(71.4%) 508(28.6%) Junior to High school 503(75.8%) 161(24.3%) College and above 175(77.1%) 52(22.9%)
Spouse <.0001 Without 610(59.6%) 4141(40.4%) With 2109(74.8%) 709(25.2%) Smoking <.0001 No 2033(72.7%) 762(27.3%) Yes 686(65.5%) 361(34.5%) Alcohol drinking 0.5134 Not heavy 2451(70.6%) 1020(29.4%) 389 390 391
Heavy 268(72.2%) 103(27.8%)
Body Mass Index <.0001
Underweight 123(50.4%) 121(49.6%)
Normal 1394(68.9%) 628(31.2%)
Overweight 779(75.0%) 260(25.0%)
Obesity 423(78.8%) 114(21.2%)
Underweight: BMI<18.5; normal: 18.5≦BMI<24; overweight: 24≦BMI<27; obesity: BMI≧27
392 393 394
Table2. The relationship between Body Mass Index categories and all-cause mortality, comorbidities, and physical function
Characteristics in 1996 total 18.5>BMI n=244 18.5 BMI ≦ <24 n=2022 24 BMI ≦ < 27 n=1039 27 BMI≦ n=537 p-value Ceased <.0001 No 2719(70.8%) 123(50.4%) 1394(68.9%) 779(75.0%) 423(78.8%) Yes 1123(29.25% ) 121(49.6%) 628(31.1%) 260(25.0%) 114(21.2%) Hypertension <.0001 No 2857(74.4%) 211(86.5%) 1580(78.1%) 745(71.7%) 321(59.8%) Yes 985(25.6%) 33(13.5%) 442(21.9%) 294(28.3%) 216(40.2%) Diabetes 0.0038 No 3462(90.1%) 230(94.3%) 1842(91.1%) 917(88.3%) 473(88.1%) Yes 380(9.9%) 14(5.7%) 180(8.9%) 122(11.7%) 64(11.9%) Heart disease 0.0024 No 3304(86.0%) 206(84.4%) 1764(87.2%) 899(86.5%) 435(81.0%) Yes 538(14.0%) 38(15.6%) 258(12.8%) 140(13.5%) 102(19.0%) Stroke 0.5327 No 3729(97.1%) 237(97.1%) 1956(96.7%) 1015(97.7%) 521(97.0%) Yes 113(2.9%) 7(2.9%) 66(3.3%) 24(2.3%) 16(3.0%) Cancer 0.4994 No 3805(99.0%) 241(98.8%) 2006(99.2%) 1029(99.0%) 529(98.5%) Yes 37(1.0%) 3(1.2%) 16(0.8%) 10(1.0%) 8(1.5%) Lung disease 0.2487 No 3508(91.3%) 217(88.9%) 1841(91.0%) 950(91.4%) 500(93.1%) Yes 334(8.7%) 27(11.1%) 181(9.0%) 89(8.6%) 37(6.9%) Depression status 0.0165 No 2783(72.4%) 161(66.0%) 1448(71.6%) 765(73.6%) 409(76.2%) 395 396
Yes 1059(27.6%) 83(34.0%) 574(28.4%) 274(26.4%) 128(23.8%)
Number of
diseases 0.62±0.85 0.50±0.77 0.57±0.82 0.65±0.88 0.82±0.90 <.0001 Physical
function 0.08±0.17 0.14±0.21 0.07±0.16 0.08±0.15 0.10±0.18 <.0001 Underweight: BMI<18.5; normal: 18.5≦BMI<24; overweight: 24≦BMI<27; obesity: BMI≧27 397
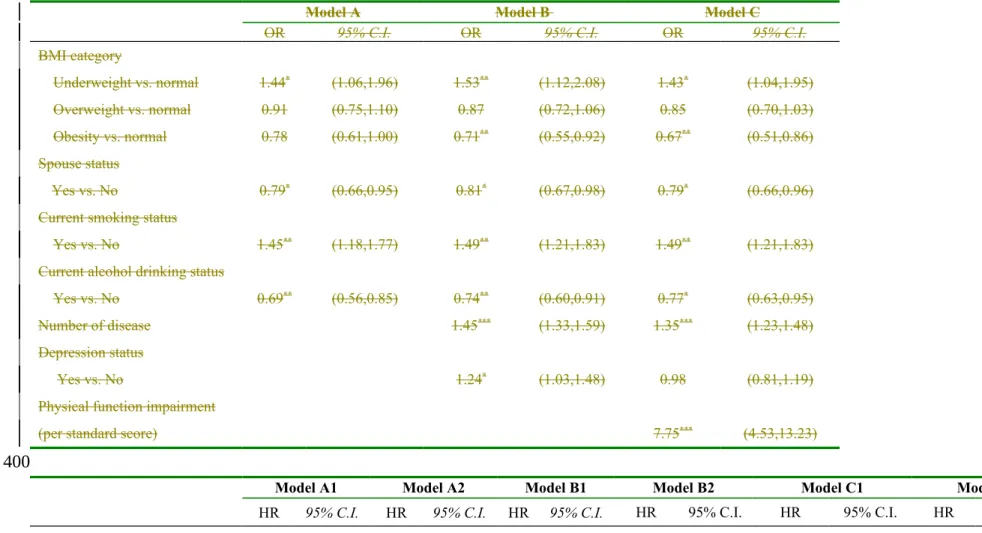
Table 3. Factors influencing all-cause mortality of middle-aged and older adults
Model A Model B Model C
OR 95% C.I. OR 95% C.I. OR 95% C.I.
BMI category Underweight vs. normal 1.44* (1.06,1.96) 1.53** (1.12,2.08) 1.43* (1.04,1.95) Overweight vs. normal 0.91 (0.75,1.10) 0.87 (0.72,1.06) 0.85 (0.70,1.03) Obesity vs. normal 0.78 (0.61,1.00) 0.71** (0.55,0.92) 0.67** (0.51,0.86) Spouse status Yes vs. No 0.79* (0.66,0.95) 0.81* (0.67,0.98) 0.79* (0.66,0.96)
Current smoking status
Yes vs. No 1.45** (1.18,1.77) 1.49** (1.21,1.83) 1.49** (1.21,1.83)
Current alcohol drinking status
Yes vs. No 0.69** (0.56,0.85) 0.74** (0.60,0.91) 0.77* (0.63,0.95)
Number of disease 1.45*** (1.33,1.59) 1.35*** (1.23,1.48)
Depression status
Yes vs. No 1.24* (1.03,1.48) 0.98 (0.81,1.19)
Physical function impairment
(per standard score) 7.75*** (4.53,13.23)
Model A1 Model A2 Model B1 Model B2 Model C1 Model C2
HR 95% C.I. HR 95% C.I. HR 95% C.I. HR 95% C.I. HR 95% C.I. HR 95% C.I.
BMI category 398
399
Underweight vs. normal 1.35** (1.11,1.65) 1.35** (1.11,1.64) 1.45***(1.19,1.77) 1.45*** (1.19,1.77) 1.36** (1.11,1.66) 1.36** (1.11,1.66) Overweight vs. normal 0.90 (0.77,1.04) 0.90 (0.77,1.04) 0.86* (0.74,1.00) 0.86* (0.74,1.00) 0.84* (0.72,0.97) 0.84* (0.72,0.97) 27-28 Obesity vs. normal 0.80* (0.65,0.97) 0.56** (0.39,0.80) 0.74** (0.60,0.90) 0.52*** (0.37,0.74) 0.70*** (0.57,0.85) 0.50*** (0.35,0.72) 28-29 0.89 (0.61,1.30) 0.85 (0.59,1.24) 0.79 (0.54,1.15) 29+ 1.00 (0.75,1.33) 0.91 (0.68,1.21) 0.85 (0.64,1.14) Spouse status Yes vs. No 0.85* (0.75,0.97) 0.85* (0.75,0.97) 0.87* (0.76,0.99) 0.87* (0.76,0.99) 0.88 (0.77,1.01) 0.88 (0.77,1.01)
Current smoking status
Yes vs. No 1.26** (1.09,1.46) 1.26** (1.09,1.46) 1.32***(1.14,1.53) 1.33*** (1.14,1.53) 1.32*** (1.14,1.53) 1.32*** (1.14,1.53)
Current alcohol drinking status
Light and moderate vs. No 0.76** (0.62,0.93) 0.76** (0.62,0.93) 0.82 (0.67,1.00) 0.82 (0.67,1.01) 0.86 (0.70,1.05) 0.86 (0.70,1.06)
Heavy vs. No 0.78* (0.63,0.96) 0.77* (0.62,0.96) 0.80* (0.65,1.00) 0.80* (0.65,1.00) 0.84 (0.68,1.05) 0.84 (0.68,1.05)
Number of disease 1.35***(1.27,1.44) 1.35*** (1.27,1.44) 1.28*** (1.20,1.36) 1.28*** (1.19,1.36)
Depression status
Yes vs. No 1.20** (1.06,1.37) 1.20** (1.06,1.37) 1.01 (0.88,1.16) 1.01 (0.88,1.16)
Physical function impairment
All models were age, gender, education level, and ethnicity adjusted; * p < .05, ** p < .01, *** p < .0001; underweight: BMI<18.5; normal: 18.5≦BMI<24; overweight: 24≦BMI<27; obesity: BMI≧27
401 402 403 404
Table 4. The relationship between BMI categories and all-cause mortality among participants with or without preexisting diseases
BMI category HR 95% CI BMI category HR 95% CI
Participants with hypertension
(N=985) Normal (M=172/442) 1 -- Normal (M=172/442) 1 --Underweight(M=20/33) 1.65* (1.02,2.66) Underweight(M=20/33 ) 1.65* (1.02,2.66) Overweight(M=103/294 ) 0.91 (0.70,1.17) Overweight (M=103/294) 0.91 (0.70,1.17) Obesity(M=55/216) 0.69* (0.51,0.95) BMI 27-28 (M=18/80) 0.50** (0.30,0.81) BMI 28-29 (M=12/45) 0.73 (0.40,1.34) BMI 29+ (M=25/91) 0.94 (0.61,1.45)
Participants with diabetes (N=380) Normal (M=92/180) 1 -- Normal (M=92/180) 1 --405 406 407 408 409 410 411 412
Underweight(M=8/14) 0.88 (0.41,1.87) Underweight(M=8/14) 0.88 (0.41,1.87) Overweight(M=56/122) 0.75 (0.53,1.06) Overweight(M=56/122 ) 0.75 (0.52,1.06) Obesity(M=23/64) 0.57* (0.35,0.92) BMI 27-28(M=7/23) 0.41* (0.18,0.89) BMI 28-29(M=4/14) 0.58 (0.19,1.73) BMI 29+(M=12/27) 0.74 (0.40,1.36)
Participants with depression status
(N=1059) Normal (M=228/574) 1 -- Normal (M=228/574) 1 --Underweight(M=45/83) 1.10 (0.79,1.53) Underweight(M=45/83 ) 1.11 (0.80,1.54) Overweight(M=90/274) 0.81 (0.63,1.04) Overweight(M=90/274 ) 0.81 (0.63,1.04) Obesity(M=33/128) 0.63* (0.43,0.91) BMI 27-28(M=13/45) 0.60 (0.34,1.07) BMI 28-29(M=5/28) 0.45 (0.18,1.10) BMI 29+(M=15/55) 0.75 (0.44,1.28) Healthy participants (N=1629) Normal (M=176/934) 1 -- Normal (M=176/934) 1 --Underweight(M=34/91) 1.55* (1.06,2.26) Underweight(M=34/91 1.55* (1.06,2.26)
) Overweight(M=65/439) 1.01 (0.76,1.35) Overweight(M=65/439 ) 1.02 (0.76,1.36) Obesity(M=23/165) 1.02 (0.65,1.58) BMI 27-28(M=4/58) 0.43 (0.16,1.15) BMI 28-29(M=8.41) 1.39 (0.68,2.85) BMI 29+(M=11/66) 1.47 (0.79,2.74) All models were adjusted for age, gender, education level, ethnicity, spouse status, current smoking and alcohol drinking status, comorbidities, and physical function impairment; Healthy participants meant that they had no comorbidity; * p < .05, ** p < .01, *** p < .0001; underweight: BMI<18.5; normal: 18.5≦BMI<24; overweight: 24≦BMI<27; M=ceased subjects in that group / total subjects in that group
413 414 415 416 417 418 419 420 421 422 423 424 425
Figure 1. Flow diagram of sampling scheme in this study Missing data of
depressive symptom, physical function and other covariates in TLSA 1996 (N=303)
In TLSA 1996, wave 3 (baseline) (N=5131)
Missing data of BMI in TLSA 1999
(N=142) In TLSA 1999, wave 4
(N=4440)
Subjects followed-up from TLSA 1996 to TLSA 1999 (N=4287)
Delete subjects with missing data of BMI in TLSA 1999 (N=142)
Eligible subjects with BMI data for mortality followed-up (N=4145)
Subjects with complete data for analysis
(N=3842) 426 427 428 429 430 431 432 433 434 435 436 437 438 439 440 441 442 443 444 445 446 447
Figure 2. Relationship of follow-up years and survival among the 4 BMI categories using Kaplan–Meier analysis 448
449 450 451