Association of Arsenic with Estimated GFR Kidney Function
in
Adolescents and Young Adults: Results from the National
Health and Nutrition Examination Survey
2009-2012
Weidemann, Darcy, M.D., M.H.S.1-3, Kuo Chin-Chi, M.D., Ph.D.1,3,4, Navas-Acien Ana,
M.D., Ph.D.1,3, Abraham Alison, Ph.D.1, Weaver Virginia, M.D., M.P.H.1,3, Fadrowski
Jeffrey M.D., M.H.S.1-3
Author Affiliations:
1 Department of Epidemiology, Johns Hopkins Bloomberg School of Public Health, Baltimore,
Maryland, USA
2 Division of Nephrology, Department of Pediatrics, Johns Hopkins Medical Institutions,
Baltimore, MD USA
3 Welch Center for Prevention, Epidemiology and Clinical Research, Johns Hopkins Medical
Institutions, Baltimore, Maryland, USA
4 Division of Nephrology, Department of Internal Medicine, China Medical University Hospital,
Taichung, Taiwan
Corresponding Author: Dr. Weidemann, 200 N Wolfe Street, Suite 2055, Baltimore, MD 21287, [email protected], 410-955-2467
SUPPORT AND FINANCIAL DISCLOSURE DECLARATION Support
This work was supported by the Renal Disease Epidemiology T32 Training Grant (E5 T32 DK07732), Johns Hopkins University, Bloomberg School of Public Health, sponsored by the National Institute of Diabetes and Digestive and Kidney Diseases.
The National Institutes of Health played no role in the design and conduct of the study; collection, analysis, and interpretation of the data; and preparation, review, or approval of the manuscript.
Financial Disclosure
None to report.
Other Disclosures None to report.
ABSTRACT
Background: Long-term exposure to arsenic is a major public health concern. Emerging evidence suggests adverse health effects even at low levels of exposure. This study examined the association of arsenic exposure and estimated GFR glomerular filtration rate (eGFR) and compared methods of adjustment for urinary dilution in a representative sample of U.S. adolescents and young adults.
Methods: We performed a cross-sectional observational study of 1,253 participants ages 12-30
years in the 2009-2012 National Health and Nutrition Examination Survey (NHANES) with urinary arsenic and eGFR measures available. Multivariate linear regression models examining the association of urinary total arsenic and dimethylarsinate (DMA) on the difference in eGFR are presented.
Study Design: Cross-sectional observational study.
Setting & Participants: 1,253 participants ages 12-30 years in the 2009-2012 National Health
and Nutrition Examination Survey (NHANES) with urinary arsenic and eGFR measures available.
Predictors: Urinary total arsenic and dimethylarsinate (DMA). Outcomes: Difference in eGFR (mL/min/1.73 m2).
Measurements: Multivariate linear regression.
Results: The median urinary total arsenic and DMA concentrations were 6.3 μg/L (IQR 3.3 – 12.7 μg/L) and 3.3 μg/L (IQR 1.7 – 5.7 μg/L), respectively. Median eGFR was 109
mL/min/1.73m2. Adjusting arsenic for urine concentration with urinary creatinine, eGFR was
4.0 mL/min/1.73 m2 higher (95% confidence interval [CI] 1.0 to 7.1 mL/min/1.73 m2) per
log-unit increase in total arsenic and 4.3 mL/min/1.73 m2 higher (95% CI 0.5 to 8.0 mL/min/1.73 m2)
for DMA. When using urine osmolality to adjust for urine concentration, a log-unit increase in total arsenic and DMA was associated with a 0.4 mL/min/1.73 m2 (95% CI -1.8 to 1.1
mL/min/1.73 m2) and 0.01 (95% CI -1.9 to 1.9 mL/min/1.73 m2) lower eGFR, respectively. Limitations: Cross-sectional design limits causal inference. No timed urine collections.
Conclusions: Discordant associations were observed between arsenic and eGFR levels
depending on whether urinary creatinine or osmolality was used to adjust for urine concentration. Further study should be dedicated to validating the best approach to account for urinary dilution in research in toxicants, and this may have implications for all studies which examine urinary biomarkers.
1. INTRODUCTION
Chronic exposure to inorganic arsenic has become a major public health concern throughout the world. Millions of people worldwide are exposed to inorganic arsenic, primarily through contamination of drinking water by natural arsenic deposits.(Smedley and Kinniburgh, 2002). The carcinogenic and toxic effects of long-term consumption of water containing high levels of arsenic have been well-described.(Chowdhury et al., 2000; Naujokas et al., 2013). The United States (U.S.) Environmental Protection Agency’s standard for arsenic concentration in public drinking water supply is 10 μg/L, and approximately 13 million individuals in the U.S. are estimated to live in an area that exceeds this standard.(Agency, 2001).
Humans may be exposed to both organic and inorganic forms of arsenic. Exposure to organic arsenic compounds such as arsenobetaine, primarily via seafood ingestion, is generally considered to be minimally or non-toxic. The complex biotransformation of inorganic arsenic includes detoxification of inorganic arsenic by subsequent methylation into monomethylarsonate (MMA) and dimethylarsenate (DMA) prior to excretion in the urine. Although all metabolites can be measured in the urine, DMA is most frequently detected in urine samples. The inorganic forms of arsenic and related methylated metabolites are most toxicAlthough methylation is generally thought of as a detoxification process, some arsenical intermediates in the pathway (especially trivalent inorganic arsenic and MMA) are considered extremely toxic.((ATSDR), 2007). Urinary arsenic excretion has been accepted as an appropriate biomarker of internal dose as urinary arsenic levels are highly correlated to arsenic intake and reflect relatively recent exposures.(Prevention, 2009). Although some populations such as Bangladesh (with high levels of arsenic exposure) have shown some variability in urinary arsenic levels (Kile et al., 2009), a
recent analysis of participants in the Strong Heart Study in the United States demonstrated long-term constancy of arsenic exposure and urinary excretion patterns, validating the use of urinary arsenic in large, population-based studies (Navas-Acien et al., 2009). Using a comparison with 24-hour urine collections, random urine collections for inorganic arsenic exposure have been recently validated in population-based studies.(Hinwood et al., 2002)
The kidney is the main organ involved in the excretion of arsenic and its metabolites, and thus several investigations have examined the effect of arsenic poisoning on kidney function. Many studies have examined albuminuria and/or proteinuria as the outcome of interest, as it is often an early marker of glomerular damage in other forms of kidney disease and may precede changes in GFR. An occupational analysis of 127 male cobalt smelter workers exposed to arsenic trioxide (AS2O3)- showed an increased prevalence of proteinuria.(Liu, 1989). An ecological study performed in southwestern Taiwan, an area of the world with endemic high exposure to arsenic, found a dose-effect response relationship between levels of inorganic arsenic exposure in well water and kidney cancer prevalence.(Chen and Wang, 1990).
Furthermore, kidney disease mortality in Taiwan decreased after the installation of public water supply systems and the reduction of arsenic in drinking water.(Yang et al., 2004) (Chen et al., 2011)
To date most investigations of the effects of arsenic on kidney function have been
performed in populations with high levels of endemic arsenic exposure. Increasingly the adverse health effects of chronic exposure to low and moderate levels of arsenic have been recognized. An ecological study conducted in southeastern Michigan (mean median water arsenic, 11 7.58 μg/L) found a positive association between moderate levels of water arsenic concentrations and
kidney disease mortality.(Meliker et al., 2007). A cross-sectional analysis of the Strong Heart Study, a population-based study evaluating cardiovascular disease and risk factors in American Indian communities in Oklahoma, Arizona, and North and South Dakota, recently found a dose-dependent effect of increasing urinary arsenic concentrations with prevalent albuminuria.(Zheng
et al., 2013). However, few epidemiological studies have directly examined associations of urinary arsenic with kidney function, and even fewer in young generally healthy populations with a low prevalence of chronic diseases such as diabetes and hypertension which are common causes of decreased kidney function and thus potent confounders. Therefore, the objective of our study was to examine the association of urinary total arsenic and dimethylarsinate (DMA) with markers of kidney function and eGFR in a representative population of young, generally healthy individuals with low to moderate arsenic exposure (levels in drinking water from <10 to <50 µg/L).
2. MATERIALS AND METHODS 2.1. Study Setting and Population
The National Health and Nutrition Examination Survey (NHANES) is a continuous
nationally representative multistage random survey conducted by the National Center for Health Statistics of the Centers for Disease Control and Prevention (CDC) designed to obtain a
representative sample of the civilian noninstitutionalized U.S. population.(Statistics, 2014). We analyzed combined questionnaire, laboratory, and physical exam data from four study cycles encompassing 2009 – 2012. The NHANES study protocols were approved by the institutional review board of the National Center for Health Statistics. Oral and written informed consent was obtained from all participants, or if younger than 18 years, their guardians. Assent was obtained from all those aged 12 to 17 years. The participation rate in NHANES 2009-2010 was 77.3% and in 2011-2012 was 69.5%.
There were a total of 4,647 NHANES participants between the ages of 12 and 30 in the combined 2009-2012 NHANES study. Urinary arsenic measures were obtained on a one-third randomly selected subsample of NHANES participants (n=1,540).(Statistics, 2011). Of the 1,540 eligible participants, 1,522 had urinary arsenic measures available. We excluded participants who were pregnant (n=19), missing serum creatinine (n=129), measured height (n=13),urinary total arsenic (n=17), arsenobetaine (n=1), urine osmolality (n=56), body mass index (BMI) (n=3), or hypertension status (n=49), resulting in a final sample size of 1,253 participants.
Urine samples were collected from participants at the time of the physical exam in arsenic-free containers and transported on dry ice to the Environmental Health Sciences Laboratory at the National Center for Environmental Health (NCEH: Atlanta, GA).(Caldwell et al., 2009). Urine samples were stored frozen at -70⁰ C or lower and analyzed within 3 weeks of collection according to a standardized protocol.((NCHS). 2009). Total urinary arsenic concentrations were measured using inductively coupled-plasma dynamic reaction cell-mass spectrometry on a PerkinElmer ELAN 6100 DRCPLUS or ELAN DRC II ICP-MS (PerkinElmer SCIEX, Concord
ON, Canada).(Statistics, 2011). Arsenic speciation can distinguish arsenic species that are directly related to inorganic arsenic exposure (arsenate, arsenite, MMA, and DMA) from organic arsenicals in seafood (arsenobetaine, arsenocholine) that are generally considered nontoxic.(B.A. et al., 2007). All Urinary urinary arsenic species (arsenous acid, arsenic acid, MMA, DMA, arsenobetaine, and arsenocholine) were measured using high performance liquid chromatography (HLPC).
Limits of detection and interassay coefficient of variation (CV) differed among analytes and survey cycles. For total arsenic, the detection limit was 0.74 μg/L for the 2009-2010 survey and 1.25 μg/L for the 2011-2012 survey. For the 25 participants (2%) in whom total urinary arsenic levels were below the limit of detection, values were imputed by a level equal to the limit of detection divided by the square root of two.((NCHS). 2009). The limit of detection for the 2009-2010 and 2011-2012 cycle was 1.7 and 1.8 μg/L, respectively, for DMA; 0.9 and 0.89 μg/L for MMA; and 0.4 and 1.19 μg/L for arsenobetaine. For the 269 participants (21.6%) with DMA levels and 678 participants (54.4%) with arsenobetaine levels below the limit of detection their values were similarly assigned a level equal to the limit of detection divided by the square root of two. Although other arsenical metabolites such as arsenate, arsenite, and MMA were measured, they were excluded from this analysis due to the high percentage of undetectable levels (79.1%, 97.4%, and 68.4%, respectively). of participants had values below the limits of detection for arsenate, arsenite, and MMA, respectively, and were therefore not used in this analysis. The interassay CV across NHANES lots ranged from 1.3% to 6.4% for total mean arsenic
concentrations, 3.3% to 6.6% for DMA, and 5.3% to 7.3% for arsenobetaine. 2.3 Kidney Function Measures
Serum and urine creatinine level was measured by the enzymatic method using a
Roche/Hitachi Modular P Chemistry Analyzer which is traceable to an isotope dilution mass spectrometry (IDMS) reference standard. The interassay coefficients of variation ranged from 1.2% to 5.4%.(Health, 2011). Urine osmolality was measured by the freezing point depression osmometry method. A primary function of the kidney is to excrete waste products and to precisely regulate the excretion of other substances (sodium, potassium, etc.) to maintain homeostatic balance. This is in large part determined by the rate of filtration of plasma at the glomeruli, part of the functional units of the kidney. The collective filtration by all of the glomeruli is known as GFR Estimated GFR (measured in milliliters per minute per 1.73 m2) and
is the most common measure of kidney function. was We estimated GFR using the calculated using the bedside GFR estimating equation provided by the Chronic Kidney Disease in Children (CKiD) cohort study (0.413*height in centimeters/serum creatinine)(Schwartz et al., 2009) for participants 12-17 years of age, and the equation provided by the Chronic Kidney Disease Epidemiology Collaboration (CKD-EPI) for individuals 18 years or older.(Levey et al., 2009).
2.4 Other Variables
Questionnaire information was analyzed to determine the participants’ age, gender, and race/ethnicity. Physical examination provided BMI and blood pressure variables. The BMI was calculated as the weight in kilograms divided by the height in meters squared and percentiles were generated according to the CDC BMI-for-age gender-specific growth charts. Participants were categorized as overweight if their BMI was 90th – 94th percentile for participants ages
12-17, and BMI 25.0 to 29. 9 kg/m2 for individuals ≥18 years. Participants were categorized as
obese if their BMI was the 95th percentile or greater (ages 12-17) or ≥ 30 mg/m2 (≥18 years).
Participants between 12 and 17 years of age were classified as pre-hypertensive if they
responded yes to a questionnaire or if their measured mean systolic or diastolic blood pressures was 90th – 94th percentile for age, height, and gender.(National High Blood Pressure Education
Program Working Group on High Blood Pressure in and Adolescents, 2004).. Participants ≥18 years were classified as pre-hypertensive if they responded yes to a questionnaire or if their measured mean systolic blood pressure was between 120 and 139 mmHg or if their measured mean diastolic blood pressure was between 80 and 89 mmHg. Participants ages 12 to 17 were classified as hypertensive if they responded yes to a questionnaire or if their measured systolic or diastolic blood pressures were greater than the 95th percentile,(National High Blood Pressure
Education Program Working Group on High Blood Pressure in and Adolescents, 2004) and participants ≥18 years were classified as hypertensive if they responded yes to a questionnaire or if their measured systolic blood pressure was 140 mmHg or greater or if their diastolic blood pressure was 90 mmHg or greater. Tobacco smoke exposure was determined based on serum cotinine levels measured by an isotope-dilution high performance liquid chromatography (HLPC) and atmospheric pressure chemical ionization tandem mass spectrometric method. Tobacco smoke exposure was categorized as undetectable (below the limit of detection, < 0.015
ng/mL), involuntary (0.015 – 10.0 ng/mL), and active (>10.0 ng/mL).(Benowitz, 1996).
Diabetes was classified as yes if participants responded yes to a questionnaire that they had been diagnosed with diabetes by a doctor, or if the hemoglobin A1c was ≥6.5% or fasting glucose ≥126 mg/dL as per guidelines by the American Diabetes Association.(American Diabetes, 2011).
Albuminuria status was determined from random urine samples submitted by participants during the mobile exam center (MEC)exam component of the survey. Albumin-to-creatinine ratios (ACR) were determined by dividing urinary albumin (mg/dL) by urinary creatinine (g/dL) and presented in categories ACR < 30 mg/g Cr, 30-300 mg/g Cr, and >300 mg/g Cr.
2.5 Statistical Analysis
All statistical analyses were performed using Stata statistical software, version 12.1
(StataCorp, College Station, Texas). Survey commands were utilized to account for the complex sampling design with appropriate strata, primary sampling units, and special sample weights used to obtained unbiased point estimates and robust standard errors.(Johnson et al., 2013). The statistical significance level was set at alpha = 0.05, and all p-values were 2-sided.
Median and interquartile ranges (25th percentile and 75th percentile) for urinary total arsenic
levels, DMA levels and eGFR were calculated for the entire study population. Natural log-transformed total arsenic and DMA concentrations were examined as continuous exposures and categorized as quartiles in multivariate linear regression models of eGFR.
Urinary total arsenic is a reflection of both inorganic and organic arsenic. Because our question of interest was the relationship of inorganic arsenic with eGFR, our primary exposure assessment was total urinary arsenical concentration adjusted for arsenobetaine.
We conducted linear regression models to evaluate the Unadjusted associations between theof eGFR levels with total urinary arsenic and DMA concentrations measures and eGFR were examined. Linear regression models were then fitted with increasing degrees of adjustment for potential confounders.To account for differences in urinary concentration, we performed two Pparallel analyses were performed accounting for urinary concentration by including adjustment for urinary creatinine or urine osmolality. In addition to controlling for urine dilution (by adjusting for urinary creatinine or urine osmolality) First we adjusted for age, gender, and
race/ethnicity, and urinary creatinine (or urine osmolality in parallel analysis). Further, we The second model additionally adjusts adjusted for potential chronic kidney disease risk factors including BMI, serum cotinine, hypertension status, and diabetes status. The final models were further adjusted for urinary arsenobetaine, which provides estimates for the association of
exposure to inorganic arsenic and DMA independent of seafood ingestion. Sensitivity analyses were performed with and without the covariates of poverty income ratio, diabetes, and
hypertension. We also performed similar regression analyses accounting for urine dilution through the use of arsenic measures divided by the urine concentration correction factor (e.g., μg/g Cr or μg/μOsm/kg) as the exposure metrics. Secondary analyses were also performed using multiple linear regression techniques to examine the association of urinary arsenic species on the difference in ACR as the primary outcome variable. Similar regression models defining
exposure to inorganic arsenic as the difference between total arsenic and arsenobetaine were also explored. Normality assumptions of linear regression models were confirmed with visual plots of predicted values versus residuals, kernel density plots, and the Shapiro-Wilk test. Diagnostic tests for potential collinearity were performed by calculation of variance inflation factors (Liao and Valliant, 2012).
3. RESULTS
The median urinary total arsenic level in the 1,253 participants was 6.3 μg/L for total arsenic and 3.3 μg/L for DMA. The median eGFR was 109 mL/min/1.73 m2 (Table 1). Total arsenic
and DMA concentrations did not differ significantly by gender, tobacco exposure, BMI,
hypertension status, or albuminuria status. White participants had lower total arsenic levels than non-White participants. DMA concentrations were higher in older participants. Total arsenic and DMA were higher in participants without diabetes although very few participants had diabetes in this population (n=7). The eGFR was significantly higher in females, participants who were not Black race, participants with diabetes, and participants without albuminuria. Total arsenic was modestly correlated with DMA (Pearson correlation coefficient r= 0.36) and highly correlated with arsenobetaine (r=0.98). Urinary creatinine was highly correlated with urine osmolality (r=0.72). Serum and urinary creatinine were modestly correlated (r=0.31). Serum creatinine and urine osmolality were not correlated (r=0.08).
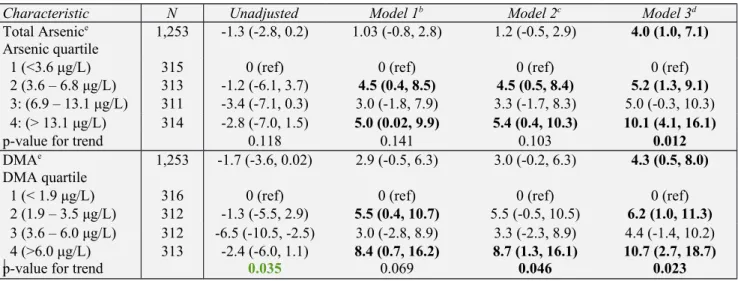
Table 2 examines the association between urinary arsenic (total and DMA) and eGFR with urinary creatinine used to adjust for urine concentration. In the fully adjusted model, a log-unit increase in total arsenic was associated with a 4.0 mL/min/1.73 m2 (95% CI 1.0 to 7.1
mL/min/1.73 m2) higher eGFR, and a log-unit increase in DMA was associated with a 4.3
mL/min/1.73 m2 (95% CI 0.5 to 8.0 mL/min/1.73 m2) higher eGFR. Quartile analysis revealed a
dose-dependent trend with participants in the highest quartiles of total arsenic or DMA having 10.1 mL/min/1.73 m2 (95% CI 4.1 to 16.1 mL/min/1.73 m2) and 10.7 mL/min/1.73 m2 (95% CI
2.7 to 18.7 mL/min/1.73 m2) higher eGFRs, respectively, as compared to the lowest quartile.
In contrast, in analyses using urine osmolality no significant associations between arsenic or DMA and eGFR were observed (Table 3). Log-unit increases of total arsenic and DMA were associated with a 0.4 mL/min/1.73 m2 (95% CI -1.8 to 1.1 mL/min/1.73 m2) and 0.01
mL/min/1.73 m2 (95%CI -1.9 to 1.9 mL/min/1.73 m2) lower eGFR, respectively. Comparing the
highest to the lowest quartile, eGFR levels were 1.8 mL/min/1.73 m2 (95% CI -2.2 to 5.8
mL/min/1.73 m2) higher for total arsenic and 1.5 mL/min/1.73 m2 (95% CI -2.3 to 5.2
We performed several secondary analyses to evaluate the impact of adjustment for other kidney disease risk factors. Further adjustment for blood lead or albuminuria did not modify the observed associations (not shown). Analyses examining the association between total arsenic or DMA and the difference in ACR (mg/g Cr) did not show any statistically significant differences.
Parallel analyses were also performed using the arsenic species divided by the urine
concentration correction factor (e.g., μg/g Cr or μg/μOsm/kg) as the explanatory variable in the regression analyses. Results were similar to our primary analysis (data not shown) and
demonstrated a dose-dependent, statistically significant positive association between arsenic species and eGFR with urinary creatinine, not osmolality. A sensitivity analysis including poverty income ratio in the models did not significantly change our results (data not shown). A sensitivity analysis excluding diabetes and hypertension also was not significantly different (data not shown), likely due to the low prevalence of diabetes and hypertension in this population. Models explored defining inorganic arsenic as the difference between total arsenic and arsenobetaine showed similar results, although results did not achieve statistical significance (data not shown). Our data did not show evidence of collinearity, as variance inflation factors for all regressions ranged below 1.1 and 2.7, markedly lower than 10, a cutoff commonly used to establish collinearity (Hair et al., 2009).
4. DISCUSSION
In this nationally representative sample of adolescents and young adults, associations of urinary total arsenic and DMA levels with eGFR were examined using two different methods of adjustment for urine concentration. Distinct differences were observed by method of adjustment. Higher total urinary arsenic and DMA levels, categorized as continuous or categorical variables,
were associated with higher eGFR. However, these results were observed only when the arsenic measures were adjusted using urinary creatinine. Adjustment for urinary concentration using urine osmolality revealed weaker, not statistically significant associations.
The understanding of human kidney processing of arsenic species continues to be poorly understood. Early experiments in dogs (Ginsburg, 1965) and more recent experiments using immortalized human proximal tubular epithelial cell lines (Peraza et al., 2003) have confirmed that the proximal tubular cell has a robust capacity to metabolize arsenic primarily by reducing arsenate to arsenite, and have identified cell mitochondria as a likely target for cell toxicity. Studies in mice have demonstrated high activity levels of arsenite methyltransferase activity in the mouse kidney, indicating its ability to detoxify inorganic arsenic through methylation (Healy et al., 1998). Oxidative stress has been identified as a potential mechanism for arsenic-induced nephrotoxicity in mice, an effect that was partially reversed with the administration of arjunolic acid, a presumed free radical scavenger.(Sinha et al., 2008). Human and animal studies have also shown increased lipid peroxidation, superoxide production, hydroxyl radical sulfhydrals, and/or oxidant-induced DNA damage resulting from arsenic exposure.(Sasaki et al., 2007). In humans, acute arsenic intoxication has been associated with tubulointerstitial nephritis and acute tubular necrosis.(Prasad and Rossi, 1995).
Although there are relatively few epidemiological studies examining low level arsenic exposure and kidney function, our findings of a positive association between urinary arsenic and GFR differ from what has previously been reported. A case-control study examining 125 patients with chronic kidney disease (CKD) and 229 age-matched controls (mean eGFR 28 and 80 mL/min/1.73 m2, respectively) showed that total urinary arsenic level was significantly
arsenic having a more than four-fold increase in odds of CKD versus controls .(Hsueh et al., 2009). Estimated GFR was also significantly negatively associated with total urinary arsenic levels in another study of similar design comparing 132 patients with renal cell carcinoma (mean arsenic 25.2 μg/L) to age- and sex- matched controls (mean arsenic 21.1 μg/L) .(Huang et al., 2011). Both of these studies accounted for urine concentration by correction with urine creatinine (i.e., exposure categorized as μg/g creatinine).
To our knowledge there are no prior published studies examining the association between arsenic species and eGFR with direct comparison of creatinine and non-creatinine-based methods of adjustment for urine concentration. The reason for the unexpected positive association observed with adjustment with urinary creatinine remains unclear. Similar
unexpected positive associations between suspected nephrotoxicants, including lead, cadmium, and thallium, and kidney function outcomes have been described in the literature, particularly when using serum creatinine-based eGFR measures and urinary creatinine to adjust for urinary dilution .(de Burbure et al., 2006; Ferraro et al., 2010; Shelley et al., 2012; You et al., 2011). One potential explanation in our cross-sectional study could be that the higher levels of urinary arsenic simply reflect higher kidney filtration. A wide spectrum of “normal” GFR exists due to a variety of biological factors and nephron endowment, and normal GFR ranges from
approximately 90-130 mL/min/1.73 m2 .(Schwartz and Work, 2009). This potential explanation
would be related to reverse causality and could havehas substantial impact on any environmental epidemiological research which utilizes urine samples to assess toxicant exposure, as researchers would potentially need to account for the effect of kidney filtration on the toxicant level in the urine when analyzing and interpreting results. Urinary levels have been accepted as surrogate markers for cumulative exposure or internal dose for many metals, including inorganic mercury,
cadmium, and arsenic .(Roels et al., 1999). Hyperfiltration is a complex phenomenon that has been described in multiple pathophysiological states including diabetes, sickle cell disease, and obesity. It is characterized by maladaptive alterations in glomerular hemodynamics and
structural changes within the glomerulus and is often associated with albuminuria and a transient
increase in GFR (Helal et al., 2012). Although the pathological process of hyperfiltration injury has been proposed in an experimental animal model which demonstrated a positive association between blood lead and measured GFR, (Khalil-Manesh et al., 1992), hyperfiltration is unlikely to be the cause for the results observed herein given that there were no significant associations observed between increased arsenic levels and albuminuria. Additionally if the physiological filtration or pathological hyperfiltration theory theories were true, one would also expect a positive association with the analyses performed with osmolality which was not observed. The potential for alterations in proximal tubular secretion of creatinine which may be induced by arsenic, also known to affect the proximal tubule, is a mechanism which cannot be excluded. This possibility was highlighted in a recent study (Weaver et al., 2014) which also demonstrated unexpected positive associations between urine cadmium, thallium, and uranium and estimated GFR only when urine creatinine, not urine osmolality, was used to adjust for urine concentration. Another potential explanation for the inconsistent findings between urinary creatinine and urine osmolality could be due to residual confounding from inadequate adjustment for urinary concentration. It is well-known that urinary biomarkers are highly dependent on urine
concentration, and several studies have shown considerable variation in biomarkers relative to time of day of the urine collection .(Akerstrom et al., 2014). For example, concentrations tend to be higher in first-morning voids and lower in more dilute spot urine samples collected later in the day, presumably due to variations in hydration status. In principle, this source of variation
should be non-differential and bias the associations towards the null. Although sSeveral approaches have been proposed to account for this important source of variation, although no consensus exists on the optimal methodological approach to correction for urine concentration . (Barr et al., 2005). The most commonly employed method in arsenic research divides the arsenic concentration by urinary creatinine, and results are presented as ug/g creatinine. However, there are well-described limitations with the use of creatinine which include important variations relative to gender, age, muscle mass, and diet, as well as substantial processing in the kidney including tubular secretion and filtration which varies significantly by level of kidney function . (Perrone et al., 1992; Waikar et al., 2010) as well as the associations between urine creatinine and arsenic metabolism (Gamble and Hall, 2012). Alternative methods to account for urine concentration have been explored, including adjustment for specific gravity, osmolality, and using timed urine collections .(Akerstrom et al., 2012; Suwazono et al., 2005). Urine osmolality is rarely used to adjust for urine concentration, despite the fact that it is less dependent on large molecular weight molecules (e.g. glucose or albumin), and may be more useful in children and adolescents in whom creatinine varies greatly by age .(Chadha et al., 2001).
Conflicting associations depending on approach to the urine concentration were highlighted in a recent investigation which examined the association of urinary uranium with several eGFR and creatinine clearance outcomes in a population of Korean lead workers environmentally exposed to uranium .(Shelley et al., 2014). The authors directly compared three different approaches, including directly dividing uranium level by urinary creatinine, including urinary creatinine as a covariate with uranium in the regression model, and the use of a timed specimen in which the total amount of uranium excreted over 4 hours was calculated. Statistically significant negative associations were observed with measured creatinine clearance in the models that used urinary
creatinine but total excreted uranium was not significantly associated with any outcomes. The authors concluded that the observed associations between urinary toxicants and kidney outcomes may be related to statistical associations due to the use of urinary creatinine in both exposure and outcome metrics. We cannot rule out the possibility that the positive association in our study may also be partially statistical in nature, due to the modest positive correlation between serum and urine creatinine.
One major limitation of our investigation is inherent to the cross-sectional design which limits the ability to draw causal inference between urinary arsenic and eGFR. In a recent analyses in the Strong Heart Study, the sum of inorganic and methylated arsenic species were inversely related to prevalent CKD but positively associated with incident CKD (REF). The cross-sectional findings could reflect reverse causality. A second limitation is the lack of
measured GFR in this population and our reliance on estimating equations, which have well-known limitations, particularly in the adolescent population .(Schwartz and Work, 2009). In particular, none of the GFR estimating equations, including the two used in our study,
have been validated in the 17-19 year old age group. A third limitation is the lack of a timed
urine collection, which although expensive and challenging to obtain would allow for a comparison of results by method of urine concentration adjustment to a “gold standard” assessment of arsenic excretion. Lastly, we did not have information on arsenic levels in food
or water, the primary sources of arsenic exposure in general populations. However, urinary arsenic is considered a valid biomarker that integrates exposure from multiple sources (Zheng et
al., 2014). given the design of the study we were unable to correlate urinary arsenic
However, prior epidemiological investigations have confirmed a strong correlation between urinary arsenic species and drinking water arsenic.(Calderon et al., 1999)
Despite these limitations, to our knowledge this is the first study to examine the association of urinary arsenic and arsenic species on eGFR in a young and healthy population with low to moderate levels of arsenic exposure. This is also one of the first studies to
demonstrate that method of adjustment for urinary concentration impacts the observed
associations with arsenic exposure. The implications for future arsenic research, and potentially other toxicants for which urinary levels are used to assess exposure, could be substantial. Given the growing body of evidence that shows conflicting and unexpected associations with kidney outcomes when adjustment methods employ the use of urinary creatinine, future study should be dedicated to validating the best approach to account for urinary concentration. This study also adds further insight into the understanding of the potential epidemiological associations between arsenic and kidney function and highlights the need to better understand the health consequences for populations with chronic exposure to low to moderate levels of arsenic.
5. ACKNOWLEDGEMENTS
5.1. Contributions
Research idea and study design: D.W., J.F., A.N.A. Data acquisition: D.W.
Data analysis/interpretation: D.W., C.K., J.F., A.N.A., A.A., V.W. Statistical analysis: D.W., C.K., A.A., A.N.A., J.F.
Supervision or mentorship: J.F., A.N.A.
Each author contributed important intellectual content during manuscript drafting or revision and accepts accountability for the overall work by ensuring that questions pertaining to the accuracy or integrity of any portion of the work are appropriately investigated and resolved. D.W. takes responsibility that this study has been reported honestly, accurately, and transparently; that no important aspects of the study have been omitted, and that any discrepancies from the study as planned (and, if relevant, registered) have been explained.
6. REFERENCES
(ATSDR), A. f. T. S. a. D. R., Toxicological profile for arsenic. In: P. H. S. U.S. Department of Health and Human Services, (Ed.), Atlanta, GA, 2007, pp. 1-559.
(NCHS)., C. f. D. C. a. P. C. N. C. f. H. S., National Health and Nutrition Examination Survey 2009-2010 Laboratory Procedures Manual: Urine Arsenic Species. Centers for Disease Control and Prevention, 2009, pp. 1-72.
Agency, E. P., 2001. National primary drinking water regulations; arsenic and clarifications to compliance and new source contaminants monitoring; final rule. Federal Register. 66, 6976-7066.
Akerstrom, M., et al., 2014. Variability of urinary cadmium excretion in spot urine samples, first morning voids, and 24 h urine in a healthy non-smoking population: implications for study design. J Expo Sci Environ Epidemiol. 24, 171-9.
Akerstrom, M., et al., 2012. Sampling of urinary cadmium: differences between 24-h urine and overnight spot urine sampling, and impact of adjustment for dilution. Int Arch Occup Environ Health. 85, 189-96.
American Diabetes, A., 2011. Standards of medical care in diabetes--2011. Diabetes Care. 34 Suppl 1, S11-61.
B.A., F., et al., 2007. Handbook on the toxicology of metals. Elsevier, Amsterdam, the Netherlands.
Barr, D. B., et al., 2005. Urinary creatinine concentrations in the U.S. population: implications for urinary biologic monitoring measurements. Environ Health Perspect. 113, 192-200. Benowitz, N. L., 1996. Cotinine as a biomarker of environmental tobacco smoke exposure.
Epidemiol Rev. 18, 188-204.
Calderon, R. L., et al., 1999. Excretion of arsenic in urine as a function of exposure to arsenic in drinking water. Environ Health Perspect. 107, 663-7.
Caldwell, K. L., et al., 2009. Levels of urinary total and speciated arsenic in the US population: National Health and Nutrition Examination Survey 2003-2004. J Expo Sci Environ Epidemiol. 19, 59-68.
Chadha, V., et al., 2001. Measurement of urinary concentration: a critical appraisal of methodologies. Pediatr Nephrol. 16, 374-82.
Chen, C. J., Wang, C. J., 1990. Ecological correlation between arsenic level in well water and age-adjusted mortality from malignant neoplasms. Cancer Res. 50, 5470-4.
Chen, Y., et al., 2011. Association between arsenic exposure from drinking water and proteinuria: results from the Health Effects of Arsenic Longitudinal Study. Int J Epidemiol. 40, 828-35.
Chowdhury, U. K., et al., 2000. Groundwater arsenic contamination in Bangladesh and West Bengal, India. Environ Health Perspect. 108, 393-7.
de Burbure, C., et al., 2006. Renal and neurologic effects of cadmium, lead, mercury, and arsenic in children: evidence of early effects and multiple interactions at environmental exposure levels. Environ Health Perspect. 114, 584-90.
Ferraro, P. M., et al., 2010. Low level exposure to cadmium increases the risk of chronic kidney disease: analysis of the NHANES 1999-2006. BMC Public Health. 10, 304.
Gamble, M. V., Hall, M. N., 2012. Relationship of creatinine and nutrition with arsenic metabolism. Environ Health Perspect. 120, A145-6.
Ginsburg, J. M., 1965. Renal Mechanism for Excretion and Transformation of Arsenic in the Dog. Am J Physiol. 208, 832-40.
Hair, J. F., et al., 2009. Multivariate Data Analysis. Prentice Hall, New Jersey.
Health, N. C. f. E., National Health and Nutrition Examination Survey (NHANES) 2011-2012 Laboratory Procedures Manual: Creatinine. Centers for Disease Control and Prevention, 2011, pp. 1-10.
Healy, S. M., et al., 1998. Enzymatic methylation of arsenic compounds. V. Arsenite methyltransferase activity in tissues of mice. Toxicol Appl Pharmacol. 148, 65-70. Helal, I., et al., 2012. Glomerular hyperfiltration: definitions, mechanisms and clinical
implications. Nat Rev Nephrol. 8, 293-300.
Hinwood, A. L., et al., 2002. Are 24-hour urine samples and creatinine adjustment required for analysis of inorganic arsenic in urine in population studies? Environ Res. 88, 219-24. Hsueh, Y. M., et al., 2009. Urinary arsenic species and CKD in a Taiwanese population: a
case-control study. Am J Kidney Dis. 54, 859-70.
Huang, C. Y., et al., 2011. Effect of urinary total arsenic level and estimated glomerular filtration rate on the risk of renal cell carcinoma in a low arsenic exposure area. J Urol. 185, 2040-4.
Johnson, C. L., et al., 2013. National health and nutrition examination survey: analytic guidelines, 1999-2010. Vital Health Stat 2. 1-24.
Khalil-Manesh, F., et al., 1992. Experimental model of lead nephropathy. I. Continuous high-dose lead administration. Kidney Int. 41, 1192-203.
Kile, M. L., et al., 2009. Variability in biomarkers of arsenic exposure and metabolism in adults over time. Environ Health Perspect. 117, 455-60.
Levey, A. S., et al., 2009. A new equation to estimate glomerular filtration rate. Ann Intern Med. 150, 604-12.
Liao, D., Valliant, R., 2012. Variance inflation factors in the analysis of complex survey data. Survey Methodology. 38, 53-62.
Liu, H. M., 1989. Clinical observation of renal injury to workers exposed to arsenic. Chin J Ind Hyg Occup Dis. 7, 349-350.
Meliker, J. R., et al., 2007. Arsenic in drinking water and cerebrovascular disease, diabetes mellitus, and kidney disease in Michigan: a standardized mortality ratio analysis. Environ Health. 6, 4.
National High Blood Pressure Education Program Working Group on High Blood Pressure in, C., Adolescents, 2004. The fourth report on the diagnosis, evaluation, and treatment of high blood pressure in children and adolescents. Pediatrics. 114, 555-76.
Naujokas, M. F., et al., 2013. The broad scope of health effects from chronic arsenic exposure: update on a worldwide public health problem. Environ Health Perspect. 121, 295-302. Navas-Acien, A., et al., 2009. Urine arsenic concentrations and species excretion patterns in
American Indian communities over a 10-year period: the Strong Heart Study. Environ Health Perspect. 117, 1428-33.
Peraza, M. A., et al., 2003. Toxicity and metabolism of subcytotoxic inorganic arsenic in human renal proximal tubule epithelial cells (HK-2). Cell Biol Toxicol. 19, 253-64.
Perrone, R. D., et al., 1992. Serum creatinine as an index of renal function: new insights into old concepts. Clin Chem. 38, 1933-53.
Prasad, G. V., Rossi, N. F., 1995. Arsenic intoxication associated with tubulointerstitial nephritis. Am J Kidney Dis. 26, 373-6.
Prevention, C. f. D. C. a., Fourth Report on Human Exposures to Environmental Chemicals. Biomonitoring summary: Arsenic. In: U. S. D. o. H. a. H. Services, (Ed.), Vol. CAS No. 7440-38-2, Atlanta, GA, 2009, pp. 180-192.
Roels, H. A., et al., 1999. Usefulness of biomarkers of exposure to inorganic mercury, lead, or cadmium in controlling occupational and environmental risks of nephrotoxicity. Ren Fail. 21, 251-62.
Sasaki, A., et al., 2007. An approach to elucidate potential mechanism of renal toxicity of arsenic trioxide. Exp Hematol. 35, 252-62.
Schwartz, G. J., et al., 2009. New equations to estimate GFR in children with CKD. J Am Soc Nephrol. 20, 629-37.
Schwartz, G. J., Work, D. F., 2009. Measurement and estimation of GFR in children and adolescents. Clin J Am Soc Nephrol. 4, 1832-43.
Shelley, R., et al., 2012. Associations of multiple metals with kidney outcomes in lead workers. Occup Environ Med. 69, 727-35.
Shelley, R., et al., 2014. Uranium associations with kidney outcomes vary by urine concentration adjustment method. J Expo Sci Environ Epidemiol. 24, 58-64.
Sinha, M., et al., 2008. Arjunolic acid attenuates arsenic-induced nephrotoxicity. Pathophysiology. 15, 147-56.
Smedley, P. L., Kinniburgh, D. G., 2002. A review of the source, behaviour and distribution of arsenic in natural waters. Applied Geochemistry. 17, 517-568.
Statistics, N. C. f. H., 2009-2010 Data documentation, codebook, and frequencies: urinary total arsenic and speciated arsenics (subsample). Centers for Disease Control and Prevention, Hyattsville, MD, 2011.
Statistics, N. C. f. H., About the National Health and Nutrition Examination Survey. Centers for Disease Control and Prevention, Atlanta, GA, 2014.
Suwazono, Y., et al., 2005. Creatinine versus specific gravity-adjusted urinary cadmium concentrations. Biomarkers. 10, 117-26.
Waikar, S. S., et al., 2010. Normalization of urinary biomarkers to creatinine during changes in glomerular filtration rate. Kidney Int. 78, 486-94.
Weaver, V. M., et al., 2014. Impact of urine concentration adjustment method on associations between urine metals and estimated glomerular filtration rates (eGFR) in adolescents. Environ Res. 132, 226-32.
Yang, C. Y., et al., 2004. Reduction in kidney cancer mortality following installation of a tap water supply system in an arsenic-endemic area of Taiwan. Arch Environ Health. 59, 484-8.
You, L., et al., 2011. Renal function, bisphenol A, and alkylphenols: results from the National Health and Nutrition Examination Survey (NHANES 2003-2006). Environ Health Perspect. 119, 527-33.
Zheng, L., et al., 2014. Arsenic and Chronic Kidney Disease: A Systematic Review. Curr Environ Health Rep. 1, 192-207.
Zheng, L. Y., et al., 2013. Urine arsenic and prevalent albuminuria: evidence from a population-based study. Am J Kidney Dis. 61, 385-94.
Characteristic No (%) of
participantc Total arsenic(μg/L) valuep- d (μg/L)DMA p-valued (mL/min/1.73meGFR 2)e d p-valued
Total 1,253 (100) 6.3 (3.3, 12.7) --- 3.3 (1.7, 5.7) --- 109 (95, 122) ---Sex: Male Female 673 (53.7)580 (36.3) 6.7 (3.7, 15.3)5.7 (2.8, 11.0) 0.34 3.6 (1.9, 6.2)2.9 (1.3, 5.2) 0.12 106 (93, 120)112 (97, 124) 0.008 Age (years): 12-17 18-24 25-30 543 (33.8) 464 (40.2) 246 (26.1) 5.4 (3.0, 9.9) 6.2 (3.5, 12.6) 8.4 (3.4, 19.7) 0.52 3.1 (1.8, 4.9) 3.3 (1.8, 5.8) 3.6 (1.3, 7.0) 0.025 99 (88, 110) 115 (103, 126) 112 (98, 121) 0.051 Race/Ethnicity: Black Hispanic White Other 301 (13.5) 378 (20.1) 404 (57.7) 170 (8.7) 6.8 (4.1, 14.0) 7.8 (4.3, 13.2) 5.3 (3.0, 11.4) 7.6 (3.8, 29.7) 0.021 3.6 (2.1, 6.3) 4.0 (2.3, 6.5) 2.8 (1.3, 4.8) 3.8 (2.1, 10.2) 0.44 98 (87, 114) 118 (103, 127) 108 (96, 120) 111 (95, 125) <0.001 Tobacco exposure:f Undetectable Involuntary Active 262 (22.9) 748 (57.0) 243 (20.0) 5.6 (2.8, 12.6) 6.1 (3.2, 13.2) 7.3 (4.3, 14.5) 0.24 3.3 (1.3, 6.1) 3.2 (1.8, 5.5) 3.6 (2.0, 6.7) 0.48 111 (96.4, 122) 107 (94, 122) 112 (97, 122) 0.95 Weight category:g Underweight Normal weight Overweight Obese 44 (2.9) 641 (52.4) 266 (21.9) 302 (22.7) 6.2 (3.6, 11.9) 6.1 (3.4, 12.5) 6.2 (3.1, 11.4) 7.2 (3.2, 14.9) 0.31 3.3 (1.3, 4.9) 3.2 (1.7, 5.5) 3.2 (1.7, 5.1) 3.8 (1.9, 7.2) 0.54 121 (104, 129) 108 (95, 120) 109 (95, 122) 111 (97, 123) 0.51 Hypertension:h No hypertension Pre-hypertension Hypertension 1,022 (78.7) 209 (19.4) 22 (1.9) 6.2 (3.3, 11.8) 7.3 (3.0, 19.7) 7.4 (3.4, 14.9) 0.35 3.2 (1.8, 5.6) 3.4 (1.7, 6.8) 3.3 (2.0, 4.1) 0.83 109 (95, 122) 111 (97, 121) 111 (90, 121) 0.82 Diabetes:i No Yes 1,246 (99.4)7 (0.6%) 6.4 (3.3, 12.7)2.7 (0.9, 6.9) <0.001 3.3 (1.8, 5.7)1.3 (1.3, 5.4) 0.04 136 (125, 136)109 (95, 122) 0.004 ACR (mg/g Cr): <30 30-300 >300 1,150 (92.0) 98 (7.6) 5 (0.4) 6.3 (3.3, 12.7) 6.5 (3.2, 15.4) 8.0 (2.4, 13.8) 0.20 3.2 (1.7, 5.8) 3.1 (2.0, 5.1) 4.5 (1.3, 4.5) 0.89 109 (96, 122) 104 (92, 115) 100 (97, 115) 0.039
a For SI conversions from μg/L to μmol/L, multiply by 0.0133. b Data are given as weighted median (interquartile range). c Weighted percentage.
d
P-values were obtained based on linear regression models comparing arsenic levels by participant characteristics. e GFR based on bedside CKiD equation for participants ages 12 to 17 years, and by the equation provided by the
Chronic Kidney Disease Epidemiology Collaboration (CKD-EPI) for participants ages 18 years and above. ef Undetectable: serum cotinine < 0.015 ng/mL; Involuntary: 0.015 – 10.0 ng/mL; Active: >10.0 ng/mL
f g Underweight: BMI < 5th percentile < (12-17 years) or BMI < 18.5 kg/m2 (≥18 years); Normal weight: BMI 5th to
89th percentile < (12-17 years) or BMI 18.5 to 24.99 kg/m2 (≥ 18 years); Overweight: BMI 90th to 94th percentile <
(12-17 years) or BMI 25 to 29.99 kg/m2 (≥ 18 years); Obese: BMI ≥ 95 percentile (12-17 years) or BMI ≥ 30 kg/m2
(≥ 18 years).
g h Pre-hypertension: Self-report or SBP or DBP 90-94th percentile (12-17 years) or SBP 120-139 mmHg or DBP
80-89 mmHg (≥ 18 years); Hypertension: self-report or SBP or DBP ≥ 95 percentile (12-17 years) or SBP ≥ 140 mmHg or DBP ≥ 90 mmHg.
h i Self-report, fasting blood sugar > 126 mg/dL, or hemoglobin A1c ≥ 6.5%.
Table 2. Difference in eGFR Associated with Urinary Total Arsenic and DMA Levels; Adjusted for Urinary Creatininea
Characteristic N Unadjusted Model 1b Model 2c Model 3d
Total Arsenice 1,253 -1.3 (-2.8, 0.2) 1.03 (-0.8, 2.8) 1.2 (-0.5, 2.9) 4.0 (1.0, 7.1)
Arsenic quartile
1 (<3.6 μg/L) 315 0 (ref) 0 (ref) 0 (ref) 0 (ref)
2 (3.6 – 6.8 μg/L) 313 -1.2 (-6.1, 3.7) 4.5 (0.4, 8.5) 4.5 (0.5, 8.4) 5.2 (1.3, 9.1)
3: (6.9 – 13.1 μg/L) 311 -3.4 (-7.1, 0.3) 3.0 (-1.8, 7.9) 3.3 (-1.7, 8.3) 5.0 (-0.3, 10.3) 4: (> 13.1 μg/L) 314 -2.8 (-7.0, 1.5) 5.0 (0.02, 9.9) 5.4 (0.4, 10.3) 10.1 (4.1, 16.1)
p-value for trend 0.118 0.141 0.103 0.012
DMAe 1,253 -1.7 (-3.6, 0.02) 2.9 (-0.5, 6.3) 3.0 (-0.2, 6.3) 4.3 (0.5, 8.0)
DMA quartile
1 (< 1.9 μg/L) 316 0 (ref) 0 (ref) 0 (ref) 0 (ref)
2 (1.9 – 3.5 μg/L) 312 -1.3 (-5.5, 2.9) 5.5 (0.4, 10.7) 5.5 (-0.5, 10.5) 6.2 (1.0, 11.3)
3 (3.6 – 6.0 μg/L) 312 -6.5 (-10.5, -2.5) 3.0 (-2.8, 8.9) 3.3 (-2.3, 8.9) 4.4 (-1.4, 10.2) 4 (>6.0 μg/L) 313 -2.4 (-6.0, 1.1) 8.4 (0.7, 16.2) 8.7 (1.3, 16.1) 10.7 (2.7, 18.7)
p-value for trend 0.035 0.069 0.046 0.023
a Data provided as the difference in eGFR in milliliters per minute per 1.73 m2 (95% confidence interval) with
arsenic species modeled continuously (per log unit increase) and as quartiles (lowest quartile is reference category).
b Model 1 is adjusted for age, gender, race/ethnicity, and log urinary creatinine. c Model 2 is further adjusted for BMI, log serum cotinine, hypertension, and diabetes. d Model 3 is further adjusted for log urinary arsenobetaine.
e Arsenic, DMA log-transformed for linear regression analysis.
Table 3. Difference in eGFR Associated with Urinary Total Arsenic and DMA Levels; Adjusted for Urine Osmolality a
Characteristic N Unadjusted Model 1b Model 2c Model 3d
Total Arsenice 1,253 -1.3 (-2.8, 0.2) -0.6 (-2.0, 0.9) -0.5 (-1.9, 1.0) -0.4 (-1.8, 1.1)
Arsenic quartile
1 (<3.6 μg/L) 315 0 (ref) 0 (ref) 0 (ref) 0 (ref)
2 (3.6 – 6.8 μg/L) 313 -1.2 (-6.1, 3.7) 1.2 (-3.2, 5.6) 1.0 (-3.3, 5.3) 1.2 (-3.1, 5.5) 3: (6.9 – 13.1 μg/L) 311 -3.4 (-7.1, 0.3) -1.9 (-5.6, 1.8) -1.8 (-5.5, 1.9) -1.3 (-4.7, 2.1) 4: (> 13.1 μg/L) 314 -2.8 (-7.0, 1.5) -0.1 (-4.4, 4.4) 0.1 (-4.4, 4.5) 1.8 (-2.2, 5.8)
p-value for trend 0.118 0.68 0.732 0.738
DMAe 1,253 -1.7 (-3.6, 0.02) -0.3 (-2.5, 1.9) -0.3 (-2.4, 1.8) -0.01 (-1.9, 1.9)
DMA quartile
1 (< 1.9 μg/L) 316 0 (ref) 0 (ref) 0 (ref) 0 (ref)
2 (1.9 – 3.5 μg/L) 312 -1.3 (-5.5, 2.9) 0.6 (-3.4, 4.6) 0.6 (-3.2, 4.4) 0.8 (-2.9, 4.6) 3 (3.6 – 6.0 μg/L) 312 -6.5 (-10.5, -2.5) -3.6 (-7.3, 0.2) -3.5 (-7.0, 0.01) -3.1 (-6.3, 0.1) 4 (>6.0 μg/L) 313 -2.4 (-6.0, 1.1) 0.6 (-4.0, 5.3) 0.6 (-3.8, 5.0) 1.5 (-2.3, 5.2)
p-value for trend 0.035 0.824 0.817 0.973
a Data provided as the difference in eGFR in milliliters per minute per 1.73 m2 (95% confidence interval) with
arsenic species modeled continuously (per log unit increase) and as quartiles (lowest quartile is reference category).
b Model 1 is adjusted for age, gender, race/ethnicity, and urine osmolality.
c Model 2 is further adjusted for BMI, log serum cotinine, hypertension, and diabetes. d Model 3 is further adjusted for log urinary arsenobetaine.
e Arsenic, DMA log-transformed for linear regression analysis