立即咬合受力之人工牙根的研發與生物力學分析(2/3)
Development and biomechanical analysis of immediately loaded
implant (2/3)
計畫編號: NSC98-2320-B-039-005-MY3 執行期限:99 年 8 月 1 日至 100 年 7 月 31 日 主持人:黃恆立 中國醫藥大學 牙醫系 [email protected] 共同主持人:陳遠謙 講師(醫師) 中國醫藥大學 牙醫系 林殿傑 助理教授中國醫藥大學 口腔衛生學系 計畫參與人員:林允德、何榮廷、陳昭伶 一、 中文摘要 第二年的研究計畫中,主要為兩項實驗,第 一個實驗分析立即咬合受力人工牙根在不同緻密 骨厚度與鬆質骨強度下,其人工牙根初始穩定度 與周圍骨質的受力(e.g. 應變)的影響。第二個實驗 主要針對自體移植骨植入到顎骨內,經過療育期 後,以微米級電腦斷層掃描,分析移植骨與原有 顎骨之骨礦化密度、三維骨小梁結構外型(e.g. 骨 體積、骨小梁厚度、骨小梁數量、骨小梁連結度.. 等等)的差異。研究結果顯示,立即咬合植牙的穩 定度(亦稱為人工牙根初始穩定度)會隨著緻密骨 厚度與鬆質骨強度影響,基本上,緻密骨厚度愈 厚與鬆質骨強度愈強,穩定度會較好,但是穩度 度與緻密骨厚度,與穩度度與鬆質骨強度,並不 是呈現線性的關係。在薄的緻密骨厚度與弱的鬆 質骨強度之骨質,會大幅提高立即咬合受力之人 工牙根周圍骨質的受力(應變值),有可能會提高 人工牙根失敗的危險性。此外,使用自體骨塊為 移植骨材,其移植骨與本身顎骨之間的骨密度與 骨小梁外型,除了骨小梁厚度與骨小梁連接度, 其他並無太大的差異。 關鍵詞:立即咬合受力人工牙根、初始穩定度、 骨應變、鎖入扭力、牙周測試值、共振頻率分析、 緻密骨厚度、鬆質骨強度、微米級電腦斷層掃描、 骨礦化密度、三維骨小梁結構外型 AbstractOn the second year of this research plan, there are two research topic carried. The first study was to evaluate the effects of cortical bone thickness and trabecular bone elastic modulus on the strain in the bone surrounding an immediately loaded implant. The second study was to to determine the relationships and differences in three-dimensional (3D) bone mineral density (BMD) and microtrabecular structures between autogenous bone
grafts and their adjacent native bone after a healing period. According to the results, we found that the initial stability at the time of implant placement is influenced by both the cortical–bone thickness and the elastic modulus of trabecular bone; however, these parameters are not totally linearly correlated with ITV, PTV, and ISQ. The placement of an immediately loaded implant in cases with thin cortical bone and/or weak trabecular bone can induce extreme bone strains and may increase the risk of implant failure. Additionally, when using autogenous bone as a graft material, the BMD and micromorphologic conditions of grafted bone were not influenced by the condition of the native bone in the maxilla. Differences were found in trabecular thickness, and the connectivity of trabeculae between grafted bone and native bone.
Keywords: immediately loaded implant, primary implant stability, bone strain, insertion torque, Periotest, resonance frequency analysis, cortical–bone thickness, elastic modulus of trabecular bone, micro-CT, bone mineral density, trabecular-structure parameters.
二、 緣由與目的
There are two research topics for the second year of this research plan.
I. [Initial stability and bone strain evaluation of the immediately loaded dental implant: an in vitro model study]; this study applied strain-gauge analysis to artificial bone samples to investigate how the biomechanical performance (e.g., bone strain) is related to the precise characteristics of bone quality and quantity—including the thickness of cortical bone and the elastic modulus of trabecular bone—of an immediately loaded implant. In addition, the relationships of the primary implant stability with the cortical–bone thickness and the elastic modulus of trabecular bone were examined by measuring the implant stability quotient (ISQ), ITV, and PTV.
II. [Three-dimensional bone structure and bone mineral density evaluations of autogenous bone graft after sinus augmentation: a micro-CT analysis]; another purpose of this study was to investigate the relationship between micro-CT measurement parameters describing BMD and 3D microtrabecular indexes (Table 1) in autogenous bone graft and its adjacent native bone after a healing period following maxillary sinus bone grafting. In addition, the relative effects of BMD and percentage of bone volume (BV; BV/tissue volume, TV) on the other trabecular-bone structures, including bone-specific surface [bone surface (BS)/BV] and trabecular thickness (Tb.Th)…etc were also evaluated.
三、 研究方法
I. First research topic
Specimen preparation
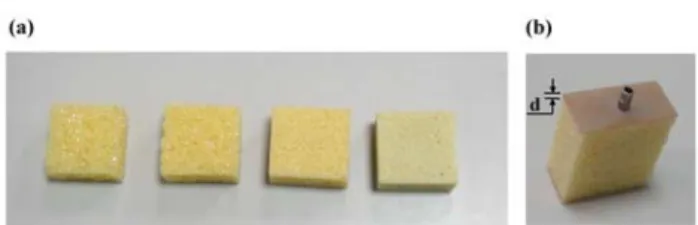
Models of trabecular bone with four elastic moduli were created by attaching closed-cell foam representing trabecular bone with elastic moduli of 137, 47.5, 23, and 12.4 MPa (models 1522-09, 1522-10, 1522-11, and 1522-12; Pacific Research Laboratories, Vashon Island, WA, USA) to 2-mm-thick commercially available synthetic cortical shell (model 3401-01; Pacific Research Laboratories) with an elastic modulus of 16.7 GPa (Fig. 1a). The range of the elastic moduli of trabecular bone used in this study was based on the work of Misch et al. (1999). Similarly, closed-cell-foam rigid trabecular bone models with an elastic modulus of 23 MPa (model 1522-11, Pacific Research Laboratories) were prepared with and without attaching cortical shells of three thicknesses (1, 2, and 3 mm for models 3401-07, 3401-01, and 3401-02, respectively; Pacific Research Laboratories) (Fig. 1b). The synthetic bone had a rectangular shape with dimensions of 38 cm × 20 cm × 42 cm. Three specimens of each combination of artificial foam bone were prepared for implant stability measurements.
Implant stability measurement
The peak ITV was measured by inserting a 3.75 mm × 13 mm self-tapping implant (ICE®, 3i Implant Innovation, Palm Beach, FL, USA) into a 3.2-mm-diameter pilot hole into the bone block specimen by using a digital torque meter (TQ-8800, Lulton Electronic Enterprise, Taipei, Taiwan). After placing the implant, a resonance frequency analyzer (OsstellTM, Osstell, Göteborg, Sweden) was used to measure ISQ. The L-shaped transducer (Type F1 L5, Osstell) was kept perpendicular to the implant and was screwed by hand into the implant body as
recommended by the manufacturer (Fig. 2a). In order to standardize the procedure, all measurements of ISQ were made with the transducer perpendicular to the jaw. After connecting a 6-mm-long temporary abutment (hexed temporary cylinder, 3i Implant Innovation), the implant mobility was measured using the PeriotestTM device (Siemens, Bensheim, Germany) (Fig. 2b). The tip of the measurement device was positioned perpendicularly at 2 mm from the abutment, and it impacted the implant four times per second for 4 seconds (Alsaadi et al. 2007). ITV, ISQ, and PTV were all measured three times for each specimen.
Strain gauge measurement
A self-developed jig was designed with an adjustable rotational screwing device so that both a vertical load and a 45-degree lingual lateral force could be applied in the experiments. Each loading procedure involved applying a force of 130 N to the cylindrical abutment using a universal testing machine (JSV-H1000, Japan Instrumentation System, Nara, Japan) with a head speed of 1 mm/min (Fig. 3a). Rectangular rosette strain gauges (KFG-1-120-D17-11L3M3S, Kyowa, Tokyo, Japan) were attached to the buccal and lingual sides of the crestal cortical region around the implant using cyanoacrylate cement (CC-33A, Kyowa) (Fig. 3b). Signals corresponding to the three independent strains εa, εb, and εc measured by the rosette strain gauge were sent to a data acquisition system (NI CompackDAQ, National Instruments, Austin, TX, USA) and analyzed by the associated software (LabVIEW SignalExpress, National Instruments). After each measurement was repeated three times for each specimen, the maximum (εmax) and minimum (εmin) principal strains were obtained (Hsu et al. 2009).
Statistical analysis
The peak minimum principal strains under vertical and lateral loading for the designed scenarios of cortical–bone thickness and elastic modulus of trabecular bone were summarized as medians and standard deviation values. Kruskal-Wallis test and Multiple comparison with Bonferroni test were used to assess differences. The same approach was applied for the measures of stability (ITV, PTV, and ISQ) in the models with various cortical–bone thicknesses and elastic moduli of trabecular bone. All statistical analysis was performed with SAS software (SAS v9.1.2, SAS Institute, Cary, NC, USA) with an alpha value of 0.05.
Fig. 1. (a) Artificial jawbone specimens of trabecular bone with elastic moduli of 12.4, 23, 47.5, and 137 MPa (from left to right). (b) Cortical shells with various thicknesses (d=0, 1, 2, and 3 mm) were attached to trabecular bone with an elastic modulus of 23 MPa.
Fig. 2. (a) L-shaped transducer set up as
recommended by the manufacturer (Osstell) after the bone model was fixed into the jig. (b) PTVs were acquired after the rod of the Periotest device touched the abutment.
Fig. 3. (a) Application of forces to the top of the
implant by a loading machine. (b) Two rosette
strain gauges were attached to the bone surface
buccolingually near the implant.
II. Second research topic
Bone biopsy preparation
Ten samples from six men and four women aged 44–58 years had undergone the surgery of sinus floor augmentation with autogenous bone grafts
because of insufficient height of alveolar bone to allow dental implant placement. None of the patients had systemic pathologies affecting immune system functioning, non-insulin-dependent diabetes mellitus, or previous history of drug abuse. After being informed about the procedure, all of the patients gave written informed consent to participate in the study. The study protocol was approved by the Institutional Committee of China Medical University Hospital, Taichung, Taiwan (DMR96-IRB-180 & DMR97-IRB-260). After a 4- to 5-month healing period for maturation of autogenous bone graft, ten rod-shaped bone cores containing the native and grafted region of bone tissue were retrieved by trephine osteotomy (4.0 mm inner diameter) from the grafted site during surgical reentry for dental implant placement (Fig. 4). After receiving the biopsy specimens of bone tissue, the specimens were placed immediately in 10% neutral buffered formalin solution.
Micro-CT scanning
The samples were scanning with a high-resolution cone-Beam micro-CT system (SkyScan 1076, SkyScan, Aartselaar, Belgium) to quantify the BMD (g/cm3) and other parameters related to 3D microarchitectures of trabecular bone. Before scanning, the bone biopsy samples were rinsed and stored in physiological saline solution (0.9%) within a polypropylene tube. X-ray source were set at 49 kV and 200 μA with the aid of a 0.5-mm-thick aluminum filter to optimize the contrast, a 360° rotation, a rotation step of 0.4° (2700 images per scan), three-frame averaging, and an exposure time of 1180 ms. The image resolution was fixed at a pixel size of 17.2 μm. During scanning, two BMD phantoms (SkyScan) that were 4.0 mm in diameter, 5.5 mm long, and had calcium hydroxyapatite densities of 0.25 and 0.75 g/cm3 were placed near to the bone biopsy samples to aid BMD calculation.
NRecon reconstruction software (NRecon v.1.4.4, SkyScan) was used to create two-dimensional, 1000×1000-pixel images. For the reconstruction parameters, ring artifact correction and smoothing were fixed at zero, and the beam hardening correction was set at 0%. Contrast limits were applied following SkyScan instructions. The lower limit was zero so that the density scale had a zero origin. The upper limit was at the top end of the brightness spectrum, representing the highest bone density value. After reconstruction, the volume of interest (VOI) was selected within the reconstructed images of water to calibrate the standard unit of X-ray computed tomography density (Hounsfield unit, HU) by using CTAn analysis software (v.1.6.0, SkyScan). A similar procedure was used to measure the HU values of two BMD phantom rods, followed
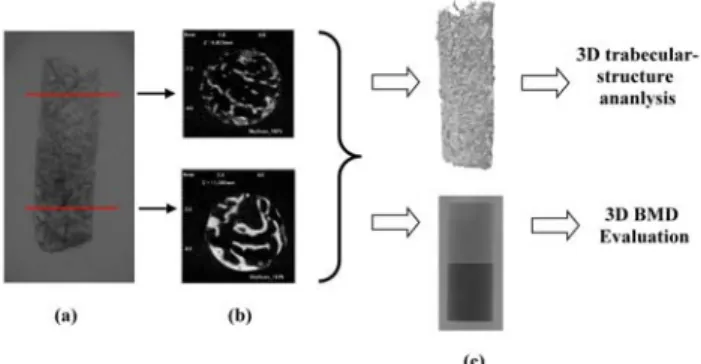
by conversion from HU to BMD values (g/cm3). Once the calibration of BMD against HU values was complete, the same VOI was applied to the images of the bone biopsy samples to calculate the BMD values of the grafted and native bone. The 3D structure of bone biopsy (Fig. 5) was also analyzed for grafted bone and native bone individually by CTAn. The analyzed parameters of 3D trabecular structure included the percentage of bone volume (BV/TV, %), Trabecular thickness (Tb.Th, pexel), trabecular number (Tb.N, 1/pixel), trabecular separation (Tb.Sp, pixel), trabecular pattern factor (Tb.Pf, 1/pixel), and the structure model index (SMI). BV/TV represents the percentage of bone volume (BV) relative to total volume (TV) within a volume of interest (VOI). Tb.Th indicates the mean thickness of individual trabecular bones within a VOI. Tb.N signifies the number of traversals across a trabecular bone per unit length on a linear path within a VOI. Tb.Sp represents the relative spacing between individual trabecular bones within a VOI. Tb.Pf was developed by Hahn et al. in 1992(20) and A lower Tb.Pf signifies better-connected trabecular lattices, while a higher Tb.Pf indicates a more disconnected trabecular structure. SMI was derived according to the method of Hildebrand and Ruegsegger in 1997(21). SMI is used to characterize trabecular bone according to its transition from plate-like to rod-like architecture. An ideal plate and cylinder have SMI values of 0 and 3, respectively.
Statistical and correlation analyses
All of the micro-CT measurement parameters are summarized as mean and standard deviation values. Comparisons of the parameters between native bone and grafted bone and between male and female were analyzed with Student’s t-test. For the significant results (P≦0.05) of parameters between native bone and grafted bone, the linear regression models were also performed and the goodness of fit for regression models was qualified using R2 values. All of the statistical analyses were executed using SAS software (SAS v9.2, SAS Institute, Cary, NC, USA). The level of statistical significance was set at
α=0.05.
Fig. 4. Grafted bone biopsy sample obtained using a 4.0-mm (inner diameter) trephine bur.
Fig. 5. Two-dimensional X-ray image of the grafted bone biopsy sample (a) and its two-dimensionally reconstructed images which were used to set the region of interest (ROI) in the grafted (upper) and native (lower) bone (b), were used to create a three-dimensional (3D) construction model (upper) for trabecular-structure analysis and for 3D bone mineral density (BMD) evaluation by comparison with BMD phantoms of 0.25 and 0.75 g/cm3 (lower) (c).
四、 結果與討論
Strain gauge analysis
Peak strains in bone (minimum principal strains) around immediately loaded implants were at least twofold higher for lateral loading than for vertical loading. The peak bone strains differed significantly between the models with cortical bone thicknesses of 1, 2, and 3 mm in both Kruskal-Wallis test and Multiple comparison with Bonferroni test (p < 0.05) (Table 1). The bone strains in the model with a 1-mm-thick cortical bone were 10.3% and 52.1% higher than those in models with 2- and 3-mm-thick cortical bone, respectively, for vertical loading (Fig. 4a), and 35.0% and 62.0% for lateral loading.
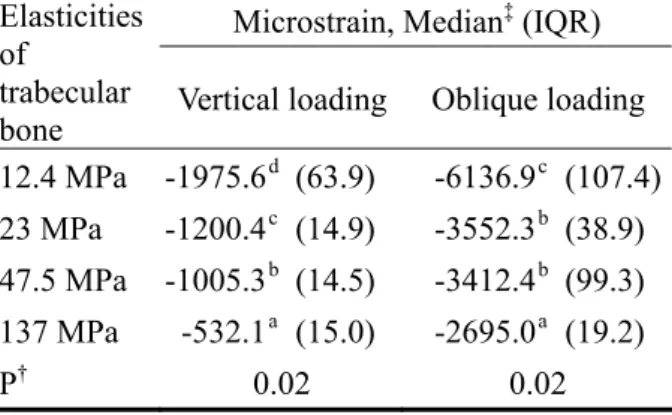
The highest strain values (minimum principal strains) differed significantly between the models with trabecular bone with elastic moduli of 12.4, 23, 47.5, and 137 MPa in Kruskal-Wallis test and Multiple comparison with Bonferroni test (p < 0.05) (Table 2). For vertical loading the bone strain was 39.0%, 49.1%, and 73.1% higher in the model with 12.4-MPa trabecular bone than those with 23-, 47.5-, and 137-MPa trabecular bone, respectively (); the corresponding differences for lateral loading were 42.4%, 44.0%, and 56.2% .
Primary stability of implant
ITV, ISQ, and PTV all varied significantly with the thickness of cortical bone in Kruskal-Wallis test (p ≦ 0.05): ITV rose increasingly while ISQ rose decreasingly when the thickness of cortical bone increased (Table 3). In addition, PTV was reduced
decreasingly when cortical bone was thicker (Table 3).
ISQ and PTV varied significantly with the elastic modulus of trabecular bone in Kruskal-Wallis test (p
< 0.05) (Table 4)
Table 1. Peak values of the minimum principal strain of bone around implants with four
cortical-bone thicknesses (the elastic modulus of trabecular bone was 23 MPa). † indicates
Kruskal-Wallis test. ‡ represents Multiple comparison with Bonferroni test; Medians with the same letter are not significantly different at the 0.05 level.
Microstrain, Median‡ (IQR) Thickness of
cortical bone Vertical loading Oblique loading 1 mm -1340.7 c (8.7) -5510.7 c (482.1) 2 mm -1200.4 b (14.9) -3552.3 b (38.9) 3 mm -645.3 a (14.6) -1310.6 a (20.0)
P† 0.03 0.03
Table 2. Peak values of the minimum principal strain of bone around implants with four elastic moduli of trabecular bone (the cortex thickness was 2 mm). † indicates Kruskal-Wallis test. ‡ represents Multiple comparison with Bonferroni test; Medians with the same letter are not significantly different at the 0.05 level.
Microstrain, Median‡ (IQR) Elasticities
of
trabecular
bone Vertical loading Oblique loading 12.4 MPa -1975.6 d (63.9) -6136.9 c (107.4) 23 MPa -1200.4 c (14.9) -3552.3 b (38.9) 47.5 MPa -1005.3 b (14.5) -3412.4 b (99.3) 137 MPa -532.1 a (15.0) -2695.0 a (19.2)
P† 0.02 0.02
Differences and correlations between the
grafted and native bone parameters
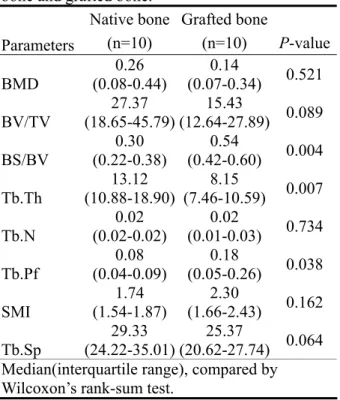
Table 5 lists the median values and interquartile
ranges of all measured parameters for the
grafted and native bone. Significant differences
between the two bone types were observed for
only three of these parameters: BS/BV, Tb.Pf,
and Tb.Th (p<0.05). BS/BV and Tb.Pf were
higher for grafted bone [0.54 (1/pixel) and 0.18
(1/pixel), respectively] than for native bone [0.3
(1/pixel) and 0.08 (1/pixel), respectively]. The
Tb.Th was 38% lower for the grafted bone
(8.15 pixels) than for native bone (13.12 pixels).
Table 3. ITV, PTV, and ISQ of implants with four cortical-bone thicknesses (the elastic modulus of trabecular bone was 23 MPa). † indicates
Kruskal-Wallis test. ‡ represents Multiple
comparison with Bonferroni test; Medians with the same letter are not significantly different at the 0.05 level.
Evaluation Approaches, Median‡ (IQR) Thickn
ess of cortical
bone ITV PTV ISQ
None 11.1c (0.7) 9.0a (6.0) 65.0c (7.0) 1 mm 16.6bc(4.1) 5.0b (2.0) 75.0ab (3.0) 2 mm 22.1b (10.0) 2.0c (0.0) 79.0abc (14.0) 3 mm 47.0a (2.0) 2.0b (2.0) 80.5ab (1.0)
P† 0.02 0.02 0.05
Table 4. ITV, PTV and ISQ of implants with trabecular bone with four elastic moduli (the cortex thickness was 2 mm). † indicates Kruskal-Wallis test. ‡ represents
Multiple comparison with Bonferroni test; Medians with the same letter are not significantly different at the 0.05 level.
Evaluation Approaches, Median‡ (IQR) Elasticities
of
trabecular
bone ITV PTV ISQ
12.4 MPa 21.2b (5.1) 6.0a (1.0) 76.0a
(9.0)
23 MPa 22.1ab(10.0) 2.0b (0.0) 79.0a(14.0)
47.5 MPa 27.1ab(8.5) -1.0c (2.0) 83.0a(3.0)
137 MPa 31.2a (7.0) -1.0c (0.0) 88.0a
(4.0)
Table 5. The median (interquartile range) values of micro-CT measurement parameters of native bone and grafted bone.
Native bone Grafted bone
Parameters (n=10) (n=10) P-value BMD 0.26 (0.08-0.44) 0.14 (0.07-0.34) 0.521 BV/TV 27.37 (18.65-45.79) 15.43 (12.64-27.89) 0.089 BS/BV 0.30 (0.22-0.38) 0.54 (0.42-0.60) 0.004 Tb.Th 13.12 (10.88-18.90) 8.15 (7.46-10.59) 0.007 Tb.N 0.02 (0.02-0.02) 0.02 (0.01-0.03) 0.734 Tb.Pf 0.08 (0.04-0.09) 0.18 (0.05-0.26) 0.038 SMI 1.74 (1.54-1.87) 2.30 (1.66-2.43) 0.162 Tb.Sp 29.33 (24.22-35.01) 25.37 (20.62-27.74) 0.064 Median(interquartile range), compared by Wilcoxon’s rank-sum test.
五、 計畫成果自評 近年政府積極推動醫療產業,特別是牙科醫 療器材的研發,雖然傳統植牙之人工牙根的設計 已經相當成熟,但在”立即咬合植牙”為著眼點的 人工牙根設計,仍是很新的領域。本研究針對人 工牙根之植體外型、表面處理粗糙度、周圍骨質 (包含移植骨)的強度,找出最佳之組合與設計。本 研究計劃,第二年重點於 a. 植體外型、b.表面處 理粗糙度與 c.移植骨樣本—微米級斷層掃瞄分 析,其學術成果與應用價值,簡述如下: 1. 人體移植骨樣本分析,已完成第二年度的分 析,研究成果已投稿至SCI 期刊-Clinical Oral Implants Research,目前為 Accept 階段,研究 成果可為人體移植骨是否適合於立即咬合植 牙之評估。
2. 人工植牙最佳化分析--人工牙根外型,其研究 成果已發表於2010 年-SCI 期刊 Computers in Biology and Medicine,並找到較佳的設計參 數。 3. 人工植牙最佳化分析--人工牙根之表面粗糙 度,此部分已完成實驗,將於2011 年六月完 成結果分析,且已找出較佳之設計參數,預計 今年研究成果投稿於SCI 期刊發表。 4. 原訂第三年研究計畫之實驗,體外實驗分析— 研 究 成 果 已 投 稿 至 SCI 期刊 -Clinical Oral Implants Research,目前為 in-press 階段,研究 成果可提供立即咬合植牙於不同骨質(緻密骨 厚度與鬆質骨強度)之穩定度與骨質受力的生
物力學分析資訊,已提前達成部分研究成果, 研究成果發表於兩篇SCI 期刊—Clinical Oral Implants Research , 目 前 已 刊 出 , 另 一 篇 Clinical Implant Dentistry and Related Research,目前為 In-press 階段 ,明年度(第 三年度)研究計劃將繼續完成其餘實驗,並持 續發表於國際期刊、撰寫專利,目前已發表 SCI 論文,詳列如下:
Heng-Li Huang*, Jui-Ting Hsu, Lih-Jyh Fuh, Dan-Jae Lin, Michael YC Chen. “Biomechanical Simulation of Various Surface Roughnesses and Geometric Designs on an Immediately Loaded Dental Implant”, Computers in Biology and Medicine, 40:525-532, 2010. (Corresponding author) (SCI, Category: Computer Science, Interdisciplinary applications: 49 / 95≒51.6%,IF=1.269)
Heng-Li Huang, Yin-Yu Chang, Dan-Jae Lin, Yu-Fen Li, Kuan-Ting Chen, Jui-Ting Hsu*, “Initial stability and bone strain evaluation of the immediately loaded dental implant: an in vitro study”, Clinical Oral Implants Research, 22: 691-698, 2011. (SCI, Category: Dentistry, Oral Surgery & Medicine: 6 / 64≒9.4%,IF=2.92)
Heng-Li Huang*, Michael YC Chen, Jui-Ting Hsu, Yu-Fen Li, Ching-Han Chang, Kuan-Ting Chen.. “Three-dimensional bone structure and bone mineral density evaluations of autogenous bone graft after sinus augmentation: a microcomputed tomography analysis”, Accept, Clinial Oral Implants Research, Accept, 2011. (SCI, Category: Dentistry, Oral Surgery & Medicine: 6 / 64≒9.4%,IF=2.92)
Jui-Ting Hsu, Lih-Jyh Fuh, Ming-Gene Tu, Yu-Fen Li, Kuan-Ting Chen, Heng-Li Huang*, “The effects
of cortical bone thickness and trabecular bone strength on non-invasive measures of the implant primary stability using synthetic bone models”, Clinical Implant Dentistry and Related Research, In-press, 2010. (Corresponding author) (SCI, Category: Dentistry, Oral Surgery & Medicine: 9 / 64≒14.1%,IF=2.452).