Growth and Thyroid Function in Children With In Utero
Exposure to Dioxin: A 5-y Follow-Up Study
PEN-HUA SU, JIA-YUH CHEN, JEIN-WEN CHEN, AND SHU-LI WANG
Department of Pediatrics [P.-H.S., J.-Y.C.], School of Medicine [P.-H.S., J.-Y.C.], and Department of Public Health [S.-L.W.], Chung Shan Medical University Hospital, Taichung 402, Taiwan; Division of Environmental Health and Occupational Medicine [J.-W.C.,
S.-L.W.], National Health Research Institutes, Zhunan 350, Taiwan
ABSTRACT: Because placental polychlorinated dibenzo-p-dioxins,
dibenzofurans (PCDD/Fs) levels are associated with decreased free thyroxine (FT4) and thyroid stimulating hormone (TSH) in neonates, we assessed development by gender and maternal PCDD/Fs exposure at years 2 and 5 in 92 mother and newborn pairs. RIA quantified thyroid, sex, and growth hormones. Of 200 subjects followed up from November 2000, 136 and 149 were observed at year 2 and year 5, respectively. PCDD/Fs exposure levels were low (n⫽ 35) or high (n ⫽ 35) in 70 subjects at year 2, low (n⫽ 21) or high (n ⫽ 20) in 41 at year 5. Height, weight, BMI, and head circumference were significantly higher in males, chest girth significantly higher in females at year 2. Significantly, more girls had higher bone age (BA) and chronological age (CA) at both times. Height, weight, FT4⫻ TSH, and transthyretin (TTR) at year 2; and height, triiodothyronine, and IGF-1 at year 5 differed significantly by PCDD/Fs level. In females, height, weight, CA, BA, and thyroid hormones differed significantly at year 2. In males, FT4⫻ TSH at year 2 and IGF-1 at year 5 were significantly higher in the high PCDD/Fs group. In utero exposure to PCDD/Fs differen-tially affects growth and hormone levels in male and female pre-school children. (Pediatr Res 67: 1–2, 2010)
D
ioxins [polychlorinated p-dioxins, dibenzo-furans (PCDD/Fs)] are highly toxic environmental con-taminants, which are lipophilic and resistant to biodegrada-tion. These compounds enter the human body through the food chain and finally accumulate in adipose tissue (1). A series of deleterious health effects are thought to be associated with organochlorine exposure. These include fetal and infant growth retardation and developmental abnormalities (2,3), altered reproductive capacity (4,5), carcinogenicity (6,7), cog-nitive deficits (8), and impaired thyroid function (9). It has been confirmed that PCDD/Fs can be transferred from mother to fetus via the placenta (10) and from mother to infant via breast milk (11). The effects of the endocrine disruption during these critical stages of early development might persist long after birth.Similar to other industrialized and developing countries, Taiwan is confronted with the problem of environmental
PCDD/Fs contamination. It has been reported that high
con-centrations of PCDD/Fs are more prevalent in central Taiwan
than other areas of Taiwan (12). In a previous study, we examined the association between in utero exposure to
PCDD/Fs/polychlorinated biphenyls (PCBs) and altered
thy-roid and growth hormone concentrations in newborns from central Taiwan (13), we found that after adjusting for other dioxins and PCB congeners in neonates from the general population, the multiplied concentration of free thyroxine (FT4) ⫻ thyroid stimulating hormone (TSH) decreased with increasing levels of non-ortho PCBs in the placenta. In the same study, we also noted a significant and positive associa-tion between thyroxine (T4) and thyroid-binding globulin concentrations with levels of PCDD/Fs (13).
Because thyroid hormones are crucial for growth and de-velopment, thyroid dysfunction in early infancy/childhood may adversely impair these processes and have serious long-term consequences. Hence, we conducted follow-up assess-ments at preschool ages for the cohort of neonates in our previous study (13). Because a previous report found that schoolchildren (aged 7.5–15 y) whose serum level of PCBs was two to four times higher than normal children had no significant impairment of thyroid function (14), the focus of this study was the relationship between in utero exposure to PCDD/Fs and thyroid function and growth hormones. The objectives of the follow-up study were to examine possible abnormalities in growth and development, bone age (BA) and growth, and hormones related to neurodevelopment in chil-dren aged between 2 and 3 y and 5 and 6 y who were exposed to differing levels of PCDD/Fs in utero. Specifically, we made comparisons between children who were exposed to low and high levels of PCDD/Fs.
MATERIALS AND METHODS
Subjects. A total of 92 mother and newborn pairs were recruited from the general population in central Taiwan. We consecutively followed up the subjects (n ⫽ 200) of our previous study (13) from November 2000 to February 2007. We studied the subjects at 2–3 y of age (n⫽ 188, during 2003) and at 5– 6 y (n⫽ 149, during 2006–2007). These groups are referred to as year 2 and year 5, respectively. Children were also classified into low exposure and high exposure groups by the cutoff value 15 pg-TEQ/g lipid based on the mother’s PCDD/Fs TEQ levels. This study was approved by the
Received June 7, 2009; accepted October 13, 2009.
Correspondence: Shu-Li Wang, Ph.D., Division of Environmental Health and Occu-pational Medicine, National Health Research Institutes, 35 Keyan Road, Zhunan, Miaoli County 350, Taiwan; e-mail: [email protected], [email protected]
This work was supported by grants EO-097-PP-05 and EO-098-PP-03 from the National Health Research Institutes.
Abbreviations: BA, bone age; CA, chronological age; E2, estradiol; FT4,
free thyroxine; IGFBP-3, insulin-like growth factor binding protein 3; PCBs, polychlorinated biphenyls; PCDD/Fs, polychlorinated dibenzo-p-dioxins, diben-zofurans; T3, triiodothyronine; T4, thyroxine; Tg, thyroglobulin; TRAb, TSH
receptor autoantibody; TSH, thyroid stimulating hormone; TTR, transthyretin
Copyright © 2010 International Pediatric Research Foundation, Inc.
1
AQ:1
ethics review committee of our university hospital, and written parental consent was obtained for all participants. The study abided by the ethical standards of the Declaration of Helsinki (15).
Measurements and blood sampling. Demographic information included maternal age, gestational age, and infants’ age, gender, height, weight, BMI, head circumference, chest girth, chronological age (CA), BA, and ratio of BA/CA. Body weight and height were compared with the population curve (data were obtained from the Taiwanese Department of Health) at each visit. Standing height was measured in triplicate using a wall-mounted stadiometer. BMI was calculated by dividing body weight (kg) by the square of height in meters (m2). Left hand radiographs were taken, and BA was determined using
the method of Greulich and Pyle (16).
In laboratory analysis, thyroid, sex hormone, and growth factor concen-trations with respect to PCDD/F exposure level were collected for evaluation. Venous blood samples were obtained from children whose mothers’ PCDD/F TEQ levels were available in our database. Blood samples were immediately centrifuged and the serum frozen at⫺70°C for later analysis of triiodothy-ronine (T3), T4, FT4, TSH, T3 uptake, thyroglobulin (Tg), TSH receptor
autoantibody (TRAb) uptake, transthyretin (TTR), IGF-1, IGF binding protein 3 (IGFBP-3), testosterone, and estradiol (E2).
T3, T4, FT4, TSH, and T3uptake analysis. Serum T3, T4, free T4and TSH
concentrations, and T3uptake were measured using an automated
chemilu-minescent immunometric assay (Immulite 2000: Diagnostic Products Corp, Los Angeles, CA). Sensitivities were 19 ng/dL for T3, 0.3g/dL for T4, 0.002
IU/mL for TSH, and 1.6 g/mL for T3 uptake. Intra- and interassay
coefficients of variation (CV) were 4.4 and 5.3% for T3; 4.6 and 5.6% for T4;
and 5.1 and 6.4% for TSH. FT4⫻ TSH values were calculated based on the
rationale that, for a normal hypothalamic-pituitary axis, a decrease in T4
feedback inhibition to the hypothalamus resulted leads to TSH secretion by the anterior pituitary.
Tg analysis. Serum Tg levels were measured by immunoradiometric assay (RSR Ltd., Cardiff, UK). Sensitivity was 0.7 ng/mL, and the intra- and interassay CVs were 3.32 and 6.36%.
TRAb analysis. Serum TRAb levels were determined using a commer-cially available RIA kit (RSR limited, Cardiff, UK). Sensitivity of this assay was 5 units/L. Result was expressed as inhibition of TSH binding index, %⫽ 100⫻ (1⫺B/Bo). Intra- and interassay CVs were 4.15 and 6.02%.
TTR analysis. Serum TTR levels were measured using a kinetic nephelo-metric method by automated nephelometer (Beckman Coulter, Inc. Array System, Carlsbad, CA). The sensitivity of this assay was 1.17 mg/dL, and the intra- and interassay CV were 2.06 and 1.54%.
IGF-1 and IGFBP-3 analysis. Serum total IGF-I and IGFBP-3 levels were measured after acid extraction using commercial RIA kits (Diagnostic Systems Laboratories, Inc., Webster, TX). The sensitivities were 0.9 mg/L and 0.01 ng/mL for IGF-I and IGFBP-3, respectively. The intra- and inter-assay CV were 7.2 and 9.8% for IGF-I and 5.8 and 8.2% for IGFBP-3.
Testosterone analysis. Serum testosterone concentrations were measured by solid-phase, competitive chemiluminescent enzyme immunoassay (Immu-lite 2000 Advanced Immunoassay System, Siemens Medical Solutions Diag-nostics, Deerfield, IL). The sensitivity of this assay was 15 ng/dL. Intra- and interassay CVs were 9.7 and 12.0%.
E2analysis. Serum E2 levels were measured by RIA kit (Diagnostic
Systems Laboratories). Sensitivity was 2.2 pg/mL, and intra- and interassay CV were 7.5 and 9.3%.
Statistical analysis. In general analysis, data were expressed as mean⫾ SD for continuous variables and frequency with percentage for categorical variables. For comparison of difference in means between groups, a t test was performed for normally distributed data, and the nonparametric Wilcoxon rank sum test was performed for data that were not normally distributed. A
multiple regression analysis was performed with a stepwise selection for detecting the factors, which might affect the growth of hormone concentra-tions by adjusting the maternal age and sex of the infant. All comparisons were considered under a significance level␣ ⫽ 0.05. All data were analyzed using SAS version 9.0 (SAS Institute Inc., Cary, NC).
RESULTS
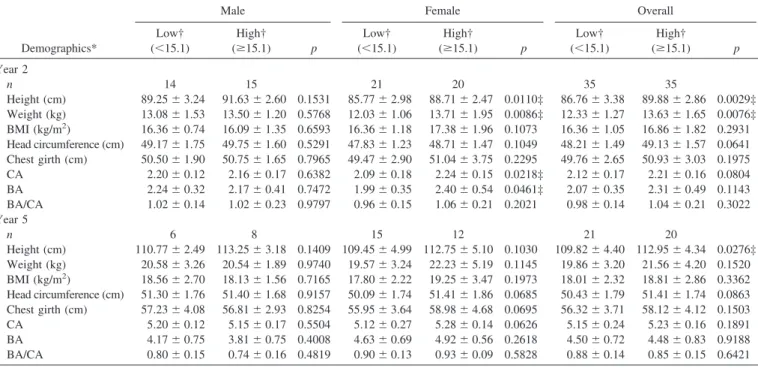
Summary of anthropomorphic measurements by infant gen-der is presented in Table 1. Significant increases were appar-ent for each variable between genders at both ages. At year 2, height, weight, BMI, and head circumference were signifi-cantly higher in boys than girls. Chest girth was signifisignifi-cantly higher in females at this visit. At year 5, there were no between-group differences in height, weight, BMI, head cir-cumference, or chest girth.
Using BA as an indicator of abnormal growth, we compared BA with CA at both visits. At year 2, children (male and female combined) had a mean BA of 2.14⫾ 0.45 y (n ⫽ 136; note: BA was not assessed for all subjects at year 2), whereas CA was 2.23⫾ 0.58 y (n ⫽ 194). The difference between BA and CA was borderline significant (p ⫽ 0.056). At year 5, however, mean BA (4.39 ⫾ 0.83 y) was significantly lower than mean CA (5.18⫾ 0.19 y) (p ⬍ 0.0001) (data not shown). BA and CA comparisons with respect to gender were con-ducted as well; no difference was detected at year 2, but males had a significantly lower mean BA than females at year 5 (p⫽ 0.0058). Significant differences were detected for the mean of ratio of BA and CA with respect to gender at both year 2 and year 5 (p⫽ 0.0160 for year 2; p ⬍ 0.0001 for year 5) (Table 1).
In considering anthropomorphic data and PCDD/Fs expo-sure levels, high level (ⱖ15 pg-TEQ/g lipid) and low level (⬍15 pg-TEQ/g lipid) are summarized by age and gender. Overall, height and weight were significantly different be-tween the PCDD/Fs exposure levels at year 2 (p⫽ 0.0029 for height and 0.0076 for weight). However, only height remained significant at year 5. In subgroups (male and female), it was found that height, weight, CA, and BA were significantly different between the PCDD/Fs exposure levels at year 2 for female (p⫽ 0.0110 for height, 0.0086 for weight, 0.0218 for CA, and 0.0461 for BA). In contrast, there were no such differences for males. Similarly, there were no significant differences be-tween exposure levels by gender at year 5 (Table 2).
For children who were exposed PCDD/Fs, T3, and IGF-1 concentrations at year 2 were significantly higher in females than males (p ⫽ 0.0302, 0.0434 for T3 and IGF-1, respec-Table 1. Summary of anthropomorphic demographics at year 2 and year 5
Demographics*
Year 2 Year 5
Male (n⫽ 69) Female (n⫽ 67) p Male (n⫽ 70) Female (n⫽ 79) p
Height (cm) 88.96⫾ 4.33 87.72⫾ 3.56 0.0342‡ 111.28⫾ 4.16 110.78⫾ 4.64 0.6000 Weight (kg) 13.45⫾ 1.91 12.65⫾ 1.66 0.0025† 20.33⫾ 2.45 20.27⫾ 3.87 0.9393 BMI (kg/m2) 16.96⫾ 1.64 16.41⫾ 1.57 0.0195† 18.24⫾ 1.82 17.99⫾ 2.81 0.6281 Head circumference (cm) 50.85⫾ 2.72 48.18⫾ 1.48 0.0362† 51.01⫾ 1.50 50.81⫾ 1.60 0.5534 Chest girth (cm) 48.64⫾ 1.47 49.96⫾ 2.83 0.0293† 56.95⫾ 2.99 56.53⫾ 4.06 0.5887 CA 2.20⫾ 0.28 2.25⫾ 0.27 0.1555 5.25⫾ 0.32 5.32⫾ 0.30 0.1815 BA 2.04⫾ 0.34 2.25⫾ 0.52 0.6419 3.99⫾ 0.82 4.84⫾ 0.59 0.0058 BA/CA 0.93⫾ 0.17 1.00⫾ 0.19 0.0160† 0.76⫾ 0.16 0.91⫾ 0.11 ⬍0.0001† * Demographics are presented as mean⫾ SD.
† p⬍ 0.05 indicates statistically significant difference between genders.
AQ:2
T1,AQ:3
tively). At year 5, FT4was significantly higher in males (p⫽ 0.0105), whereas IGF-1 levels were significantly higher in females (p⫽ 0.0433; data not shown).
The thyroid hormone, sex hormone, and growth factor concentrations with respect to PCDD/Fs exposure levels, high level (ⱖ15 pg-TEQ/g lipid) and low level (⬍15 pg-TEQ/g lipid) were summarized by gender for year 2 and year 5, respectively (Table 3 and Table 4). Overall, FT4⫻ TSH, TTR levels at year 2 and T3, IGF-1 at year 5 were significantly higher in the group with high dioxin/PCB exposure level than the group with low exposure level (p⫽ 0.0079, 0.0298 for FT4 ⫻ TSH and TTR at year 2, respectively; p ⫽ 0.0379,
0.0243 for T3and IGF-1 at year 5, respectively). In females, only T3and TTR concentrations at year 2 were significantly higher in the high PCDD/Fs exposure level than the low level (p ⫽ 0.0236, 0.0045 for T3and TTR, respectively), whereas there was no significant difference detected in concentrations at year 5. In males, FT4⫻ TSH at year 2 and IGF-1 at year 5 were significantly higher in the high PCDD/Fs exposure level than the low level (p⫽ 0.0122 for FT4⫻ TSH at year 2, and p⫽ 0.0076 for IGF-1 at year 5).
Results of multiple linear regression analysis adjusting for maternal age indicated that, overall, only FT4⫻ TSH at year 2 and IGF-1 at year 5 were significantly higher in the group Table 2. Summary of anthropomorphic variables with respect to PCDD/F exposure levels (low versus high) as determined at year 2 and year 5
Demographics*
Male Female Overall
Low† (⬍15.1) High† (ⱖ15.1) p Low† (⬍15.1) High† (ⱖ15.1) p Low† (⬍15.1) High† (ⱖ15.1) p Year 2 n 14 15 21 20 35 35 Height (cm) 89.25⫾ 3.24 91.63⫾ 2.60 0.1531 85.77⫾ 2.98 88.71⫾ 2.47 0.0110‡ 86.76⫾ 3.38 89.88⫾ 2.86 0.0029‡ Weight (kg) 13.08⫾ 1.53 13.50⫾ 1.20 0.5768 12.03⫾ 1.06 13.71⫾ 1.95 0.0086‡ 12.33⫾ 1.27 13.63⫾ 1.65 0.0076‡ BMI (kg/m2) 16.36⫾ 0.74 16.09⫾ 1.35 0.6593 16.36⫾ 1.18 17.38⫾ 1.96 0.1073 16.36⫾ 1.05 16.86⫾ 1.82 0.2931 Head circumference (cm) 49.17⫾ 1.75 49.75⫾ 1.60 0.5291 47.83⫾ 1.23 48.71⫾ 1.47 0.1049 48.21⫾ 1.49 49.13⫾ 1.57 0.0641 Chest girth (cm) 50.50⫾ 1.90 50.75⫾ 1.65 0.7965 49.47⫾ 2.90 51.04⫾ 3.75 0.2295 49.76⫾ 2.65 50.93⫾ 3.03 0.1975 CA 2.20⫾ 0.12 2.16⫾ 0.17 0.6382 2.09⫾ 0.18 2.24⫾ 0.15 0.0218‡ 2.12⫾ 0.17 2.21⫾ 0.16 0.0804 BA 2.24⫾ 0.32 2.17⫾ 0.41 0.7472 1.99⫾ 0.35 2.40⫾ 0.54 0.0461‡ 2.07⫾ 0.35 2.31⫾ 0.49 0.1143 BA/CA 1.02⫾ 0.14 1.02⫾ 0.23 0.9797 0.96⫾ 0.15 1.06⫾ 0.21 0.2021 0.98⫾ 0.14 1.04⫾ 0.21 0.3022 Year 5 n 6 8 15 12 21 20 Height (cm) 110.77⫾ 2.49 113.25 ⫾ 3.18 0.1409 109.45 ⫾ 4.99 112.75 ⫾ 5.10 0.1030 109.82⫾ 4.40 112.95 ⫾ 4.34 0.0276‡ Weight (kg) 20.58⫾ 3.26 20.54⫾ 1.89 0.9740 19.57⫾ 3.24 22.23⫾ 5.19 0.1145 19.86⫾ 3.20 21.56⫾ 4.20 0.1520 BMI (kg/m2) 18.56⫾ 2.70 18.13⫾ 1.56 0.7165 17.80⫾ 2.22 19.25⫾ 3.47 0.1973 18.01⫾ 2.32 18.81⫾ 2.86 0.3362 Head circumference (cm) 51.30⫾ 1.76 51.40⫾ 1.68 0.9157 50.09⫾ 1.74 51.41⫾ 1.86 0.0685 50.43⫾ 1.79 51.41⫾ 1.74 0.0863 Chest girth (cm) 57.23⫾ 4.08 56.81⫾ 2.93 0.8254 55.95⫾ 3.64 58.98⫾ 4.68 0.0695 56.32⫾ 3.71 58.12⫾ 4.12 0.1503 CA 5.20⫾ 0.12 5.15⫾ 0.17 0.5504 5.12⫾ 0.27 5.28⫾ 0.14 0.0626 5.15⫾ 0.24 5.23⫾ 0.16 0.1891 BA 4.17⫾ 0.75 3.81⫾ 0.75 0.4008 4.63⫾ 0.69 4.92⫾ 0.56 0.2618 4.50⫾ 0.72 4.48⫾ 0.83 0.9188 BA/CA 0.80⫾ 0.15 0.74⫾ 0.16 0.4819 0.90⫾ 0.13 0.93⫾ 0.09 0.5828 0.88⫾ 0.14 0.85⫾ 0.15 0.6421 * Demographics are presented as mean⫾ SD.
† Low and high levels for PCDD/Fs levels were categorized as⬍15, and ⱖ15 pg-TEQ/g lipid.
‡ p⬍ 0.05 indicates statistically significant difference between the high- and low-exposure levels for a given gender or overall.
Table 3. Thyroid and sex hormone, and growth factor concentrations with respect to PCDD/F exposure level at year 2
Variables*
Male Female Overall
Low† (⬍15.1) High† (ⱖ15.1) p Low† (⬍15.1) High† (ⱖ15.1) p Low† (⬍15.1) High† (ⱖ15.1) p n 14 15 21 20 35 35 T3(ng/dL) 186.79⫾ 41.05 188.06 ⫾ 23.89 0.9357 154.77⫾ 29.00 176.50 ⫾ 18.29 0.0236‡ 166.97 ⫾ 36.72 181.12 ⫾ 21.04 0.1281 T4(g/dL) 9.83⫾ 2.52 10.33⫾ 2.21 0.6568 9.30⫾ 2.79 9.36⫾ 1.71 0.9469 9.50⫾ 2.64 9.73⫾ 1.93 0.7310 TSH (mIU/L) 2.77⫾ 0.91 3.31⫾ 0.86 0.2129 2.54⫾ 1.05 3.19⫾ 1.44 0.1857 2.63⫾ 0.98 3.24⫾ 1.22 0.0697 T3uptake (%) 26.14⫾ 2.97 26.64⫾ 2.98 0.7816 28.37⫾ 4.51 27.97⫾ 1.89 0.7996 27.63⫾ 4.10 27.48⫾ 2.36 0.9035 FT4(ng/dL) 1.12⫾ 0.18 1.25⫾ 0.15 0.1291 1.13⫾ 0.23 1.20⫾ 0.23 0.4689 1.13⫾ 0.21 1.22⫾ 0.20 0.1479 FT4⫻ TSH 2.78⫾ 0.54 4.11⫾ 1.11 0.0122‡ 2.83⫾ 1.05 3.87⫾ 2.00 0.1155 2.81⫾ 0.88 3.97⫾ 1.67 0.0079‡ Tg (ng/dL) 42.04⫾ 19.69 35.82⫾ 11.54 0.4409 38.05⫾ 18.71 30.13⫾ 11.16 0.2331 39.69⫾ 18.61 32.57⫾ 11.41 0.1791 TRAb (%) 1.61⫾ 0.59 1.83⫾ 0.81 0.5736 1.92⫾ 0.84 1.75⫾ 0.76 0.5928 1.81⫾ 0.76 1.78⫾ 0.76 0.8868 TTR (mg/dL) 12.42⫾ 2.87 12.42⫾ 3.14 0.9978 10.81⫾ 2.67 13.87⫾ 3.04 0.0045‡ 11.50⫾ 2.82 13.24⫾ 3.12 0.0298‡ E2(ng/dL) 7.64⫾ 1.60 8.44⫾ 1.75 0.3539 8.48⫾ 1.10 9.09⫾ 2.31 0.3684 8.19⫾ 1.32 8.83⫾ 2.09 0.2132 Testosterone (ng/dL) 3.81⫾ 1.52 3.42⫾ 1.74 0.6224 3.62⫾ 1.61 3.31⫾ 1.24 0.5618 3.70⫾ 1.54 3.35⫾ 1.43 0.4371 IGF-1 (ng/mL) 94.73⫾ 34.70 131.73 ⫾ 39.55 0.0596 133.69⫾ 80.20 168.89 ⫾ 69.39 0.2515 118.11⫾ 67.46 153.69 ⫾ 60.80 0.0797 IGFBP-3 (ng/mL) 2.80⫾ 0.54 3.18⫾ 0.64 0.1921 3.79⫾ 2.49 3.40⫾ 0.68 0.5842 3.41⫾ 2.02 3.31⫾ 0.66 0.8230
* Variables including thyroid and sex hormone, and growth factor concentrations were presented as the mean⫾ SD. † Low and high levels for PCDD/Fs levels were categorized as⬍15, and ⱖ15 pg-TEQ/g lipid.
‡ p⬍ 0.05 indicates statistically significant difference between the high and low exposure levels for a given gender or overall.
with high PCDD/Fs exposure level than the group with low level exposure (p ⫽ 0.0002 for FT4⫻ TSH at year 2; p ⫽ 0.0243 for IGF-1 at year 5). In males, FT4⫻ TSH at year 2 and IGF-1 at year 5 were still significantly higher in the group with high PCDD/Fs exposure level than the group with low exposure level (p⫽ 0.0072 for FT4⫻ TSH at year 2, and p ⫽ 0.0228 for IGF-1 at year 5). In females, TTR was still significantly higher in the high PCDD/Fs exposure level than the low level at year 2; FT4 ⫻ TSH (instead of T3) was significantly higher in the high PCDD/Fs exposure level. There was no significant difference in hormone levels at year 5 (data not shown).
Table 5 shows the results of the stepwise multiple linear regression analysis of selection of thyroid hormone concen-trations at first follow-up (year 2) with respect to PCDD/Fs exposure level, considering mother’s age, parity at first fol-low-up, and the quadratic form of PCDD/Fs. There were significantly positive correlations among T3, TSH, FT4 ⫻ TSH, and TTR concentrations and the level of PCDD/Fs exposure. Both TSH and FT4 ⫻ TSH concentrations were significantly negatively correlated with maternal age. There was also a negative correlation between T3 levels and the
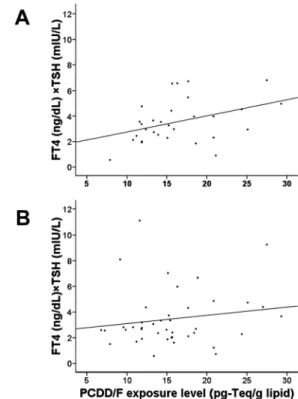
quadratic form of PCDD/Fs. The significant relation between FT4⫻ TSHlevels and PCDD/Fs exposure level at year 2 was further demonstrated by multiple linear model (Fig. 1).
DISCUSSION
PCDD/Fs are transferred from mother to the fetus through the placenta and to infants via breast milk (10 –12). Therefore, maternal exposure to these endocrine disruptors may ad-versely impact fetal/infant development and functioning. In this study, we performed follow-up examinations of infants/ children previously demonstrated to be exposed in utero to
Figure 1. PCDD/F exposure level in relation to FT4⫻ TSH level. By simple
linear model: (A) for 2 y preschool data, FT4⫻ TSH ⫽ 1.49 ⫹ 0.12 ⫻
(PCDD/F), R2⫽ 0.1551, p ⫽ 0.0313; (B) for 5-y follow-up, FT
4⫻ TSH ⫽
2.46⫹ 0.06 ⫻ (PCDD/F), R2⫽ 0.0247, p ⫽ 0.3266.
Table 4. Thyroid hormone, sex hormone, and growth factor concentrations with respect to PCDD/F exposure level at year 5
Variables*
Male Female Overall
Low† (⬍15.1) High† (ⱖ15.1) p Low† (⬍15.1) High† (ⱖ15.1) p Low† (⬍15.1) High† (ⱖ15.1) p n 6 8 15 12 21 20 T3(ng/dL) 144.30⫾ 11.74 151.88 ⫾ 18.03 0.3897 135.50 ⫾ 15.67 146.36 ⫾ 15.80 0.0868 138.01 ⫾ 14.93 148.57 ⫾ 16.49 0.0379‡ T4(g/dL) 7.98⫾ 2.21 8.78⫾ 2.01 0.4975 8.29⫾ 2.02 8.33⫾ 1.95 0.9641 8.20⫾ 2.02 8.51⫾ 1.94 0.6275 TSH (mIU/L) 2.60⫾ 1.34 2.99⫾ 0.95 0.5327 2.73⫾ 1.72 2.86⫾ 2.22 0.8700 2.69⫾ 1.59 2.91⫾ 1.78 0.6843 T3uptake (%) 26.72⫾ 2.21 26.84⫾ 2.34 0.9237 27.13⫾ 3.37 26.09⫾ 2.50 0.3824 27.01⫾ 3.04 26.39⫾ 2.40 0.4722 FT4(ng/dL) 1.29⫾ 0.25 1.33⫾ 0.22 0.7665 1.24⫾ 0.28 1.11⫾ 0.14 0.1166 1.26⫾ 0.27 1.20⫾ 0.21 0.4172 FT4⫻ TSH 3.47⫾ 2.32 4.12⫾ 1.76 0.5643 3.38⫾ 2.58 3.13⫾ 2.24 0.7875 3.41⫾ 2.45 3.52⫾ 2.07 0.8735 Tg (ng/dL) 20.88⫾ 7.62 24.41⫾ 3.58 0.3129 24.32⫾ 5.37 25.66⫾ 4.19 0.5536 23.51⫾ 5.90 25.08⫾ 3.83 0.3852 E2(ng/dL) 6.74⫾ 2.32 6.47⫾ 1.72 0.8085 7.51⫾ 2.30 5.93⫾ 1.62 0.0563 7.29⫾ 2.28 6.15⫾ 1.64 0.0748 Testosterone (ng/dL) 6.60⫾ 1.81 6.27⫾ 1.53 0.7158 6.58⫾ 1.59 6.72⫾ 1.81 0.8319 6.59⫾ 1.61 6.54⫾ 1.68 0.9281 IGF-1 (ng/mL) 161.22⫾ 57.79 263.85 ⫾ 60.43 0.0076‡ 252.96 ⫾ 122.61 334.28 ⫾ 114.97 0.0907 226.75 ⫾ 114.73 306.11 ⫾ 101.25 0.0243‡ IGFBP-3 (ng/mL) 4.79⫾ 1.38 5.38⫾ 0.98 0.3678 5.06⫾ 0.98 5.46⫾ 1.17 0.3412 4.98⫾ 1.08 5.43⫾ 1.07 0.1928
* Variables including thyroid and sex hormone, and growth factor concentrations were presented as the mean⫾ SD. † Low and high levels for PCDD/Fs levels were categorized as⬍15 and ⱖ15 pg-TEQ/g lipid.
‡ p⬍ 0.05 indicated a statistically significant difference between the high and low exposure levels for a given gender or overall. Table 5. Stepwise multiple linear regression models for selection
in thyroid hormone concentrations with respect to PCDD/F exposure level at year 2
Model* Estimate⫾ SE p-Value
T3, R 2⫽ 0.3698 PCDD/F 12.59⫾ 4.75 0.0133‡ (PCDD/F)2 ⫺0.32 ⫾ 0.13 0.0201‡ TSH†, R2⫽ 0.2221 Maternal age ⫺0.05 ⫾ 0.07 0.0238‡ PCDD/F 0.05⫾ 0.02 0.0188‡ FT4⫻ TSH†, R 2⫽ 0.2880 Maternal age ⫺0.07 ⫾ 0.03 0.0195‡ PCDD/F 0.06⫾ 0.02 0.0089‡ TTR, R2⫽ 0.0619 PCDD/F 0.12⫾ 0.08 0.1720 * Model as performed adjusting infants’ gender.
† TSH and FT4⫻ TSH were log transformed to meet regression assumptions.
‡ p⬍ 0.05 indicates a statistically significant relationship.
T5
varying levels of PCDD/F (13). Our findings indicate that children with higher levels of exposure to these environmental contaminants in utero were significantly taller and heavier and had higher serum level of several thyroid hormones (T3, FT4 ⫻ TSH, and TTR) and growth hormone (IGF-1) at the pre-school ages. Whether there is a cause-effect relationship be-tween growth and hormone remains to be studied.
Females seem to be more sensitive than males to PCDD/Fs exposure. Females exposed to PCDD/Fs in utero were signif-icantly taller and heavier and had higher BA/CA ratio than male at both follow-up visits. We also noted the intriguing finding of significantly higher T3 and IGF-1 levels in females than males at year 2. IGF-1 remained higher at year 5 visit. Females exposed to high levels of PCDD/Fs were significantly taller and heavier and had higher BA and CA those with low exposure at year 2 follow-up visits. Similarly, we observed a significant correlation between exposure level of PCDD/Fs and thyroid hormones (T3, TTR) in females at the year 2 follow-up visit. There was no significant correlation between PCDD/Fs exposure level and growth or hormone level in girls at the year 5 follow-up, suggesting that fetal exposure to PCDD/Fs can stimulate growth at early ages but it may become less apparent with increasing age. For males, expo-sure level did not significantly affect growth, but level of PCDD/Fs exposure in utero had a significant correlation with FT4⫻ TSH at both year 2 and year 5.
Correlation between PCDD/Fs exposure level in utero and hormone level during preschool ages was further confirmed using a stepwise multiple linear regression analysis. The results suggested that there were significantly positive corre-lations between T3, TSH, FT4⫻ TSH, and TTR concentra-tions and the level of PCDD/Fs exposure at year 2 follow-up. The finding of higher FT4⫻ TSH values in the high exposure group suggested that T4feedback inhibition of TSH secretion was impaired in both males and females exposed to high levels of PCDD/Fs.
A number of previous studies have noted altered thyroid functioning in dioxin/PCB exposed infants. The major finding of this study was the demonstration of significant positive correlations between T3, TSH, FT4⫻ TSH, and TTR concen-trations and the level of PCDD/Fs exposure at year 2 follow-up. Pluim et al. (9,17) also reported that term infants exposed to upper-median dioxin levels (as measured in breast milk) had increased plasma T4and TBG concentrations. Sauer et al. (18) investigated the growth and development of infants in highly industrialized western countries; they found a higher TSH at higher levels of dioxin exposure.
We have noted in a previous publication that FT4⫻ TSH decreased with increasing concentrations of non-ortho PCB exposure levels in infants, indicating a lack of effective FT4 feedback to stimulate the hypothalamus (13). It suggested that dioxin/PCB levels in utero may have differential effect in neonates and children 2–3 y of age. The reason for the difference between two developmental stages is unclear and warrants further investigation. Interestingly, there was no significant correlation between PCDD/Fs exposure level and hormone level at year 5 visit after stepwise multiple linear regression analysis. Mazhitova et al. (14) found that none of
the schoolchildren (aged 7.5–15 y), whose serum level of PCBs was two to four times higher than healthy Stockholm children, had any impairment of thyroid function, as revealed by the plasma levels of TSH and thyroxine; there was no relation between thyroid hormone status and the blood lipid levels of PCBs, hexachlorocyclohexane, and DDT. Findings from our previous study suggest that there is a negative correlation between thyroid hormone levels and maternal age (13). In accordance with that study, we also observed a significant negative correlation between TSH and FT4⫻ TSH concentrations and maternal age, suggesting that children born to older mothers tend to have lower levels of thyroid hormone. It is apparent that further studies are needed to explore in more detail how changes in IGF-1, T3, TTR, and FT4 ⫻ TSH correlate with growth and development in infants/children following in utero exposure to PCDD/Fs. Exposure level did not affect E2and testosterone at the early stage of life. In the future, we plan to closely follow this cohort of children and investigate possible differences in the levels of hormones involved in regulating sexual development (i.e. E2and testos-terone) with respect to exposure level.
The same cohort of children will be continuously followed up though school age and puberty. It will be particularly interesting to know if material exposure level and blood levels of PCDD/Fs have any effect on hormone status and develop-ment during puberty.
In conclusion, the results of this first complete follow-up study of preschool children exposed to PCDD/Fs in utero indicate that such exposure can significantly affect growth and development. Serum levels of several thyroid hormones showed positive correlation with the level of PCDD/Fs expo-sure in utero. Age-related changes were also observed. A number of gender-specific differences were detected with regard to growth, basal hormone concentrations, and PCDD/Fs exposure level. These findings emphasize that in
utero exposure to PCDD/Fs can affect the growth and
devel-opment of preschool age children.
Acknowledgments. We thank Ms Hsiao-Yen Chen for
spec-imen collections.
REFERENCES
1. Liem AK, Furst P, Rappe C 2000 Exposure of populations to dioxins and related compounds. Food Addit Contam 17:241–259
2. Yamashita F, Hayashi M 1985 Fetal PCB syndrome: clinical features, intrauterine growth retardation and possible alteration in calcium metabolism. Environ Health Perspect 59:41– 45
3. Rylander L, Stromberg U, Dyremark E, Ostman C, Nilsson-Ehle P, Hagmar L 1998 Polychlorinated biphenyls in blood plasma among Swedish female fish consumers in relation to low birth weight. Am J Epidemiol 147:493–502
4. Buck GM, Sever LE, Mendola P, Zielezny M, Vena JE 1997 Consumption of contaminated sport fish from Lake Ontario and time-to-pregnancy. New York State Angler Cohort. Am J Epidemiol 146:949 –954
5. Guo YL, Hsu PC, Hsu CC, Lambert GH 2000 Semen quality after prenatal exposure to polychlorinated biphenyls and dibenzofurans. Lancet 356:1240 –1241 6. Schecter A, Olson JR 1997 Cancer risk assessment using blood dioxin levels and
daily dietary TEQ intake in general populations of industrial and non-industrial countries. Chemosphere 34:1569 –1577
7. Demers A, Ayotte P, Brisson J, Dodin S, Robert J, Dewailly E 2002 Plasma concentrations of polychlorinated biphenyls and the risk of breast cancer: a conge-ner-specific analysis. Am J Epidemiol 155:629 – 635
8. Jacobson JL, Jacobson SW 2001 Developmental effects of PCBs in the fish eater cohort studies. In: Robertson LW, Hansen LG (eds) PCBs: Recent Advances in Environmental Toxicology and Health Effects. The University Press of Kentucky, Lexington, pp 127–128
9. Pluim HJ, De Vijlder JJ, Olie K, Kok JH, Vulsma T, van Tijn DA, van der Slikke JW, Koppe JG 1993 Effects of pre- and postnatal exposure to chlorinated dioxins and furans on human neonatal thyroid hormone concentrations. Environ Health Perspect 101:504 –508
10. Wang SL, Lin CY, Guo YL, Lin LY, Chou WL, Chang LW 2004 Infant exposure to polychlorinated dibenzo-p-dioxins, dibenzofurans and biphenyls (PCDD/Fs, PCBs)– correlation between prenatal and postnatal exposure. Chemosphere 54:1459 –1473
11. Chao HR, Wang SL, Lee CC, Yu HY, Lu YK, Papke O 2004 Level of polychlori-nated dibenzo-p-dioxins, dibenzofurans and biphenyls (PCDD/Fs, PCBs) in human milk and the input to infant body burden. Food Chem Toxicol 42:1299 –1308 12. Ma HW, Lai YL, Chan CC 2002 Transfer of dioxin risk between nine major
municipal waste incinerators in Taiwan. Environ Int 28:103–110
13. Wang SL, Su PH, Jong SB, Guo YL, Chou WL, Pa¨pke O 2005 In utero exposure to dioxins and polychlorinated biphenyls and its relations to thyroid function and growth hormone in newborns. Environ Health Perspect 113:1645–1650
14. Mazhitova Z, Jensen S, Ritze´n M, Zetterstro¨m R 1998 Chlorinated contaminants, growth and thyroid function in schoolchildren from the Aral Sea region in Kazakh-stan. Acta Paediatr 87:991–995
15. 2000 World Medical Association Declaration of Helsinki: ethical principles for medical research involving human subjects. JAMA 284:3043–3045
16. Tanner JM, Whitehouse RH, Marshall WA, Healy MJ, Goldstein H 1975 Assess-ment of Skeletal Maturity and Prediction of Adult Height (TW2 Method). New York Academic Press, New York
17. Pluim HJ, Koppe JG, Olie K, Vd Slikke JW, Kok JH, Vulsma T, Van Tijn D, De Vijlder JJ 1992 Effects of dioxins on thyroid function in newborn babies. Lancet 339:1303
18. Sauer PJ, Huisman M, Koopman-Esseboom C, Morse DC, Smits-van Prooije AE, van de Berg KJ, Tuinstra LG, van der Paauw CG, Boersma ER, Weisglas-Kuperus N, Lammers JH, Kulig BM, Brouwer A 1994 Effects of polychlorinated biphenyls (PCBs) and dioxins on growth and development. Hum Exp Toxicol 13:900 –906