Open Access
Research article
Use frequency of traditional Chinese medicine in Taiwan
Fang-Pey Chen
1,2, Tzeng-Ji Chen
2,3, Yen-Ying Kung
1,2, Yu-Chun Chen
2,3,
Li-Fang Chou
4, Fan-Jou Chen
5and Shinn-Jang Hwang*
2,3,1Address: 1Center for Traditional Medicine, Taipei Veterans General Hospital, No.201, Section 2, Shih-Pai Road, Taipei 112 Taiwan, 2National
Yang-Ming University School of Medicine, No.155, Section 2, Linong Street, Peitou District, Taipei 112, Taiwan, 3Department of Family Medicine, Taipei
Veterans General Hospital, No.201, Section 2, Shih-Pai Road, Taipei 112 Taiwan, 4Department of Public Finance, National ChengChi University,
No. 64, Section 2, Zhinan Road, Wenshan District, Taipei 116 Taiwan and 5Graduate Institute of Integration Chinese and Western Medicine,
Chinese Medical University, No. 91, Hsueh-Shih Road, Taichung 404 Taiwan
Email: Fang-Pey Chen - [email protected]; Tzeng-Ji Chen - [email protected]; Yen-Ying Kung - [email protected]; Yu-Chun Chen - [email protected]; Li-Fang Chou - [email protected]; Fan-Jou Chen - [email protected]; Shinn-Jang Hwang* - [email protected]
* Corresponding author
Abstract
Background: Use of Traditional Chinese medicine (TCM), an important category of complementary and alternative
medicine (CAM), has increased substantially in Western countries during the past decade. Use of TCM is also widespread in the Chinese population. However, few informative data have been obtained to date by large-scale investigations of TCM use in the Chinese population. This study was aimed at elucidating the demographics and patterns of TCM use in Taiwan.
Methods: We employed the complete datasets of TCM outpatient reimbursement claims from 1996 to 2001, including
the use of Chinese herbal remedies, acupuncture and traumatology manipulative therapy, to analyse use frequencies, the characteristics of TCM users, and the disease categories that were treated by TCM in Taiwan.
Results: At the end of 2001, 6,142,829 (28.4%) among the 21,653,555 valid beneficiaries of the National Health Insurance
in Taiwan had used TCM during the year. However, 13,536,266 subjects (62.5%) had used TCM at least once during the whole 6-year period from 1996 to 2001, with a total of 156,224,266 visits (mean 11.5 visits per user). The mean number of TCM users per annum was 5,733,602, with a mean increment of 1,671,476 (29.2%) of new users yearly. Among TCM users, female was higher than male (female:male = 1.13:1), and the age distribution displayed a peak at around the 30s, followed by the 20s and 40s. Chinese herbal remedies (85.9%) were the most common TCM modality used by this population, followed by acupuncture (11.0%) and traumatology manipulative therapies (3.1%). Private TCM clinics provided most of the TCM care (82.6%), followed by private TCM hospitals (12.0%). The top ten major disease categories for TCM visits were diseases of the respiratory system, musculoskeletal system and connective tissue; symptoms, signs and ill-defined conditions; injury and poisoning; diseases of the digestive system, genitourinary system, skin and subcutaneous tissue, nervous system and sense organs, circulatory and endocrine system; nutritional and metabolic diseases; and immunological disorders.
Conclusion: TCM was popular among the Chinese population in Taiwan during the period studied. More than 60% of
all subjects had used TCM during the 6-year interval. TCM was widely used by the Chinese population to treat problems and diseases of major human organ systems recognised by western medicine. This study provides information about the use frequencies of TCM and the disease categories treated by TCM, which should be useful for health policy makers and for those considering the integration of TCM and Western medicine.
Published: 23 February 2007
BMC Health Services Research 2007, 7:26 doi:10.1186/1472-6963-7-26
Received: 4 August 2006 Accepted: 23 February 2007 This article is available from: http://www.biomedcentral.com/1472-6963/7/26
© 2007 Chen et al; licensee BioMed Central Ltd.
This is an Open Access article distributed under the terms of the Creative Commons Attribution License (http://creativecommons.org/licenses/by/2.0), which permits unrestricted use, distribution, and reproduction in any medium, provided the original work is properly cited.
Background
Interest in complementary and alternative medicine (CAM) has increased substantially in western countries during the past decade [1-4]. Patients and their families seem to have sought their health practitioners' opinions about various CAM modalities more frequently [1,2]. Recent studies have demonstrated dramatic increases in the use of, and expenditure on, CAM in the United States, Canada, Australia and European countries [5-8]. How-ever, most of the prevalent studies of CAM use were based primarily on questionnaire surveys, telephone interviews or collecting data from insurance claims, and the sample sizes generally were limited.
Traditional Chinese medicine (TCM) is an important cat-egory of CAM in Western opinion [9]. Current TCM prac-tices can be traced back more than 2000 years. The concepts of Ying-Yang, Five Elements, Meridians, and the use of many herbal remedies, originated from ancient China [10,11]. TCM is still commonly used by the Chi-nese [4,12,13]. In Taiwan, not until the 1980s did several researchers start to research issues relevant to TCM, using sampling surveys or studies with small sample sizes [14-20]. To date, there has been no large-scale investigation of the use of TCM among Chinese people worldwide. In Taiwan, the National Health Insurance (NHI) program was started in 1995 and covers nearly all inhabitants (21,653,555 beneficiaries at the end of 2001) [21-23]. The use of TCM has been reimbursed by the NHI since 1996. People in Taiwan are free to choose Western medicine or TCM, and are allowed to visit either public or private med-ical facilities. Because all claims data are available to researches in electronic form, we could conduct a study of TCM use among the Chinese population in Taiwan. The aim of this study was to conduct a nation-wide survey in order to establish the frequency of TCM use, the char-acteristics of TCM users, and the medical conditions for which Taiwanese people most commonly use TCM, by analyzing the NHI claims data from 1996 to 2001. TCM provided by the NHI included Chinese herbal remedies, acupuncture and traumatology manipulative therapy [24].
Methods
Data Sources
The NHI program was initiated in Taiwan since 1995 and covers nearly all inhabitants (21,653,555 beneficiaries at the end of 2001, equivalent to a coverage rate of 96.6%). In 1999, the Bureau of NHI began to release all claims data in electronic form to the public under the National Health Insurance Research Database (NHIRD) project. The structure of the claim files is described in detail on the NHIRD website and in other publications [19,25].
We obtained the complete TCM claim datasets (CM_CD199601.DAT to CM_CD200112.DAT, 72 files) from the NHIRD in Taipei in November 2002. The data-sets contained only the visit files, including dates, medical care facilities and specialties, patients' genders, dates of birth, and the three major diagnoses coded in the Interna-tional Classification of Disease, 9th Revision, Clinical
Modification (ICD-9-CM) format [26-28]. To protect pri-vacy, the data on patient identities and institutions had been scrambled cryptographically.
These visit files represented all the TCM outpatient activi-ties within the NHI from 1996 to 2001. Insurance benefits were available for TCM that included Chinese herbal rem-edies, acupuncture and traumatology manipulative ther-apy, especially for joint dislocation. In Taiwan, TCM is reimbursed by NHI only in ambulatory clinics, not for inpatient care. In addition, only licensed TCM physicians qualify for reimbursement from the NHI. At the end of 2001, there were 2 public TCM hospitals, 42 private TCM hospitals and 2,544 private TCM clinics providing TCM ambulatory visits [22].
To calculate the numbers of valid beneficiaries in the study period, the beneficiaries' registry files (ID2002_1.DAT to ID2002_8.DAT) were also obtained.
Study Design
Although the concept of disease entities in TCM is quite different from that in Western medicine, TCM physicians are requested to follow the standard diagnoses according to the ICD-9-CM coding system when claiming reim-bursement. Common diagnostic groups for TCM visits were categorized according to the reclassification of pri-mary ICD-9-CM codes for use in the National Ambulatory Medical Care Survey and National Hospital Ambulatory Medical Care Survey data in the United States [29]. To calculate patients' ages in relation to the 6-year use fre-quency of TCM from 1996 to 2001, December 31, 2001 was taken as the index of subtrahend. The denominator was the number of people who were insured during this 6-year period.
In order to compare the average numbers of visits between TCM and Western (allopathic) medicine, we also obtained the total number of ambulatory visits to Western medicine from the website of Department of Health, Tai-wan [22]. In addition, we obtained the sampling claim datasets for ambulatory care visits at Western medicine clinics (S_CD 1996 to S_CD2001) in order to compare the top ten disease categories between TCM and Western medicine visits. The Western medicine files to be sampled were extracted from the complete outpatient claims (excluding dental and TCM services), using a sampling
ratio of 0.2%. The sampling was random and visit-based but was separated monthly to eliminate possible seasonal variations. According to the NHIRD, these sampled files were representative of all utilisation within the NHI in Taiwan.
Statistical Analysis
Microsoft SQL Server 2000 (MicroSoft Corp., Redmond, WA USA) was the main software used for data linkage and processing. Descriptive data, including frequencies, per-centage and means, are presented.
Results
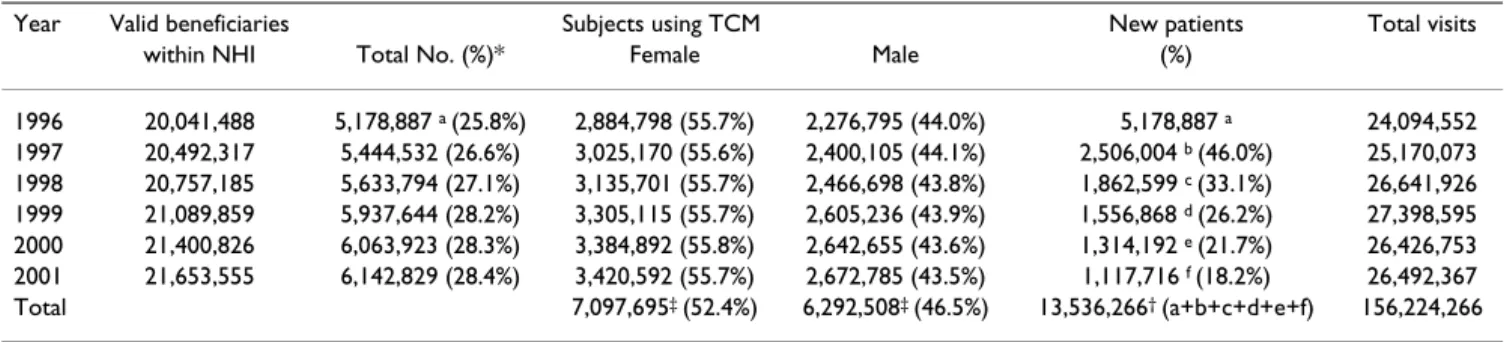
Among the 21,653,555 valid beneficiaries of the NHI pro-gram at the end of 2001, 16,142,829 (28.4%) had used TCM during the year, but 13,536,266 (62.5%) had used TCM at least once during the whole 6-year period from 1996 to 2001, with a total of 156,224,266 visits (mean 11.5 visits per user). The annual number and percentage of TCM users steadily increased from 1996 to 2001 (Table 1). However, the annual number of TCM visits remained stationary from 1998 to 2001. There was a mean of 5,733,602 annual TCM users (ranging from 25.8% of the valid beneficiaries within NHI in 1996 to 28.4% in 2001) with a mean increment of 1,671,476 (29.2%) of new users yearly. Among TCM users, female was higher than male with a female:male ratio of 1.13:1. The age distribu-tion of the TCM users peaked in the 30s, followed by the 20s and 40s (Table 2), while the age distribution for visit counts showed a peak in the 30s followed by the 40s and 20s. Adjusted for the total population in each 10-year age group, the use frequency of TCM still showed a peak in the 30s, followed by the 20s and 60s. When the details of each age group were investigated, it was found that more than 50% of patients used TCM if they were over 10 years old. Among the 13,536,266 subjects who experienced TCM during the 6-year period, 4,832,233 (35.7%) used TCM only in one year, 3,065,072 (22.6%) in two separate years, 2,106,523 (15.6%) in three separate years, 1,495,694 (11.0%) in 4 separate years, 1,083,577 (8.0%) in 5 sepa-rate years and 953,167 (7.0%) in all six years. As to the visit counts during this 6-year period, 19.4% of subjects used TCM only once, 47.8% used it more than 6 times (once per year on average) and 2.3% used it more than 72 times (once per month on average) (Figure 1).
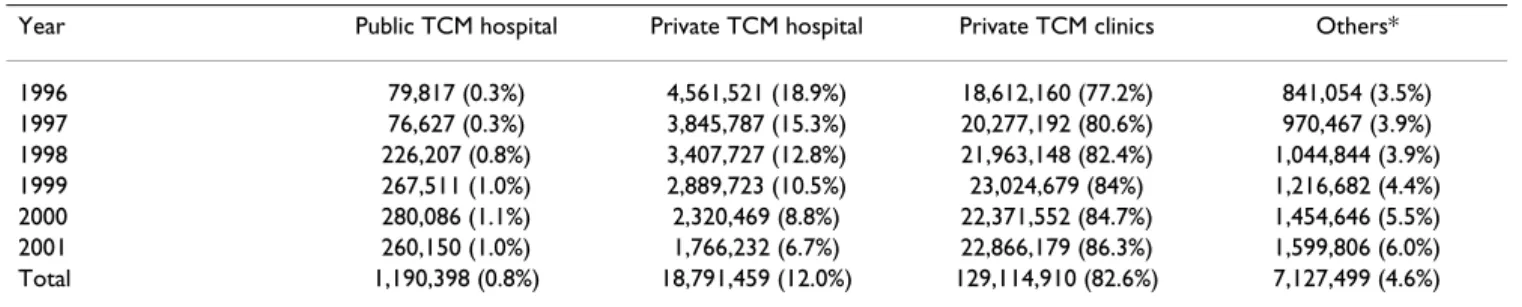
Chinese herbal remedies (85.9%) were the most common TCM modality, followed by acupuncture (11.0%) and traumatology manipulative therapies (3.1%). Most of the TCM visits identified in the study were performed in pri-vate TCM clinics (82.6%), followed by pripri-vate TCM hos-pitals (10.7%), others (4.7%, mostly Western medicine hospitals with TCM sections) and public TCM hospitals (0.7%). Visits to private TCM hospitals decreased yearly,
while visits to private TCM clinics, public TCM hospitals and others increased (Table 3).
Among the 156,224,266 TCM visits, 150,365,543 (96.2%) had one clinical diagnosis, 4,955,213 (3.2%) had two diagnoses and 881,438 (0.6%) had three diag-noses according to the ICD-9-CM coding system. The top ten diseases for TCM visits were diseases of respiratory sys-tem; diseases of the musculoskeletal system and connec-tive tissue; symptoms, signs and ill-defined conditions; injury and poisoning; diseases of the digestive system, the genitourinary system, the skin and subcutaneous tissue, the nervous system and sense organs, the circulatory and endocrine system; nutritional and metabolic diseases; and immunological disorders (Table 4). Common problems and diseases of major human organ systems recognised in Western medicine were all ranked in the top 41 diagnostic groups for TCM visits (Table 5). They included three dis-ease groups relating only to females: disorders of menstra-tion and abnormal bleeding (ICD code: 626.4), noninflammatory disorders of female genital organs (ICD code: 625.5) and inflammatory disorders of female pelvic organs (ICD code 614.9). Thus, people with diseases com-monly seen in Western medicine used TCM.
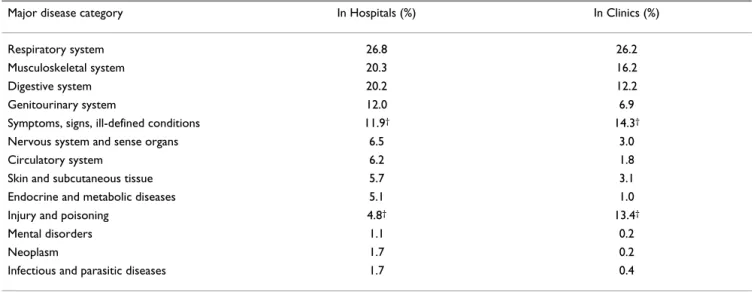
Furthermore, we analyzed the percentage distribution of major disease categories for TCM visits by age (Table 6). The results show that for respiratory system diseases and injuries, the percentages of visits were higher in the younger groups and decreased with age. In contrast, for the categories of symptoms, signs and ill-defined condi-tions, musculoskeletal system, nervous system, circulatory system, endocrine and metabolic diseases, mental disor-ders and neoplasms, the percentages of visits were lower in the younger groups and increased with age. We found no significant differences between males and females in the percentage distributions of the commonest disease categories for TCM visits (Table 7). However, female sub-jects visited TCM for diseases of the genitourinary system (10.6%) more frequently than males (2.2%). We also compared the percentage distribution of major disease categories for TCM visits among different locations and the results revealed that the categories of injury, poisoning and symptoms, signs and ill-defined conditions were more commonly seen in clinics than in hospitals (Table 8).
Discussion
To the best of our knowledge, this study is the first exten-sive survey of TCM use in Chinese society. Only with the aid of a computerised insurance reimbursement database could such a large-scale TCM utilization study feasibly be analysed. Previous studies from western countries on the frequency and characteristics of CAM/TCM use have mainly consisted of surveys of clinic attendees, telephone
interviews, written surveys, household interviews, and hospital and private clinic surveys; and the sample sizes have been limited. In addition, the use of CAM/TCM in western countries is usually not covered by insurance [30]. Thus, the survey results might be affected by the socio-eco-nomic status of the subjects [31]. Fortunately, TCM is reimbursed by NHI in Taiwan, so our study would appear to be less biased.
The use of CAM/TCM in western countries has increased dramatically in recent decades [1,5-8], [32-34]. It goes without saying that TCM has been commonly used in Asian countries, especially in the Chinese population, for centuries [17-19,35-37]. Owing to the different defini-tions of CAM, the types of CAM surveyed, survey method-ologies and types of CAM reimbursed by insurance, it is difficult to compare the use frequency of CAM/TCM among countries [38,39]. According to our results, there was a steady increase in the annual number of TCM users in Taiwan between 1996 and 2001, and 62.5% of people used TCM covered by the NHI during this period; this does not include folk medicine, which is not reimbursable by insurance. The widespread use of TCM in the Chinese population might not be surprising since TCM has been developed in China for more than 2000 years and the
ancestors of most Taiwanese were immigrants from China from the 17th century onwards. Many concepts of TCM,
such as the balance of Qi-blood, the regulation of body constitution and the mixture of herbs and food, have been part of Chinese culture and life style. Other ancient cul-tures in the world have similar experiences with their tra-ditional medicine [40-42]. In addition, Chinese people believe that Western medicine may react faster to the tar-get but also causes more adverse side effects, while TCM reacts slowly but is subtle and safe [16,43,44]. Further-more, the insurance coverage for TCM visits might also play a significant role [31]. Lee et al. reported that TCM outpatient use rate increased 1.75-fold from 1983 to 1988 because of the opening of labour insurance coverage in Taiwan [14]. These factors might all account for the high utilization of TCM.
It is interesting to know how health care was used when both Western medicine and TCM were available in Tai-wan. Table 9 compares the use frequencies of outpatient visits between TCM and Western medicine. The results show that people visited Western medicine clinics more commonly than TCM clinics for their illnesses. Thus, Western medicine remains the mainstream of health care. TCM outpatient visits accounted for around 9% of all
out-Table 1: Patient use and visit counts of traditional Chinese medicine (TCM) within National Health Insurance (NHI) from 1996 to 2001 in Taiwan
Year Valid beneficiaries Subjects using TCM New patients Total visits within NHI Total No. (%)* Female Male (%)
1996 20,041,488 5,178,887 a (25.8%) 2,884,798 (55.7%) 2,276,795 (44.0%) 5,178,887 a 24,094,552 1997 20,492,317 5,444,532 (26.6%) 3,025,170 (55.6%) 2,400,105 (44.1%) 2,506,004 b (46.0%) 25,170,073 1998 20,757,185 5,633,794 (27.1%) 3,135,701 (55.7%) 2,466,698 (43.8%) 1,862,599 c (33.1%) 26,641,926 1999 21,089,859 5,937,644 (28.2%) 3,305,115 (55.7%) 2,605,236 (43.9%) 1,556,868 d (26.2%) 27,398,595 2000 21,400,826 6,063,923 (28.3%) 3,384,892 (55.8%) 2,642,655 (43.6%) 1,314,192 e (21.7%) 26,426,753 2001 21,653,555 6,142,829 (28.4%) 3,420,592 (55.7%) 2,672,785 (43.5%) 1,117,716 f (18.2%) 26,492,367 Total 7,097,695‡ (52.4%) 6,292,508‡ (46.5%) 13,536,266† (a+b+c+d+e+f) 156,224,266
* Number within parenthesis indicates percentage of subjects using TCM among valid beneficiaries within NHI in that year; †146,063 people whose
genders were not recorded; ‡Female:male = 1.13:1. New patients indicate people who used NHI-covered TCM for the first time.
Table 2: Age-specific usage frequency of traditional Chinese medicine (TCM) during the 6-year period from 1996 to 2001 in Taiwan
Age (years) Number of total population* Number of subjects using TCM (%) Number of TCM visits
≤10 3,045,723 376,098 (12.3%) 3,585,106 11–20 3,384,508 2,087,947 (61.7%) 18,557,467 21–30 3,821,115 2,507,902 (65.6%) 22,970,206 31–40 3,802,330 2,509,366 (66.0%) 30,974,575 41–50 3,538,240 2,195,505 (62.1%) 29,908,451 51–60 2,051,260 1,209,673 (59.0%) 16,445,165 61–70 1,445,062 935,722 (64.8%) 13,234,416 71–80 989,984 580,621 (58.6%) 8,389,902 ≥81 327,346 171,239 (52.3%) 2,084,788
patient clinics. Notably, the average number of outpatient visits per person per year in both TCM and Western med-icine increased from 1996 to 1999, but decreased in 2000 owing to the rise in co-payments for outpatient visit under the NHI, Taiwan from August 1999 [22].
Our finding that female use TCM more frequently than male, is consistent with previous reports from western
countries [31,32,45,46]. Nevertheless, the reasons for this female predominance were not fully elucidated in previ-ous reports. It was suggested that independent females, or females of good social status, had higher expectations of or belief in TCM in respect of postpartum conditions, menopause and chronic diseases [29-31], [47-49]. Our results show that disorders of menstruation and abnormal bleeding, noninflammatory disorders of female genital
Visits counts per patient using traditional Chinese medicine during the 6 years from 1996 to 2001 in Taiwan
Figure 1
Visits counts per patient using traditional Chinese medicine during the 6 years from 1996 to 2001 in Taiwan.
1 0 500,000 1,000,000 1,500,000 2,000,000 2,500,000 3,000,000 3,500,000 4,000,000 1 2 3 4 5 6 7-18 19-36 37-72 73-144 >144
Visit counts
Number
of s
ubjects
19.4% 11.9% 8.6% 6.7% 5.4% 4.5% 25.1 % 10.5% 5.4% 1.9% 0.4%Table 3: Service volume of traditional Chinese medicine (TCM) by facility type from 1996 to 2001 in Taiwan
Year Public TCM hospital Private TCM hospital Private TCM clinics Others* 1996 79,817 (0.3%) 4,561,521 (18.9%) 18,612,160 (77.2%) 841,054 (3.5%) 1997 76,627 (0.3%) 3,845,787 (15.3%) 20,277,192 (80.6%) 970,467 (3.9%) 1998 226,207 (0.8%) 3,407,727 (12.8%) 21,963,148 (82.4%) 1,044,844 (3.9%) 1999 267,511 (1.0%) 2,889,723 (10.5%) 23,024,679 (84%) 1,216,682 (4.4%) 2000 280,086 (1.1%) 2,320,469 (8.8%) 22,371,552 (84.7%) 1,454,646 (5.5%) 2001 260,150 (1.0%) 1,766,232 (6.7%) 22,866,179 (86.3%) 1,599,806 (6.0%) Total 1,190,398 (0.8%) 18,791,459 (12.0%) 129,114,910 (82.6%) 7,127,499 (4.6%) *Others: mostly western medicine hospitals with TCM section
organs and inflammatory disorders of female pelvic organs were among the most common 40 disease groups for TCM visits, and this might in part account for the female predominance.
We found that the age distribution of TCM users peaked in the 30s, followed by the 20s and 40s. More than 50% of people over 10 years old had used TCM at least once in the 6 years surveyed. Previous studies have also shown that middle aged females are the characteristic CAM users in western countries [31,38,50,51]. A survey of German university hospitals found that young age was one of the predictors for a positive attitude towards CAM [52]. These results may indicate that adults are more frequent users of TCM/CAM than children [12][19].
Our results revealed that most TCM visits were to private TCM clinics (82.6%), followed by the private TCM hospi-tals (12.0%). This is supported by Chi's report, which showed that most of the active Chinese medicine physi-cians (82%) worked in personal practice clinics and only a small portion (18%) worked in Chinese medicine hos-pitals [53]. Also, in the United States, CAM (acupuncture) is available on a limited basis in major teaching hospitals [54]; and almost 40% of all general practices in Western medicine in the United Kingdom offer some form of access to CAM [38]. Further studies are needed to evaluate the role of TCM in both clinical practice and academic research in teaching hospitals.
According to our results, the most common reasons for TCM visits were diseases of the respiratory, musculoskele-tal, digestive, genitourinary systems, and symptoms, signs and ill-defined conditions. Other common problems and diseases of major human organ systems recognised in Western medicine were all listed in the top 41 diagnostic groups for TCM visits. Our results are consistent with pre-vious reports from western and Asian countries that vari-ous problems or diseases of human organ systems recognised in Western medicine were indicated for CAM use, including problems of the musculoskeletal,
respira-tory and digestive systems, neurological and psychologi-cal disorders, and general complaints [38,39,54-56]. It is also interesting to know for what kind of illnesses people in Taiwan seek help from TCM or Western medicine. Table 10 shows the top ten major disease categories for Western medicine outpatient visits from 1996 to 2001 in Taiwan, using 1:500 sampling from NHI files. The results show that all ten major disease categories were the same in both TCM and Western medicine, but the order from second to tenth was different. According to Linde, most people consult CAM for chronic pain resulting from chronic conditions or musculoskeletal system disorders [57]; and Chen et al. reported that more than 80% of indi-cations for acupuncture visits in Taiwan were for muscu-loskeletal diseases [12]. These findings might explain the difference in the order of disease categories between TCM and Western medicine.
From the percentage distribution of diagnoses by age in our study, we found that for patients over the age of 20, conditions of major organ systems such as the muscu-loskeletal, nervous, circulatory and endocrine systems, as well as mental disorders, appeared more and more fre-quently in TCM visits, which might be a consequence of the aging process and the natural course of diseases. Evi-dently, respiratory conditions accounted for almost half of TCM visits in young people (aged under 20). Whether TCM has better efficacy and fewer side effects than West-ern medicine in treating conditions such as upper airway infection, asthma or allergy rhinitis deserves further eval-uation [58,59]. We also found that TCM practitioners in clinics treated more injury conditions and symptoms, signs and ill-defined conditions than those in hospitals, while TCM practitioners in hospitals treated internal organ problems more than those in clinics [12]. Since the NHI program in Taiwan only covers outpatients, TCM practitioners in Chinese medicine sections in both Chi-nese and Western medical hospitals can deal with most ambulatory subjects, as in the clinics. However, in the hospitals, TCM doctors have to be trained strictly in either Chinese or Western medical school, unlike those in
pri-Table 4: The top 10 major disease categories for traditional Chinese medicine visits from 1996 to 2001 in Taiwan
Major disease category ICD-9-CM code Number of visits Percentage (%) Diseases of the respiratory system 460–519 42,163,916 27.0 Diseases of the musculoskeletal system and connective tissue 710–739 25,922,217 16.6 Symptoms, signs and ill-defined conditions 780–799 22,273,597 14.3 Injury and poisoning 800–999 20,466,702 13.1 Diseases of digestive system 520–579 19,854,039 12.7 Diseases of the genitourinary system 580–629 11,269,623 7.2 Diseases of the skin and subcutaneous tissue 680–709 5,086,736 3.3 Diseases of the nervous system and sense organs 320–389 4,999,730 3.2 Diseases of the circulatory system 390–459 3,143,181 2.0 Endocrine, nutritional and metabolic disease and immune disorders 240–279 1,926,628 1.2
vate clinics [53], and may have more diagnostic informa-tion from Western medicine, which may explain the greater number of visits for internal organ system condi-tions. We also found that female subjects visited TCM clinics for diseases of the genitourinary system more fre-quently than males. Our results are consistent with Fox-man's report that women are significantly more likely than men to experience urinary tract infection [60]. In addition, the female use of TCM predominate for the gen-itourinary system was due to the disorders of menstrua-tion and abnormal bleeding, noninflammatory disorders of female genital organs and inflammatory disorders of
female pelvic organs were among the most common 40 disease groups for TCM visits.
In view of the substantially increased use of TCM/CAM, we suggest that medical doctors should ask patients about their use of TCM/CAM when taking a medical history. Exploration of the use of TCM/CAM will enhance the understanding of these practices and help patients and doctors to communicate during medical care. As Eisen-berg and his colleagues suggested a decade ago, medical schools should design the curriculum to include informa-tion about CAM and clinical social sciences [2]. Several
Table 5: The 41 most common diagnostic groups among 156,224,266 traditional Chinese medicine visits from 1996 to 2001 in Taiwan
Diseases diagnosis* Number of visits %
Other symptoms signs and ill-defined conditions 16,707,192 10.7 Other diseases of the digestive system 15,636,624 10.0
Acute sinusitis 13,790,219 8.8
Other diseases of the respiratory system 9,697,442 6.2
Other dorsopathies 9,593,900 6.1
Other injuries 8,265,712 5.3
Derangements and other unspecified joint disorders 6,219,704 4.0
Asthma 5,477,916 3.5
Other superficial injury 5,370,193 3.4
Other acute respiratory infections 4,741,441 3.0 Other rheumatism excluding back 4,702,518 3.0
Chronic sinusitis 4,553,347 2.9
Disorders of menstruation and abnormal bleeding 4,437,200 2.8 Other inflammatory conditions of skin and subcutaneous tissue 3,729,128 2.4 Contusions with intact skin surfaces 3,230,326 2.1 Non-inflammatory disorders of female genital organs 2,704,322 1.7 Ulcer of stomach and small intestine 2,181,074 1.4 Other disorders of the nervous system 2,063,541 1.3 Other disorders of the urinary system 1,786,787 1.1
Cough 1,723,945 1.1
Lumbago 1,524,536 1.0
Other sprains and strains 1,417,778 0.9
Allergic rhinitis 1,266,224 0.8
Other arthropathies and related disorders 1,167,430 0.7 Myalgia and myositis unspecified 1,167,300 0.7
Other mental disorders 1,127,697 0.7
Abnormal heart sounds 1,115,173 0.7
Acute bronchitis and bronchiolitis 1,069,862 0.7
Abdominal pain 1,051,691 0.7
Other diseases of the musculoskeletal system and connective tissue 1,039,678 0.7 Chronic and unspecified bronchitis 998,966 0.6
Gastritis and duodenitis 940,170 0.6
Inflammatory disorders of female pelvic organs 871,451 0.6 Other diseases of the circulatory system 844,021 0.5
Headache 825,747 0.5
Other diseases of the ear and mastoid process 817,140 0.5 Other disorders of the eye and adnexa 758,455 0.5 Other infections and parasitic diseases 746,719 0.5
Diabetes mellitus 740,528 0.5
Other diseases of central nervous system 731,867 0.5 * Only diseases with use frequency of traditional Chinese medicine greater than 0.5% are presented. Diagnostic groups were categorized according to the reclassification of the primary International Classification of Diseases diagnostic codes for use with National Ambulatory Medical Care Survey and National Hospital Ambulatory Medical Care Survey data in the United States.
reports from western countries have concerned the need for CAM instruction to medical trainees and physicians [61,62]. Integration of Western medicine and TCM, in both medical education and clinical practice, should be initiated in countries where TCM and Western medication are widely used [53].
Our study has several limitations. First, NHI only reim-burses Chinese herbal remedies in scientific granular or powder forms. Chinese herbal remedies in traditional herbal form such as Yin-Pian (prepared herbal medicine in small pieces ready for decoction, and medicine materi-als in crude slices) are not reimbursed and therefore are not included in our study. Secondly, our study did not include TCM visits provided by TCM clinics or hospitals that have no NHI contract, where patients need to pay entirely out-of-pocket. Finally, we did not include those Chinese herbal remedies obtained directly from tradi-tional Chinese medicine pharmacies with or without
pre-scriptions from licensed TCM doctors, nor did we include acupuncture performed by western-trained doctors. Thus, the use of TCM might have been underestimated in this study. Finally, without questionnaire surveys of patients, we were unable to ascertain the patients' beliefs, attitudes or inclinations towards TCM.
Conclusion
TCM is popular in the Chinese population. More than 60% of subjects used TCM at least once during the 6-year study period. TCM, like western medicine, was commonly used by the Chinese population for problems and dis-eases of major human organ systems. Chinese herbal rem-edies were the most common TCM modality in Taiwan. This study provides information about the use frequencies of TCM and disease categories treated by TCM, which should be useful for health policy makers and for those who consider the integration of Chinese and Western medicine.
Table 7: Number of visits and percentage distribution of diseases categories for traditional Chinese medicine visits by gender, 1996– 2001, in Taiwan
Major disease category Female Male
Diseases of the respiratory system 22486766 (24.7%) 19229835 (28.6%) Diseases of the musculoskeletal system and connective tissue 14591874 (16.0%) 10960835 (16.3%) Symptoms, signs and ill-defined conditions 13117731 (14.4%) 8962408 (13.4%) Injury and poisoning 10681063 (11.7%) 9549648 (14.2%) Diseases of the digestive system 10358168 (11.4%) 9254229 (13.8%) Diseases of the genitourinary system 9637077 (10.6%) 1470300 (2.2%) Diseases of the skin and subcutaneous tissue 3012960 (3.3%) 2021566 (3.0%) Diseases of the nervous system and sense organs 2987998 (3.3%) 1973514 (2.9%) Diseases of the circulatory system 1609018 (1.8%) 1496484 (2.2%) Endocrine, nutritional and metabolic diseases and immunological disorders 934956 (1.0%) 954273 (1.4%)
Total 91204278 67149765
Table 6: Percentage distribution of diseases categories for 156,224,266 traditional Chinese medicine visits by different age groups, 1996–2001, in Taiwan*
Major disease category Years of age
0–19 20–39 40–59 >60 Symptoms, signs, ill-defined conditions† 13.2 13.2 15.0 16.2
Musculoskeletal system† 5.3 15.5 21.0 25.4
Nervous system and sense organs† 1.1 2.6 4.2 5.6
Circulatory system† 0.2 1.1 2.6 5.6
Endocrine and metabolic diseases† 0.2 0.8 1.8 2.3
Mental disorders† 0.2 0.7 1.0 1.0
Neoplasm† 0.1 0.2 0.4 0.4
Digestive system 9.5 12.9 13.9 13.6
Infectious and parasitic diseases 0.3 0.6 0.5 0.4
Genitourinary system 3.9 10.9 6.7 3.5
Respiratory system‡ 48.3 22.6 20.4 18.6
Skin and subcutaneous tissue 4.0 4.3 2.2 1.7
Injury and poisoning 14.0 15.3 11.9 8.5
Table 8: Percentage distribution of diseases categories for 156,224,266 traditional Chinese medicine visits by location, 1996–2001, in Taiwan*
Major disease category In Hospitals (%) In Clinics (%)
Respiratory system 26.8 26.2
Musculoskeletal system 20.3 16.2
Digestive system 20.2 12.2
Genitourinary system 12.0 6.9
Symptoms, signs, ill-defined conditions 11.9† 14.3†
Nervous system and sense organs 6.5 3.0
Circulatory system 6.2 1.8
Skin and subcutaneous tissue 5.7 3.1
Endocrine and metabolic diseases 5.1 1.0
Injury and poisoning 4.8† 13.4†
Mental disorders 1.1 0.2
Neoplasm 1.7 0.2
Infectious and parasitic diseases 1.7 0.4 *5,836,651 (3.8%) visits had more than one diagnosis. †Percentage in Clinics is higher than in Hospitals.
Table 9: Comparison of the average number of outpatient visits per person per year between Traditional Chinese Medicine (TCM) and Western Medicine (WM) from 1996 to 2001 in Taiwan.
Year Valid beneficiaries Total TCM visits TCM visits per person % change from previous year
Total WM visits WM visits per person % change from previous year 1996 20,041,488 24,094,552 1.20 221,566,817 11.06 1997 20,492,317 25,170,073 1.23 2.17% 241,309,995 11.78 6.51% 1998 20,757,185 26,641,926 1.28 4.50% 259,701,792 12.51 6.25% 1999 21,089,859 27,398,595 1.30 1.22% 273,777,642 12.98 3.76% 2000 21,400,826 26,426,753 1.23 -4.95% 267,924,732 12.52 -3.56% 2001 21,653,555 26,492,367 1.22 -0.92% 267,412,756 12.35 -1.36%
Table 10: Number and percentage distribution of visits to Western Medicine by major disease category from 1996–2001 in Taiwan.
Major disease category ICD-9-CM code range Visits %
Diseases of the respiratory system 460–519 1,347,671 45.9% Diseases of the digestive system 520–579 324,820 11.1% Diseases of the nervous system and sense organs 320–389 297,257 10.1% Diseases of the musculoskeletal system and connective tissue 710–739 251,625 8.6% Diseases of the circulatory system 390–459 228,051 7.8% Diseases of the genitourinary system 580–629 210,842 7.2% Diseases of the skin and subcutaneous tissue 680–709 198,619 6.8% Symptoms, signs, and ill-defined conditions 780–799 148,989 5.1% Endocrine, nutritional and metabolic diseases and immunological disorders 240–279 138,771 4.7%
Injury and poisoning 800–999 97,843 3.3%
Total visits 2,935,480 100.0%
Data were obtained by 1:500 sampling from National Health Insurance files in Taiwan (see text for detail). All diagnoses at each claim were taken into consideration.
Abbreviations
TCM: traditional Chinese medicine
CAM: complementary and alternative medicine NHI: National Health Insurance
NHIRD: National Health Insurance Research Database ICD-9-CM: International Classification of Diseases, Ninth Revision, Clinical Modification
Competing interests
The author(s) declare that they have no competing inter-ests.
Authors' contributions
FPC conceived and carried out the study, performed the data analysis and drafted the manuscript. TJC and LFC participated in the design of the study and helped to per-form the statistical analyses as well as to interpret find-ings. YCC, YYK and FJC performed the statistical analyses, helped to interpret findings and checked the grammar of the manuscript. SJH participated in the design and coordi-nation of the study and helped to draft the manuscript. All authors read and approved the final manuscript.
Acknowledgements
This study is based in part on data from the National Health Insurance Research Database provided by the Bureau of National Health Insurance, Department of Health and managed by National Health Research Institutes in Taiwan. The interpretation and conclusions contained herein do not rep-resent those of Bureau of National Health Insurance, Department of Health or National Health Research Institutes.
We would like to thank Dr. Maw-Shiou Jong and Mr. Yu Chen for assisting in data collection and manuscript editing.
References
1. anonymous: Complementary medicine is booming worldwide.
BMJ 1996, 313(7050):131-3.
2. Eisenberg DM, Kessler RC, Foster C, Norlock FE, Calkins DR, Del-banco TL: Unconventional medicine in the United States.
Prevalence, costs, and patterns of use. N Engl J Med 1993, 328:246-252.
3. Ahmad AW: Determinants of complementary alternative
medicine (CAM) use. Complement Ther Med 2004, 12:99-111.
4. Barnes PM, Powell-Griner E, McFann K, Nahin RL: Complementary
and alternative medicine use among adults: United States, 2002. Adv Data 2004, 343:1-20.
5. MacLennan AH, Wilson DH, Taylor AW: Prevalence and cost of
alternative medicine in Australia. Lancet 1996, 347:569-573.
6. Boon H: Regulation of complementary/alternative medicine:
a Canadian perspective. Complement Ther Med 2002, 10:14-19.
7. Reilly D: Comments on complementary and alternative
med-icine in Europe. J Altern Complem Med 2001, 7(Suppl 1):s23-31.
8. Burg MA, Hatch RL, Neims AH: Lifetime use of alternative
ther-apy: A study of Florida residents. South Med J 1998, 91:1126-1131.
9. Eskinazi DP: Factors that shape alternative medicine. JAMA 1998, 280:1621-1623.
10. Low R: Acupuncture: Technique for successful point selection Oxford: Butterworth-Heinemann; 2001:1-14.
11. Wu Y, Fisher W, Fratkin J: Practical Therapeutics of Traditional Chinese
Medicine Paradigm Publications; 1997.
12. Chen FP, Kung YY, Chen TJ, Hwang SJ: Demographics and
pat-terns of acupuncture use in the Chinese population: The Tai-wan experience. J Altern Complem Med 2006, 12:379-387.
13. Lim MK, Sadarangani P, Chan HL, Heng JY: Complementary and
alternative medicine use in multiracial Singapore.
Comple-ment Thera Med 2005, 13:16-24.
14. Lee JL, Chi C, Lai JS: A critical review of the policy research on
Chinese medicine in Taiwan, 1981–1994. Public Health 1994, 21:97-107. (in Chinese)
15. Wu HC, Lai JN, Yeh CH: Health care policy on traditional
Chi-nese medicine in Taiwan. Taipei City Med J 2005, 2:879-894.
16. Chen CY, Chang SK, Chi C, Chen SC, Lee JL, Lai JS: The factors
which influence people in the utilization of Chinese medi-cine. Chin Med Coll J 1999, 8:77-88. (in Chinese)
17. Chi C: Integrating traditional medicine into modern health
care systems: examine the role of Chinese medicine in Tai-wan. Soc Sci Med 1994, 39:307-321.
18. Chi C, Lee JL, Lai JS, Chen SC, Chen CY, Chan SK: The demand and
supply of Chinese medicine in modern health care system. In
American Public Health Association 119th Annual Meeting, Asia American Scientific Sessions, Wasions, Washington DC ; 1992.
19. Lee CH, Chou YJ, Chen LS, Chang HJ: Utilization of ambulatory
Chinese medical services under the National health Insur-ance in Taiwan. Taiwan J Public Health 2004, 23:100-107. (in
Chi-nese)
20. Lee JC, Chi C, Lai JS: The effects of time, income and price on
the demand for Chinese medicine ambulatorycare. Chin J
Pub-lic Health (Taipei) 1995, 14:470-476. (in Chinese)
21. Cheng SH, Chiang TL: The effect of universal health insurance
on health care utilization in Taiwan: results from a natural experiment. JAMA 1997, 278:89-93.
22. Health and National Health Insurance Annual Statistics Information Services [http://www.doh.gov.tw/statistic/
index.htm]
23. Cheng TM: Taiwan's new national health insurance program:
genesis and experience so far. Health Aff (Millwood) 2003, 22:61-76.
24. An internet resource guide to traditional Chinese medicine in Taiwan. Committee on Chinese Medicine and Pharmacy, Department
of Health, Executive Yuan, R.O.C. Taipei 2004. (in Chinese)
25. Koo J, Desai R: Traditional Chinese medicine in dermatology.
Dermatol Ther 2003, 16:98-105.
26. Liu JY, Chen TJ, Hwang SJ: Concomitant prescription of
non-steroidal anti-inflammatory drugs and antacids in the outpa-tient setting of a medical center in Taiwan: A prescription database study. Eur J Clin Pharmacol 2001, 57:505-508.
27. Chen TJ, Chou LF, Hwang SJ: Application of data-mining
tech-nique to analyze the coprescription patterns for antacids in Taiwan. Clin Ther 2003, 25:2453-2463.
28. Chen TJ, Chou LF, Hwang SJ: Patterns of ambulatory care
utili-zation in Taiwan. BMC Health Serv Res 2006, 6:54.
29. US Department of Health and Human Services from the Centers for Disease control and Prevention/National Center for Health Statistics:
Ambulatory care visits to physician offices, hospital outpa-tient departments, and emergency departments: United States, 1997. Vital and Health Statistics 1999. Series 13, No. 143
30. Cleary-Guida MB, Okvat HA, Oz MC, Ting W: A regional survey
of health insurance coverage for complementary and alter-native medicine: Current status and future ramifications. J
Altern Complem Med 2001, 7:269-273.
31. Wolsko PM, Eisenberg DM, Davis RB, Ettner SL, Philips RS:
Insur-ance coverage, medical conditions, and visits to alternative medicine providers- results of a national survey. Arch Intern
Med 2002, 162:281-287.
32. Eisenberg DM, Davis RB, Ettner SL, Appel S, Wilkey S, Van Rompay M, Kessler RC: Trends in alternative medicine use in the
United States, 1990–1997: results of a follow-up national sur-vey. JAMA 1998, 280:1569-1575.
33. Wolsko P, Ware L, Kutner J, Lin CT, Albertson G, Cyran L, Schilling L, Anderson RJ: Alternative/complementary Medicine: Wider
usage than generally appreciated. J Altern Complem Med 2000, 6:321-326.
Publish with BioMed Central and every scientist can read your work free of charge "BioMed Central will be the most significant development for disseminating the results of biomedical researc h in our lifetime."
Sir Paul Nurse, Cancer Research UK
Your research papers will be:
available free of charge to the entire biomedical community peer reviewed and published immediately upon acceptance cited in PubMed and archived on PubMed Central yours — you keep the copyright
Submit your manuscript here:
http://www.biomedcentral.com/info/publishing_adv.asp
BioMedcentral
34. Tindle HA, Davis RB, Phillips RS, Eisenberg DM: Trends in use of
complementary and alternative medicine by US adults: 1997–2002. Altern Ther Health M 2005, 11:42-49.
35. Hong C: Complementary and alternative medicine in Korea:
current status and future prospects. J Altern Complem Med 2001, 7(Suppl 1):s33-40.
36. Yamashita H, Tsukayama H, Sugishita C: Popularity of
comple-mentary and alternative medicine in Japan: a telephone sur-vey. Complement Ther Med 2002, 10:84-93.
37. Napadow V, Kaptchuk TJ: Patient Characteristics for outpatient
acupuncture in Beijing, China. J Altern Complem Med 2004, 10:565-572.
38. Zollman C, Vickers A: ABC of complementary medicine: Users
and practitioners of complementary medicine. BMJ 1999, 319:836-838.
39. US Department of Health and Human Services from the Centers for Disease control and Prevention/National Center for Health Statistics:
Complementary and alternative medicine use among adults: United States, 2002. Vital and Health Statistics 2004, 343:1-20.
40. Engebreston J: Culture and complementary therapies.
Comple-ment Ther Nurs Midwifery 2002, 8:177-184.
41. Oumeish OY: The philosophical, culture, and historical
aspects of complementary, alternative, unconventional and integrative medicine in the old world. Arch Dermatol 1998, 134:1373-1386.
42. Furnham A, Forey J: The attitudes, behaviors and beliefs of
patients of conventional vs. complementary (alternative) medicine. J Clin Psychol 1994, 50:458-69.
43. Kang JT, Lee KF, Chen CF, Chou P: Factors related to the choice
between traditional Chinese medicine and modern western medicine. J Formos Med Assoc 1994, 93(Suppl 1):s49-55.
44. Long L, Huntley A, Ernst E: Which complementary and
alterna-tive therapies benefit which conditions? A survey of the opin-ions of 223 professional organizatopin-ions. Complement Ther Med
2001, 9:178-185.
45. Ma GX: Between two worlds: the use of traditional and
West-ern health services by Chinese immigrants. J Commun Health
1999, 24:421-437.
46. Druss BG, Rosenheck RA: Association between use of
uncon-ventional therapies and conuncon-ventional medical services. JAMA
1999, 282:651-656.
47. Paramore LC: Use of alternative therapies: Estimates from the
1994 Robert Wood Johnson Foundation National Access to Care Survey. J Pain Symptom Manag 1997, 13:83-89.
48. Chou P: Factors related to utilization of traditional Chinese
medicine in Taiwan. Chin Med J (Taipei) 2001, 64:191-202.
49. Chan MF, Mok E, Wong YS, Tong TF, Day MC, Tang CK, Wong DH:
Attitudes of Hong Kong Chinese to traditional Chinese med-icine and Western medmed-icine: survey and cluster analysis.
Complement Ther Med 2003, 11:103-109.
50. Astin JA: Why patients use alternative medicine: results of a
national survey. JAMA 1998, 279:1548-1553.
51. Hedderson MM, Patterson RE, Neuhouser ML, Schwartz SM, Bowen DJ, Standish LJ, Marshall LM: Sex differences in motives for use
of complementary and alternative medicine among cancer patients. Altern Ther Health M 2004, 10:58-64.
52. Huber R, Koch D, Beiser I, Zschocke I, Luedtke R: Experience and
attitudes towards CAM- a survey of internal and psychoso-matic patients in a German university hospital. Altern Ther
Health M 2004, 10:32-36.
53. Chi C, Lee JL, Lai JS, Chen CY, Chang SK, Chen SC: The practice of
Chinese medicine in Taiwan. Soc Sci Med 1996, 43:1329-1348.
54. Blais R, Maiga A, Aboubacar A: How different users and
non-users of alternative medicine. Can J Public Health 1997, 88:159-162.
55. Millar WJ: Use of alternative health care practitioners by
Canadians. Can J Public Health 1997, 88:154-158.
56. Hagen LE, Schneider R, Stephens D, Modrusan D, Feldman BM: Use
of complementary and alternative medicine by pediatric rheumatology patients. Arth Rheum 2003, 49:3-6.
57. Linde K, Vickers A, Hondras M, Riet G, Saller R, Melchart D:
Sys-tematic reviews of complementary therapies – an annotated bibliography. BMC Complement Altern Med 2001, 1:3-12.
58. Andrews L, Lokuge S, Sawyer M, Lillywhite L, Kennedy D, Martin J:
The use of alternative therapies by children with asthma: a brief report. J Paediatr Child Health 1998, 34:131-4.
59. Kung YY, Chen YC, Hwang SJ, Chen TJ, Chen FP: The prescriptions
frequencies and patterns of Chinese herbal medicine for allergic rhinitis in Taiwan. Allergy 2006, 61:1316-1318.
60. Focman B: Epidemiology of urinary tract infections: incidence,
morbidity, and economic costs. Am J Med 2002, 113(Suppl 1A):5S-13S.
61. Hui KK, Zylowska L, Hui EK, Yu JL, Li JJ: Introducing integrative
east-west medicine to medical students and residents. J Altern
Complem Med 2002, 8:507-515.
62. Giordano J, Garcia MK, Strickland G: Integrating Chinese
tradi-tional medicine into a US public health paradigm. J Altern
Complem Med 2004, 10:706-710.
Pre-publication history
The pre-publication history for this paper can be accessed here: