行政院國家科學委員會專題研究計畫 成果報告
邏輯斯迴歸之穩健診斷分析
計畫類別: 個別型計畫 計畫編號: NSC92-2118-M-004-005- 執行期間: 92 年 08 月 01 日至 93 年 08 月 31 日 執行單位: 國立政治大學統計學系 計畫主持人: 鄭宗記 報告類型: 精簡報告 報告附件: 出席國際會議研究心得報告及發表論文 處理方式: 本計畫可公開查詢中 華 民 國 93 年 11 月 24 日
Robust Diagnostics for the Logistic Regression Model
Tsung-Chi Cheng
∗Abstract
Current imputation methods, such as the EM types, are easily affected by outliers. They may either impute extra outliers if the existing outliers are ignored, or may move (potential) outliers to the center of the data when only part of them are observed. Atkinson and Cheng (2000) first employ the high breakdown estimator for the detection of outliers in the presence of missing values for the linear regression model. Recently, Atkinson and Riani (2001) adapt the forward search algorithm for the least median of squares (LMS) estimator to deal with outlier problem in the binary data. In this article, we extend their approach to identify multiple outliers for the logistic regression model when part of data are missing. The proposed forward algorithm starts with using the imputation method based on a small subset of the data to fill in those missing observa-tions in the whole data set. Then the subset augments until all observaobserva-tions are included in the analysis. The algorithm monitors the statistics of interest during the progress of the forward search. The LMS criterion is used to judge the performance of each search. Real data are used to illustrate the resulting procedure.
Keywords: EM algorithm; forward search algorithm; high breakdown point; incomplete
data; logistic regression model; robust diagnostics.
1
Introduction
Multiple outliers may strongly affect the generalized linear model fitted to data. However, those observations may be difficult to identify. The deletion diagnostics described in Cook and Weisberg (1982) and Atkinson (1985) for linear regression model may fail due to the masking and swamping effects. For the generalized linear models deletion diagnostics was first discussed by Pregibon (1981) and then summarized by McCullagh and Nelder (1989, Chapter 12). Haslett (1999) uses multiple-deletion diagnostics to the problem of multiple outliers, which may likewise fail either owing masking or computational requirement and
∗Department of Statistics, National Chengchi University, 64 Chih-Nan Road, Section 2, Taipei 11623,
interpretability if there are too many outliers. When there are several outliers, they may not be obviously revealled from the classical residual plots. Hence, it essentially requires high breakdown estimators for the identification of multiple outliers.
During the last few years, there have been attempts to explore and develop robust methods for the generalized linear models. Stefanski et al. (1986) and K¨unsch et al. (1989) propose bounded influence estimators which depend on an auxiliary centering constant and nuisance matrix. Christmann (1994) suggests the least median weighted squares (LMWS) estimator in logistic regression model for large strata data, which first transforms the binomial data by multiplying each observation with a proper weight, followed by the application of the least median of squares (LMS) algorithm to the transform data. Recently, Kordzakhia et
al. (2001) present robust M-estimates based on influence function approach for the multiple
logistic regression model. Christmann and Rousseeuw (2001) and Rousseeuw and Christmann (2003) discuss robustness and outliers in the logistic regression model. Atkinson and Riani (2001) adapt the LMS of the forward search algorithm (Atkinson 1994) to deal with the problem of the detection of multiple outliers in binomial data. M¨uller and Neykov (2003) apply the trimmed likelihood estimator for the generalized linear model, which is based on trimming the likelihood function rather than directly trimming the data.
On the other hand, data are often collected in which some observations are incomplete. With missing data, a simple and thus popular approach is to do an analysis throwing out all subjects with any missing data. Such a “complete case analysis” is often a wasteful of information, because the omitted units carry information with respect to the relation between the observed covariates and the outcome variable. The complete-case estimates could be inefficient compared to a likelihood method that uses the incomplete data and would be biased if the complete cases are not a random subset of the full dataset. Hence, the detection of outliers only considered in complete cases may be unreliable.
Maximum likelihood procedures for analysis mixed continuous and categorical data with missing values are presented by Little and Schluchter (1985). When the missing covariates are categorical, a useful technique for obtaining parameter estimates is the EM algorithm by the method of weights proposed by Ibrahim (1990). Ibrahim, Chen and Lipsitz (1999) extend this method to continuous or mixed categorical and continuous covariates, and for arbitrary para-metric regression models, by adapting a Monte Carlo version of the EM algorithm discussed
by Wei and Tanner (1990).
In this article, we propose a robust procedure for the detection of multiple outliers in generalized linear model with incomplete data. The proposed algorithm is basically a combi-nation of two procedures, the forward search algorithm and the EM algorithm. The algorithm starts by firstly choosing a subset of “good” points from the completely observed data, and then fill in the missing data by using the EM algorithm based on the selected data. Once all missing data are imputed, we can obtain the residuals for the whole data. Based on the ordering residuals, observations in the subset are augmented. The procedure ends until when all data points are included.
2
Logistic regression model
Let there be n binomial observations of the form yi/mi, i = 1, 2, . . . , n, where E(yi) = miπi and
πi is the success probability corresponding to the ith observation. The binomial distribution
for a fixed number of trials is determine by the probability π of success. Both the mean and the variance depend only on πi and the known number mi of trials.
For each yiwe know the number of trials mi, and in addition there is an associated vector of
p+1 predictors xi. Assume that the probability of success depends on xi, then the probability
function of y can be written as
πi = f (y; β) = exp(x T i β) 1 + exp(xT i β) . (1)
Note that 0 ≤ πi ≤ 1 for all values of β and xi. The log odds ratio,
log µ πi 1 − πi ¶ = xTi β ,
is linear in the parameters β. The logistic regression may be viewed as a nonlinear model with heterosceddastic errors. That is,
Y = Xβ + ², ² ∼ bin(m, π), (2)
where ² = (²1, . . . , ²n), E(²i) = miπi and Var(²i) = miπi(1 − πi).
In order to fit a linear logistic model to a given set of data, the p + 1 unknown parameters
the method of maximum likelihood. The likelihood function is given by L(β) = n Y i=1 Ã mi yi ! πyi i (1 − πi)mi−yi .
This likelihood depends on the unknown success probabilities πi, which in turn depend on
the βs through equation (1), so the likelihood function can be regarded as a function of β. The logarithm of the likelihood function is
log L(β) = X i ( log à mi yi ! + yilog πi+ (mi− yi) log(1 − πi) ) = X i ( log à mi yi ! + yilog( πi 1 − πi ) + milog(1 − πi) ) = X i ( log à mi yi ! + yiηi − milog(1 + eηi) ) , where ηi = Pp
j=0βjxji and x0i= 1 for all i = 1, . . . , n. Taking derivatives of this log-likelihood
function with respect to the p + 1 unknown parameters and equating them to zero, we obtain a set of a p + 1 non-linear equations. Then the maximum likelihood estimate ˆβ is obtained.
Once the estimate of β is obtained, the estimated value of the model is ˆ
ηi = ˆβ0+ ˆβ1x1i+ ˆβ2x2i+ · · · + ˆβpxpi .
The fitted probabilities ˆπi can then be found using ˆπi = exp(ˆηi)/[1 + exp(ˆηi)].
In linear regression, summary measures of the fit, as well as diagnostics for casewise effect on the fit, are functions of a residual. In logistic regression there are several possible ways to measure the difference between the observed and the fitted values, one of which is the deviance residual. The ith deviance residual is defined as
di = sign(yi− ˆyi) v u u t2y ilog à yi ˆ yi ! + 2(mi− yi) log à mi− yi mi− ˆyi ! , (3)
where “sign” denotes the sign of (yj− ˆyj). When the response is binary, the deviance residual
becomes
di = −2sign(yi− ˆpi)
q
yilogˆpi+ (1 − yi)log(1 − ˆpi). (4)
The deviance residual provides information about how well the model fits each particular observation. The advantage of this statistics is that a single number is used to summarized considerable information.
2.1
Example: the recumbent cow survival data
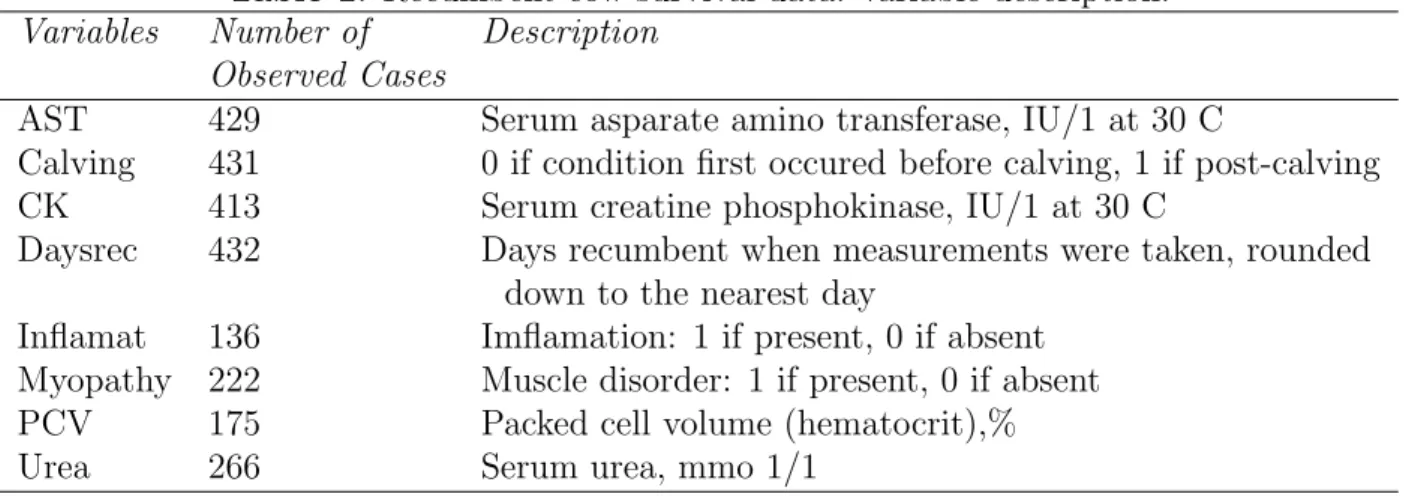
This example is a study from 435 recumbent cows, collected at the Ruakura Animal Health Laboratory, New Zealand, during 1983-1984. Some cows become unable to support their own weight, just before or after calving, so they become recumbent. The goal of the study is to determine if any of the physical measurements and blood test are related to survival probabilities for the cows, and how survival probabilities varies with characteristics.
There are eight factors that effect the survival probabilities of the cows, which are defined in Table 1. The response variable is binary, which is coded 1 if survived, 0 if died or killed. None of the explanatory variables are fully observed, because some measurements are only available during the second year.
Table 1. Recumbent cow survival data: variable description.
Variables Number of Description
Observed Cases
AST 429 Serum asparate amino transferase, IU/1 at 30 C
Calving 431 0 if condition first occured before calving, 1 if post-calving CK 413 Serum creatine phosphokinase, IU/1 at 30 C
Daysrec 432 Days recumbent when measurements were taken, rounded down to the nearest day
Inflamat 136 Imflamation: 1 if present, 0 if absent Myopathy 222 Muscle disorder: 1 if present, 0 if absent PCV 175 Packed cell volume (hematocrit),% Urea 266 Serum urea, mmo 1/1
If missing values are omitted to fit a logistic regression including the intercept term, indi-cator variables for Calving, and Myopathy, the variable Daysrec, and base-two logarithms of
AST and CK, Table 2 shows the estimation result by 216 fully observed cases. The deviance
for the fit is 211.268, and the Pearson’s χ2 statistics has the value 207.681 with 210 d.f’s.
Hence, the logistic regression model fits the observed data very well. Figure 1 shows the deviance residuals plot, in which only six observations have deviance residuals slightly larger than ±2. Cook and Weisberg (1999) conclude that there is no any outlier in complete data analysis .
Variables Coefficient Std. Error t value (Intercept) 1.23649835 1.6091425 0.7684207 Calving -0.30331715 0.4068258 -0.7455701 Myopathy -1.84036905 0.6080790 -3.0265296 Daysrec -0.05459210 0.1119614 -0.4875977 AST 0.03881005 0.2630031 0.1475650 CK -0.15257528 0.1440310 -1.0593224
3
The forward search algorithm in logistic regression
Atkinson and Riani (2000) apply the forward search algorithm to obtain the robust diagnostic result for the logistic regression model. The procedure is summarized as follows. If the model contains p + 1 parameters, the algorithm starts with the selection of a subset of p + 1 units. Either by sampling 1,000 subsets or by exhaustively evaluating all subsets. Let Sjp+1 be a subset of size p + 1 that is selected at step j of the forward search. Recalled the deviance defined in (3), if di,sp+1
j is the deviance residual for unit i given that observations in S
p+1 j are
used in fitting the model, the initial subset is such that
d2
[med],sp+1∗ = minj (d
2
[med],sp+1j ), (5)
where d2
[l],Sjp+1 is the lth ordered squared deviance residuals among d 2
i,Sjp, i = 1, ...n and l =
p + b(n − p)/2c. Observations in this subset are intended to be outlier free. In this resampling
algorithm the model is fitted to m = p + 1 observations, when the remaining n − (p + 1) observations can be tested to see if any outliers are present.
Given a subset of size m ≥ p + 1, say S∗(m), the forward search moves to dimension m + 1
by selecting the m + 1 units with the smallest squared deviance residuals, the units being chosen by ordering all squared deviance residuals d2
i,Sm
∗ , i = 1, . . . , n. Repeat until all units are included in the subset.
Suppose at some step in the forward search the set of m observations used in fitting is
S∗(m). Fitting to this subset is by least squares yielding the parameter estimates ˆβm∗. We can
calculate a set of n deviance residuals d∗
m from these parameter estimates. There will then
be n − m observations not used in fitting that may contain outliers. Monitor the changes in the forward plot as m goes from p + 1 to n, quantities such as the deviance residuals, and the
with the introduction of a particular group of observations. In most moves from m to m + 1 just one new unit joins the subset. When the search includes one unit which belongs to a cluster of outliers, at the next step the remaining outliers in the cluster seems less outlying and so several may be included at once.
Through the joint examination of simple plots, which monitor the effect on the deviance residuals of the sequential inclusion of the units, we can obtain great insight into the structure of the data. The method is not sensitive to the selection of an initial subset. Details of forward search algorithm will be state in the following.
3.1
Step 1: Choice of the initial subset
Let U = (X, y) be n observations. The fitted model takes the form in (2). If the model contains
p + 1 parameters, forward search algorithm starts with selection of a subset of p + 1 units.
Observations in this subset are intended to be outlier free. The choice of initial subset can be performed by exhaustive enumeration of all distinct p + 1-tuple Si(p+1)1,...,ip+1 ≡ ui1, . . . , uip+1, where uT
i1 is the i1th row of U, for 1 ≤ i1, . . . , ip ≤ n, and ij 6= ij0. Let ι
0
= [i1, . . . , ip+1] and
let di,S(p+1)
ι be the least squares deviance residual for unit i given observations in S(p+1)ι. The initial subset must satisfy
d2
[med],S∗(p+1) = minι (d
2
[med],S(p+1)ι ), (6) where d2
[l],S(p+1)ι is the lth order squared residual among d
2
i,Sι(p+1), i = 1, . . . , n, and med is the integer part of (n + p + 1)/2. If both n and p are small, the choice can be performed by exhaustive enumeration of SP +1
j , otherwise we evaluate the properties of some large number,
usually 1,000 subsamples are drew. For large n or p, a large number of subsamples of p observations is taken.
3.2
Step 2: Adding observations during the forward search
The forward search selects the m + 1 units with the smallest squared deviance residuals, the units being chosen by ordering all squared deviance residuals d2
i,Sm
∗ , i = 1, ..., n. The residuals are computed by (5), where ˆβ is the maximum likelihood estimated coefficients of the first m
units included in the model.
In most moves, just one new unit joins the subset. When two or more units join S∗(p+1)
of outliers, then in the next step the remaining potential outliers in the cluster seem less outlying and so several may be included at once. The introduction of influential observations is signaled by sharp changes in the curves that monitor parameter estimates, t test or an other statistic at each step. For monitoring the effect of individual observations on statistics and parameter estimates is helpful to be able to connect particular effects with particular observations. Forward search is accomplished by repeating this step.
3.3
Step 3: Monitoring the search
The forward search algorithm repeats Step 2 until all units are included in the subset. One of the most important plots monitors all deviance residuals at each move of the forward search. Large values of the deviance residuals among cases not in the subset indicate the presence of outliers.
4
Forward search for the binary response
Binary data are binomial data with each mi = 1. The analysis is similar to that for binomial
data with large mi. However the binary responses lead to problems that do not arise for
binomial data (Atkinson and Riani, 2001). In general the numbers of zero and one responses will not be equal. Suppose that zeroes predominate. Then a fit just to observations with a zero response will exactly fit enough of the data to give a value of zero for the residual to modify the search to avoid including only observations of one kind. This requires modification both of the initial subset and of the progress of the search.
Atkinson and Riani (2000) modified the search as follows: the initial subset is constrained to include at least one observation of each type. During the search, balance the ratio of zeros and ones in the subset so that it is as close as possible to the ratio in the complete set of n observations. Given a subset of size m we fit the model and then separately order the observation with zero response and those with unit responses. From these two lists of observations, we then take the m0 smallest squared deviance residuals from the zero responses
and m1 smallest squared deviance with unit responses such that m0+ m1 = m + 1 and the
ratio m0/m1 is close as possible to the ratio n0/n1 in the whole set of observations, where
4.1
Example: the recumbent cow survival data (continued)
Applying the algorithm of Atkinson and Riani (2000) to the recumbent cow data in previous section, many potential outliers are identified, that is, observations with deviance residuals larger than 2 in absolute value. LMS of the search occurs at the 129th step of the search. At this step, 77 observations has deviance residuals larger than 2.5. Once the potential outliers are included, the remaining potential outliers seems less outlying. Observations identified to be extreme by the classical method are included in these 77 observations.
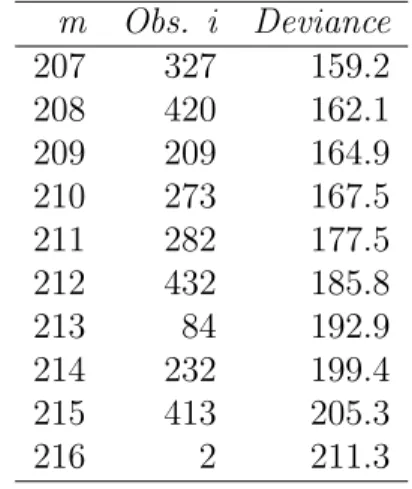
The last 10 observations included in the search are listed in Table 3, together with the corresponding deviance. As the last column of the table shows, there is a steadily upward trend in the deviance as each observation is added. The large proportion of potential outliers may be caused by the deleting of large amounts of information, that is, omit from a logistic regression analysis any case that has a missing value for any variable. Omitting them from the model will tend to introduce bias in the estimation of the coefficients. There are variations of these estimated parameters during the forward search, and the variations indicate the inclusion of influential observations. Note that, we take the unbalance method in this search. This is because of the singularity problem occurred during the search.
Table 3. (Recumbent cow survival data) : the last 10 stages of the forward search.
m Obs. i Deviance 207 327 159.2 208 420 162.1 209 209 164.9 210 273 167.5 211 282 177.5 212 432 185.8 213 84 192.9 214 232 199.4 215 413 205.3 216 2 211.3
5
Missing values
In this section we introduce the most commonly used method for imputation of the incomplete data. Little and Schluchter (1985) discuss a model for missing data with mixed normal and categorical variables and provide relatively simple and computationally EM algorithm with
missing data. Schafer (1997) tries to simulate posterior draws of multiple imputations of the missing data. To save computation time, we only consider single imputation method instead of multiple imputations. We also assume that the missing data are missing at random (MAR). MAR means that the probability that an observation is missing may depend on Yobs but not
on Ymis, where Yobs and Ymis denote the fully-observed data and missing data, respectively
(see Rubin (1976)).
Let R be an n × p matrix of indicator variables whose elements are zero or one depending on whether the corresponding element of Y are missing or observed. The distribution of R is related to Y . Hence we posit a probability model for R, P (R|Y, ξ), which depends on Y as well as some unknown parameters ξ. The MAR assumption is that this distribution does not depend on Ymis,
P (R|Yobs, Ymis, ξ) = P (R|Yobs, ξ).
Throughout, we assume that the missing responses follow a monotone pattern. The miss-ingness pattern for a data matrix is said to be monotone if, whenever an element yij is missing,
yik is also missing for all k > j (Rubin, 1974; Little and Rubin, 1987). Monotone missing
pattern will achieve stationary more rapidly than ordinary data argumentation
5.1
Notations
Let W1, W2, . . . , Wp denote a set of categorical variables and Z1, Z2, . . . , Zq a set of continuous
variables. If these variables are recorded for a sample of n units, the result is an n×(p+q) data matrix (W , Z), where W and Z represent the categorical and continuous parts, respectively. The categorical data W may be summarized by a contingency table. Suppose that Wj
takes possible values 1,2,. . . ,dj, so that each unit can be classified into a cell of a p-dimensional
table with total number of cells equal to D = Πpj=1dj. The frequencies in the complete-data
contingency table will be
x = {xw : w ⊂ W },
where xw is the number of units for which (W1, W2, . . . , Wp) = w, and W is the set of all
possible w.
The general location model, named by Olkin and Tate (1961), defined in terms of the marginal distribution of W and the conditional distribution of Z given W . The former is
described by a multinomial distribution on the cell counts x,
x|π ∼ M(n, π),
where π = {πd : d = 1, 2, . . . , D} is an array of cell probabilities corresponding to x. Given
W , the rows of zT
1,zT2,. . . ,zTn of Z are then modeled as conditionally multivariate normal. Let
Ed denote a 1 × D vector with 1 as the dth entry and 0s elsewhere.
We assume
(zi|wi = Ed) ∼ N(µd, Σ), (7)
independently for i = 1, 2 . . . , n, where µd is a q-vector of means corresponding to cell d, and
Σ is a q × q covariance matrix. The means of Z1, Z2, . . . , Zq are allowed to vary from cell to
cell, but a common covariance structure Σ is assumed for all cells. The parameters of the general location model will be written as
θ = (π, µ, Σ), (8)
where µ = (µ1, µ2, . . . , µD)T is a D × q matrix of means. The number of parameters to be
estimated in the model is thus
(D − 1) + Dq + q(q + 1)/2.
5.2
EM algorithm
The EM algorithm is a general technique for finding maximum-likelihood estimates for para-metric models when the data are not fully observed. The fact that missing data contains information relevant to estimating θ, and θ in turn helps us to find likely values of missing data. Dempster, Laird and Rubin (1977) suggest the following scheme for estimating θ in the presence of the observed data alone: “Input” the missing data based on an initial estimate of θ, re-estimate θ based on the observed data and the filled-in data and iterate until the estimates converge, naming the algorithm Expectation-Maximization or EM.
Now suppose some of the Z’s and W ’s are missing. For subject i, let Zobs,idenote the vector
of observed continuous variables, Zmis,i denote the vector of missing continuous variables,
and Si denote the set of cells in the contingency table where subject i could lie, given the
observed categorical variables. Consider the EM algorithm for ML estimation of θ given data
{Zobs,i, Si : i = 1, . . . , n}.
5.2.1 The E-step
To begin, specify initial estimates of the cell means Γ(0) = [µ(0)1 , . . . , µ(0)D ], cell probabilities
π0 = (π(0)
1 , . . . , πD(0))T, and covariance matrix Ω(0). At iteration t the E step computes the
expected values of the complete-data sufficient statistics given data {Zobs,i, Si : i = 1, . . . , n}
and current parameter estimates θ(t) = (Γ(t), Ω(t), Π(t)). The E step of the algorithm computes
T1i = E(ZiZiT|Zi,obs, Si, Γ(t), Ω(t), π(t)), T2i = E(WiZ 0 i|Zi,obs, Si, Γ(t), Ω(t), π(t)), (9) T3i = E(Wi|Zi,obs, Si, Γ(t), Ω(t), π(t)). 5.2.2 The M-step
Computes the complete-data ML estimates with complete-data sufficient statistics replaced by their estimates from the E step:
π(t+1) = n−1 n X i=1 T3i, Γ(t+1) = D−1(Xn i=1 T2i), (10) Ω(t+1) = n−1 Xn i=1 T1i− Ã n X i=1 T2i !T D−1 Ã n X i=1 T2i ! .
where D is matrix with elements of PT3i along the main diagonal and 0’s elsewhere. The
algorithm then returns to the E step to recomputed (10) with the new parameter estimates, and cycle back and forth between E and M steps until convergence.
5.2.3 The I-step
It is convenient to input the missing data for unit i in two stages: first by deciding the cell to which unit i belongs; the cell probabilities are given by (12). After assigning unit i to cell w, we may input the missing continuous variables in zi(mis) according to the multivariate
regression on zi(obs). The regression predictor of zi(mis) is
z∗
w,ij = µ∗w,j +
X σ∗
jkzik,
where j indicates the missing covariate in unit i, and µ∗
w,j, σjk∗ are current estimates after the
sweep operations are done.
5.3
Details of the E-step calculations
As shown by Little and Schluchter (1985), the discriminates δ∗
w,i and the parameters of the
conditional normal distribution of zi(mis), θ(t) = (Γ(t), Ω(t), Π(t)) can be obtained by a single
application of the sweep operator. Arrange the parameters into a matrix
θ = Ã Ω ΓT Γ P ! .
where P is a D × D matrix with elements Pw = 2logπw on the diagonal and zeros elsewhere.
Sweep this θ-matrix on the positions in Ω corresponding to zi(obs) and obtained
θ∗ = Ã Ω∗ Γ∗T Γ∗ P∗ ! .
Calculation of T3i involves finding E(wi|Zobs,i, Si, θ(t)) for each subject. The mth components
of this vector will be denoted ωim = Pr(ωi = Em|Zobs,i, Si, θ(t)), the conditional posterior
probability that subject i belongs in cell m, given the observed continuous variables. ωim
takes the form
ωim= exp(δm)/
X
m∈Si
exp(δm), (11)
where
δm = zobs,iΩ−1obs,i,µTobs,i,m−
1
2µobs,i,mΩ
−1
obs,iµTobs,i,m+ ln(πm), (12)
and µobs,i,m and Ωobs,i are the cell mean and covariance in cell m of the continuous variables.
The predictive probability can be found by the following two steps: (a) Sweep the θ-matrix on position corresponding to zi(obs) to obtain θ∗; (b) Calculate the discriminates given by (12)
for all cells from zi(obs) and θ∗.
To calculate T1i and T2i, write the continuous variables for subject i as {zij, j = 1, . . . , q}.
Define ˆZij(m) = E(Zij|Zobs,i, wi = Em, θ(t)) as the predicted value of Zij if Zij is missing. The
element in the mth row and jth column of T2i, for m = 1, . . . , D and j = 1, . . . , p, is obtained
by zij or its estimate by the conditional posterior probability that subject i falls in cell m:
E(wimZij|Zobs,i, Si, θ(t)) =
(
ωimZˆij(m) if Zij is missing
ωimZij if Zij is observed
The parts of ˆZij(m) is the predicted values from the multivariate regression of Zi(mis) on Zi(obs) with cell w, ˆ Zij(m) = µ∗ w,j + X σ∗ jkZi(obs) where σ∗ jk is the (j, k)th element of Ω∗.
Given that wi = Em, let σjk,obs,i denote the conditional covariance of Zij and Zik given
Zobs,i. Then the jkth element of T1i, for k = 1, . . . , q is
E(ZijZik|Zobs,i, Si, θ(t)) = ZijZik both Zij,Zik observed Zik P m∈SiωimZˆ (m) ij Zij missing, Zik observed Zij P m∈SiωimZˆ (m) ik Zij observed, Zik missing σik,obs,i+ P m∈SiωimZˆ (m) ij Zˆik(m) both Zij,Zik missing .
The computations of the EM algorithm are easily performed by sweep operations, which was first introduced by Beaton (1964).
6
Robust diagnostics and missing values
In this section, we extend the forward search algorithm to incomplete data, that is, integrate the forward search algorithm and the EM algorithm.
6.1
Combination of EM algorithm and the forward search
To start the forward search with missing data, we first obtain an initial subset from the fully observed data. This can be done by the forward search method for the generalized linear model as shown in Section 3. Once the initial subset is obtained, those missing values can be imputed with the EM algorithm based on the selected observations. To be specific, the calculation of equations (10) is only involved with those selected observations.
6.1.1 Step 1: Choice of the initial subset
Let (W , Z, Y ) be a data containing n observations, where W represents the p categorical variables, Z is a set of q continuous variables, and Y is responses. Hence W and Z together yields the covariates of the data, say X. In order to estimate the unknown parameters in the EM algorithm, the forward search algorithm starts with selection of a subset of m units, where
The initial subset used here is obtained by fitting a logistic regression to the fully observed data. The choice of initial subset can be performed by exhaustive enumeration of all distinct
m-tuple, Si(m)1,...,ip ≡ xi1, . . . , xim, where xTi1 is the i1th row of X, for 1 ≤ i1, . . . , ip ≤ n, and ij 6= ij0. Let ι0 = [i1, . . . , ip] and let r
i,S(m)ι be the least squared deviance residual for unit i given observations in S(m)
ι . After trying some possible subset, say 100, the initial subset must
satisfies d2[med],S(m) ∗ = minι (r 2 [med],Sι(m)) (14) where d2
[l],Sι(m) is the lth order squared deviance residual among d
2
i,S(m)ι , i = 1, . . . , n, and med is the integer part of (n + number of variables + 1)/2. Observations in this subset are intended to be outlier free.
6.1.2 Step 2: Fill-in the missing values based on the chosen subset
Denote M as the set of m observations selected in the subset. Once the initial subset is obtained, apply the EM algorithm to estimate the unknown parameters θ = (Γ, Ω, Π). The missing part of the data can be imputed with these estimates. Specify initial estimates of the cell means Γ(0)M = [µ(0)1 , . . . , µ(0)D ], cell probabilities π0
M = (π
(0)
1 , . . . , π(0)D )T, and covariance
matrix Ω(0)M to begin the EM algorithm. Note that these estimates are based on the selected observations.
At iteration t the E step computes the expected values of the selected complete-data sufficient statistics given data {Xobs,i, S∗(M) : i = i1, . . . , im} and current parameter estimates
θ(t)M = (Γ(t)M, Ω(t)M, Π(t)M), where θ(t)M indicates the parameter estimates base on the selected m observations. The E step of the algorithm computes
T1i,S(m) ∗ = E(ZiZ 0 i|Xi,obs, S∗(m), Γ (t) M, Ω (t) M, π (t) M), T2i,S(m) ∗ = E(WiZ 0 i|Xi,obs, S∗(m), Γ (t) M, Ω (t) M, π (t) M), T3i,S(m) ∗ = E(Wi|Xi,obs, S (m) ∗ , Γ(t)M, Ω(t)M, π(t)M). (15)
Compute the complete-data ML estimates with selected complete-data sufficient statistics replaced by their estimates from the E step:
πM(t+1) = n−1
im
X
i=i1 T3i ,
Γ(t+1)M = D−1 Xim i=i1 T2i , Ω(t+1)M = n−1 Xim i=i1 T1i− Xim i=i1 T2i)TD−1( im X i=i1 T2i . (16)
where D is matrix with elements of PT3i along the main diagonal and 0’s elsewhere. The
algorithm then returns to the E step to recompute (15) with the new parameter estimates, and cycle back and forth between E and M steps until convergence.
The parameter estimates θ(t)M = (Γ(t)M, Ω(t)M, Π(t)M) of the EM algorithm are then used to fill-in the missing part of the data, that is, arrange the parameters into a matrix
θM = Ã ΩM ΓTM ΓM PM ! . (17)
Missing values then can be obtained by application of the sweep operator. 6.1.3 Step 3: Adding observations during the forward search
The forward search selects the m + 1 units with the smallest squared residuals of the fitted data, the units being chosen by ordering all squared deviance residuals r2
i,SM
∗ , i = 1, ..., n. The residuals are computed by (3), where θ is the maximum likelihood estimated coefficients of the previous m units included in the model.
6.1.4 Step 4: Recursion of EM Algorithm and LMS
The algorithm repeats Step 2 and 3 until that all observations are included in the subset. We need apply the EM algorithm based on the selected observations in step 3, re-estimate the unknown parameters, θ = (Γ, Ω, Π), and impute those missing observations. We also fit a logistic regression to the currently selected observations, and order the deviance residuals to decide the observation to be selected for the following step. In each step,
d2
[med],S(m)ι
is retained, where med is the integer part of (n + number of variables + 1)/2 and m is the number of units in the subset.
6.1.5 Step 5: Monitoring the search
Monitor the squared deviance at each step,
d2 [med],Sι(m), d 2 [med],Sι(m+1), . . . , d 2 [med],Sι(n), Choose the smallest deviance residuals of the set, min(r2
[med],Sι(p)), the corresponding subset is then used to estimated the unknown parameters of EM algorithm, and fit the logistic regression. The final result is deviance residuals of all the observations based on corresponding subset. Absolute deviance residuals larger than 2 are the potential outliers.
6.2
Example: Recumbent cow data (continued)
The recumbent cow data introduced in Section 3.5, one objective of this study was to un-derstand the effects of varies characteristic on survival probability of cows just before or just after calving. We consider five covariates. The continuous variables measured on the ith cow are Daysrec, days recumbent when measurements were taken; AST, seurm asparate amino transferase; CK, seurm creatine phosphokinase. Thus there are q = 3 continuous variables and p = 3 categorical variables. These 3 categorical variables form a 2 × 2 × 2 contingency table with 8 cells. The proportion of missing values for each variable is shown in Table 4.
Table 4. Proportion of missing values for recumbent cows data
Variables % missing number
Outcome 0 0 Calving 0.009 4 Myopathy 0.489 213 Dayserc 0.006 3 AST 0.013 6 CK 0.050 22
There are (8 − 1) + 8 × 3 + 3(3 + 1)/2 = 37 unknown parameters. The initial subset of the forward search algorithm then must start with any m ≥ 37 cases. We here use m = 100. Select 100 observations from the 216 complete-observed data.
To find this initial subset involves the LMS method for generalized linear models which was described in Section 3. Arbitrary try 100 possible subsets sampled from the 216 complete-observed observations. Initial subsets are allowed to be different from each, because this does not effect the result; that is, different initial subsets leads to the same conclusion. The chosen units are used to estimate the initial covariance matrix Ω and cell means Γ of EM algorithm, which are used to start the algorithm.
When applying the proposed algorithm, the LMS solution occurs at step 303 of the search. It reveals that 131 observations have absolute deviance residuals larger than 2. It is obvious that there is serious loss of information of deleting missing values from the analysis in com-parison with the previous results.
References
Atkinson, A. C. (1994), “Fast Very Robust Methods for the Detection of Multiple Outliers,”
Journal of the American Statistical Association, 89, 1329-1339.
Atkinson, A. C. and Cheng, T.-C. (2000) “On Robust Linear Regression with Incomplete Data”, Computational Statistics and Data Analysis, 33, 361-380.
Atkinson, A. C. and Riana, M. (2000), Robust Diagnostic and Regression Analysis, New York: Springer-Verlag.
Atkinson, A. C. and Riana, M. (2001), “Regression Diagnostics for Binomial Data from the Forward Search”, The Statistician, 50, 63-78.
Christmann, A. (1994) “Least Median of Weighted Squares in Logistic Regression with Large Strata”, Biometrika, 81, 413-417.
Christmann, A. and Rousseeuw, P. J. (2001) “Measuring Overlap in Binary Regression,”
Computational Statistics and Data Analysis, 37, 65-75.
Collett, D. (1991) Modelling Binary Data, London: Chapman & Hall.
Cook, R. D. and Weisberg, S. (1999) Applied Regression Including Computing and Graphics, New York: John Wiley & Sons.
Croux, C., Flandre, C. and Haesbroeck, G. (2002) “The breakdown behavior of the maximum likelihood estimator in the logistic regression”, Statistics & Probability Letters, 60, 377-386.
Dempster, A. P., Laird, M. and Rubin, D. B. (1977) “Maximum Likelihood from Incomplete Data via the EM algorithm”, Journal of the Royal Statistical Society, Ser. B, 39, 1-38. % item Fuchs, C. (1982), “Maximum Likelihood Estimation and Model Selection in
Contingency Tables with Missing Data,” Journal of the American Statistical Association, 77, 270-278.
Haslett, J. (1999) “A Simple Derivation of Deletion Diagnostic Results for the Generalized Model With Correlated Errors,” Journal of the Royal Statistical Society, Ser. B, 61, 603-609.
Ibrahim, J. G. (1990), “Incomplete Data in Generalized Linear Models,” Journal of the
American Statistical Association, 85, 765-769.
Ibrahim, J. G. and Chen, M. H., Lipsitz, S. R., (1999) “Monte Carlo EM for missing covariates in parametric regression models”, Biometrics, 55, 591-596.
Kordzakhia, N. Mishra, G. D. and Reiersølmoen, L. (2001) “Robust Estimation in the Lo-gistic Regression Model,” Journal of Statistical Planning and Inference, 98, 211-223. K¨unsch, H. R., Stefanski, L. A. and Carrol, R. J. (1989) “Conditionally Unbiased
Bounded-Influence Estimation in Generalized Regression Models With Applications to General-ized Linear Models,” Journal of the American Statistical Association, 84, 460-466. Little, R. J. A. and Rubin, D. B. (1987), Statistical Analysis with Missing Data, New York:
John Wiley.
Little, R. J. A. and Schluchter, M. D. (1985), “Maximum Likelihood Estimation for Mixed Continuous and Categorical Data With Missing Values,” Biometrika, 72, 497-512. McCullagh, P. and Nelder, J. A. (1989) Generalized Linear Models, 2nd ed., London:
Chap-man and Hall.
M¨uller, C. H. and Neykov, N. (2003) “Breakdown Points of Trimmed Likelihood Estimators and Related Estimators in Generalized Linear Models,” Journal of Statistical Planning
and Inference, 116, 503-519.
Olkin, I. and Tate, R. F. (1961) “Multivariate Correlation Models with Mixed Discrete and Continuous Variables,” Annals of Mathematical Statistics, 32, 448-465.
Rousseeuw, P. J. (1984), “Least Median of Squares Regression,” Journal of the American
Statistical Association, 79, 871-880.
Rousseeuw, P. J. and Christmann, A. (2003) “Robustness Against Separation and Outliers in Logistic Regression,” Computational Statistics and Data Analysis, 43, 315-332. Rousseeuw, P. J. and Leroy, A. M. (1987), Robust Regression and Outlier Detection, New
York: John Wiley.
Rubin, D. B. (1976) “Inference and missing data”, Biometrika, 63, 581-592.
Schafer, J. L. (1997) Analysis of Incomplete Multivariate Data, London: Chapman & Hall. Stefanski, L. A., Carrol, R. J. and Ruppert, D. (1986), “Optimally Bounded Score Functions
for Generalized Linear Models With Applications to Logistic Regression,” Biometrika, 73, 413-424.
Schafer, J. L. (1997) Analysis of Incomplete Multivariate Data, London: Chapman & Hall. Wei, G. C. and Tanner, M. A. (1990). ”A Monte Carlo implementation of the EM algorithm
and the poor man’s data augmentation algorithm”, Journal of the American Statistical